Abstract
The article describes research results of damping properties of carbon fiber reinforced plastics (CFRP). The effect of stress/strain levels on the damping value is studied. Research is conducted on flat samples (plates) with different lay-up schemes from 1-layered to 12-layered. The paper contains information about the modal and harmonic tests on the samples and their numerical modeling.
1. Introduction
Modern trends in dynamic strength in rocket space technology dictate avoiding expensive model tests in favor of protoflight tests. These tests are performed on protoflight hardware under qualification and acceptance testing conditions. One of the requirements necessary for conducting such tests is to provide a reliable verified dynamic finite element model (FEM) of the hardware. Creating of models of structures from composite materials raises the question of the choice of the damping coefficient for the calculation. Using of a common approach with linear damping determination without stress dependency cannot create reliable models that will give accurate results if hardware composition or testing conditions are changed. In this regard it is required to investigate the dependence between damping ratio and stress value. The dependence of the damping ration on the vibration amplitude was mentioned also in [1].
2. Experimental details
In order to study the dissipative properties of CFRP, 12 types of flat samples were made with gradual increasing of structure complexity from 1 to 12 layers (3 samples of each type). Corresponding FEM for each sample type was created using ANSYS software. An example of the sample and its FEM are shown in Fig. 1.
Fig. 1Layered composite sample: a) the test sample, b) finite element model of the sample
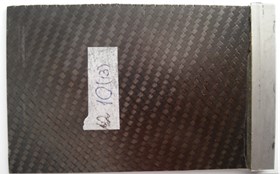
a)
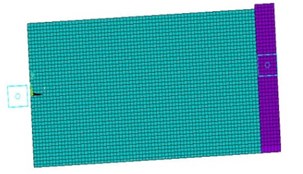
b)
The samples were exposed to different types of dynamic tests. This article contains the results of modal and harmonic testing along with computer modeling.
2.1. Modal analysis
The purpose of the tests is to determine the vibration characteristics (natural frequencies and mode shapes) of a structure. As a result of setting a sample FEM stiffness property of material and boundary conditions are specified according to modal test. Tests were conducted using Polytec scanning laser vibrometer in the frequency range from 0 to 5000 Hz. The experimental and calculated natural frequencies and mode shapes of the sample are shown on Fig. 2. Frequency error in calculations is less than 5 percent. Third mode is the exception; its frequency error is around 11 percent. This verified modal tests model of a sample was also used for harmonic analysis.
Fig. 2Experimental (left) and calculated (right) natural frequencies and mode shapes: first (a, b), second (c, d), third (e, f) and forth (g, h) modes
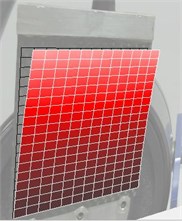
a)Fr = 20.7 Hz
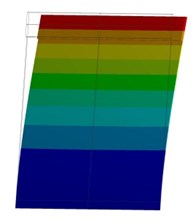
b)Fr = 19.8 Hz
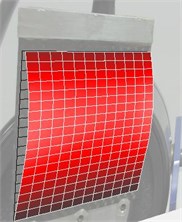
c)Fr = 215.2 Hz
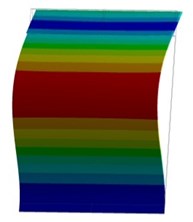
d)Fr = 216.5 Hz
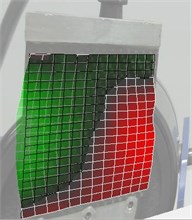
e)Fr = 382.8 Hz
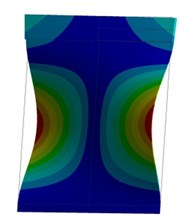
f)Fr = 435.9 Hz
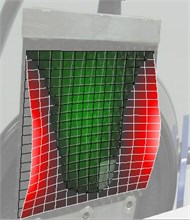
g)Fr = 622.3 Hz
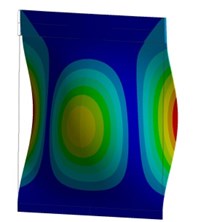
h)Fr = 626.3 Hz
2.2. Harmonic analysis
The purpose of the harmonic test is to determine structure response to the input load. Testing scheme is shown on Fig. 3.
Fig. 3Testing scheme for a sample with three-axis vibration transducer (1) and strain gauge transducer (2)
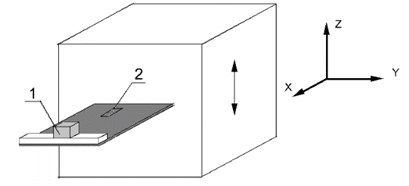
The samples were exposed to sinusoidal input action in a frequency range from 0 to 100 Hz and in a wide amplitude range from 0.2 g to 1.5 g. Sensor data were recorded by three-axis vibration transducer and strain gauge transducer.
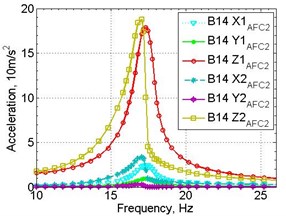
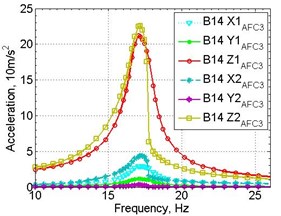
Figure 4 shows an example of obtained amplitude-frequency acceleration response; similar graphs of amplitude-frequency strain response were also obtained.
Fig. 4Experimental amplitude response registered on two samples: a) input 1.0 g, b) input 1.5 g
a)
b)
The values of the first natural frequency of the sample, damping ratio, acceleration amplitude in the direction of input force (Z-axis) and the strain amplitude obtained from the experiments are presented in Table 1.
Table 1Numerical characteristics of the response registered on samples
Sample | Impact, g | Natural frequency, Hz | Acceleration, g | Acceleration amplification factor | Damping ratio | Strain, μE |
1 | 0.2 | 17.3 | 9.6 | 48.0 | 0.0161 | 366 |
1.0 | 17.3 | 17.9 | 17.9 | 0.0360 | 795 | |
1.5 | 17.0 | 21.2 | 14.1 | 0.0484 | 1037 | |
2 | 0.2 | 16.8 | 11.2 | 56.0 | 0.0228 | – |
1.0 | 17.0 | 19.0 | 19.0 | 0.0305 | – | |
1.5 | 17.1 | 22.6 | 15.0 | 0.0401 | – |
Harmonic analysis was also accompanied by computer modelling. Setting damping parameters is required for calculation. The ANSYS software has multiple damping parameters, but all they do not depend on stress-stain state of construction [2]. It is possible to use only the frequency-dependent damping.
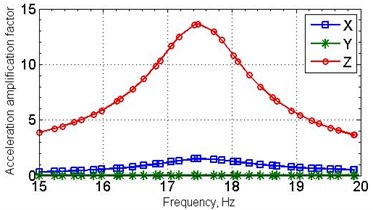
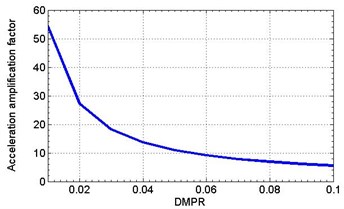
Harmonic analysis was conducted by superposition method which makes it possible to set the frequency-independent damping DMPR. Calculations enable the response of the structure in the place of three-axis vibration transducer installation to be determined. Damping ratio is determined using the half-power method from previously received amplitude frequency response plot [3]. When the same damping parameter DMPR for all materials of the computational model is assigned, attenuation values will be equal to the specified DMPR value. Graphs of acceleration amplification factor versus frequency for DMPR = 0.04 and in relation to DMPR on resonance frequency are shown on Fig. 5.
Fig. 5Calculated amplitude response (a); the dependence of the amplitude response on damping ratio (b)
a)
b)
Experimental acceleration amplification factors registered on two samples were equal to 14.1 and 15.0, whereas the numerical modeling gives the value of 13.6.
In calculation a single impact equal to 1.0 g is applied to model. In experiments the impact varies. To compare experimental and calculation outputs, the main deformation obtained from test data was divided by the value of the input action. Thus for input 1.5 g the experimental main deformation corresponds to 685 μE, whereas the calculated one is 990 μE. The proximity of the experimental and calculated acceleration amplification factors and the difference between the values of the principal strain on the root of the sample may be indicative of the different modes which are connected with the nonuniformity of the damping field due to dependence of the damping ratio upon the stress-strain state of material.
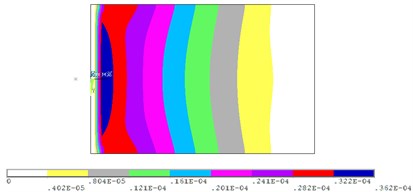
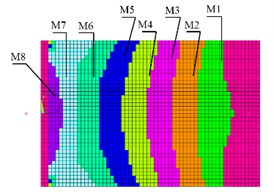
In this regard samples’ FEM were modified. Various materials depending on the stress/strain level have been assigned to elements of computational samples models. Fig. 6 shows the distribution of principal strain in the sample, obtained by calculation with the general damping DMPR 0.04 and sample FEM with different kinds of materials (M1–M8).
Fig. 6Calculated principal strain of the sample (a), sample model with different materials (b)
a)
b)
This model allows specifying different damping values for the model elements depending on the stress levels in the element. This approach allows determining the effect of damping in each zone on the stress (strain) distribution over the sample surface, and, after verification of the model from the test results, to identify the relationship between the stress levels and damping ratio.
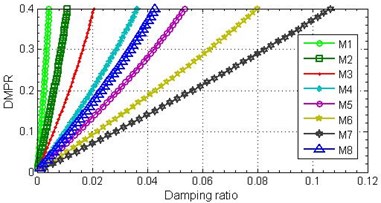
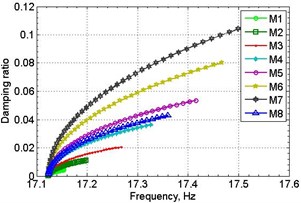
For these purposes, parameter DMPR was alternately varied for each material at a constant zero damping in other materials of the sample and test calculations were carried out. As a result of test calculations the responses at the location of vibration transducer were defined, using which the effective damping ratio by the half-power method and the natural frequency were identified. The results are presented in the form of dependency graphs between the effective damping ratio and DMPR parameter of different materials and as impact of damping ration on the first resonant frequency value shown on Fig. 7.
Fig. 7Relationships between damping ratio and DMPR (a) and first natural frequency (b)
a)
b)
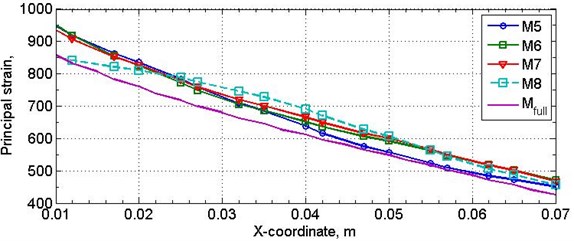
The next step of model verification was to compare differences in the strain (stress) distribution on the sample with the same value of the effective damping ratio (equal to 0.04), which was accomplished by alternately setting the damping parameter DMPR to materials M5–M8 with zero damping in other areas.
Fig. 8 shows the distribution of the principal strain (stress) at the sample central nodes along X-axis for calculation cases 1–4 of Table 2 and using the general damping parameter DMPR (0.04) for all materials. The figure shows the strain difference of 110 μE in the root of the sample obtained for the calculation with damping at the root (M8) by comparison to calculations with damping in other materials (M5-M7).
Table 2Numerical characteristics of the calculated response for different materials
Case | Material | DMPR | Damping ratio | Acceleration amplification factor | Natural frequency, Hz |
1 | 5 | 0.2815 | 0.04 | 13.49 | 17.28 |
2 | 6 | 0.1841 | 0.04 | 13.55 | 17.20 |
3 | 7 | 0.1400 | 0.04 | 13.53 | 17.17 |
4 | 8 | 0.3660 | 0.04 | 13.52 | 17.32 |
Fig. 8The change in principal strain on sample central nodes
3. Conclusions
1) Damping ratio has a significant effect on the response of the structure.
2) Damping value in various zones of the sample affects the shape of the sample modes and insignificantly affects first natural frequency.
3) If the deformation field of the sample during vibration is determined, relationships between strain (stress) and the damping coefficient can be identified.
4) To apply the obtained relationships in calculations an iterative-based algorithm for considering damping non-linearity is needed.
References
-
Khan S. U., Li C. Y., Siddiqui N. A., Kim J.-K. Vibration damping characteristics of carbon fiber-reinforced composites containing multi-walled carbon nanotubes. Composites Science and Technology, Vol. 71, Issue 12, 2011, p. 1486-1494.
-
Mechanical APDL. Release 16.1, Help System, Structural Analysis Guide, ANSYS, Inc.
-
Heylen W., Lammens S., Sas P. Modal Analysis Theory and Testing. Division of Production Engineering, Machine Design and Automation, Leuven (Heverlee), Belgium, 2008.
About this article
The research was supported by “The Tomsk State University Academic D. I. Mendeleev Fund Program”, Grant No. 8.2.19.2015.
