Abstract
This article is about vibration technologies adaptation for polluted surface cleaning. This cleaning method can be adapted in various areas [1-3]. For example, for used automotive air filters cleaning or during operation prolonging their life. Also this method can be used in buildings, because if in house is installed recuperator it is necessary to use air filters. During the exploitation this filters became polluted by contaminant particles. That to increase air filtering quality and prolonging filter life may be used vibration technologies.
1. Introduction
The main idea of the surface cleaning using vibration technology is shown in Fig. 1. This surface cleaning working principle is based on mechanical vibrations. When moving mass hits non-moving mass the contaminant particle with the mass separates from mass . This particle drops down and do not come back on non-moving mass . So in this case only moving mass have constant value. The mass is adhered to mass . This cleaning method can be adapted in various areas. For example, for used filters cleaning or during operation prolongs filter life and etc.
Fig. 1System model of the surface cleaning using vibration technology: 1 – moving mass, 2 – cleaning object, 3 – separated contaminant particle
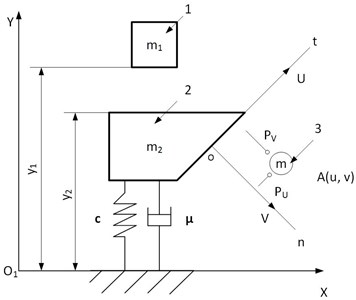
According to Fig. 1, contaminant particle adhesion force can be calculated using mathematical functions. The contaminant particle coordinates can be written:
In coordinate system
In coordinate system:
The contaminant particle connection force can by written via the functions:
This functions can be rewritten:
where – the force when contaminant particle separates from mass 2 ().
For force and calculations it is necessary to write differential equations for contaminant particle motion. When :
In the situation when hits , and , the differential equations can be written:
here , is the instantaneous speed before impact; – impact restitution coefficient. Impact restitution coefficient is between 0 and 1 (01).
Contaminant particle motion equations can be written:
Using Eq. (5-7) can be calculated the contaminant particle adhesion force when separated particle moving angle is 0° (0°).
2. Experimental research of the dust surface profile
According to the main idea of the surface cleaning using vibration technology was decided to make some experimental research. Here was selected filtering material like object which will be polluted and certified dust like contaminant particles. At first it was necessary to check how the dust is distributed on the surface of the filtering material. It was done using these equipment: special paper using for air filter manufacturing), vacuum cleaner with –0.2 bar vacuum force for specimen pollution, test dust manufactured by “PTI Powder Technology inc.“ via the ISO 12103-1, A4 Coarse standard, for polluting specimens; microscope Nikon with objective Nikon TU Plan Fluor 5x/0.15 and video camera Nikon DS-R:2 16 MP for dust height measurements, weighing-machine “KERN PLS 360-3” with the resolution ±0.001 g for weighing dust and “Grade-910” glue manufactured by “Permabond” for gluing the dust on specimen. Specimens were cut with a special knife with a diameter of 50 millimeters (Fig. 2(a). Every specimen was weighted before pollution and polluted by 0.1 g of the test dust. The polluted area was about 706.86 mm2. One of prepared specimen is shown in Fig. 2(b).
After pollution, specimens were marked at the places where the dust height have the biggest differences and precisely clipped (Fig. 3(a)). Later these specimens were marked near the cutting zone by the small points via the CNC laser machine with the resolution of ±10 µm. This machine was designed and developed by KTU. The markers have been set out with 1 mm gap. These points were used for measuring filtering paper width using microscope. Depending on the measured specimen, layer of the dust ranged from ~450 µm up to ~900 µm (Fig. 3(b)).
Measured dust surface profile on different specimens in local areas were shown in Fig. 4. These images shows that at the edges of specimens aren’t dust layers. Because paper thickness is near measured value. However, in the central part of the specimen, the dust is distributed chaotically. This is because the filtering material composed of small fibers, which also located chaotically.
Fig. 2Specimen for surface cleaning using vibration technology
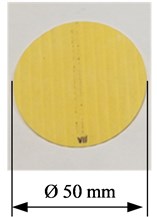
a) Non-polluted
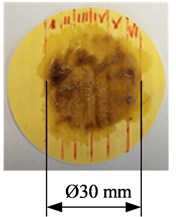
b) Polluted
Fig. 3Prepared specimens for surface profile measurements
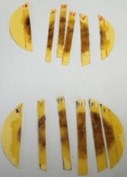
a) Specimens
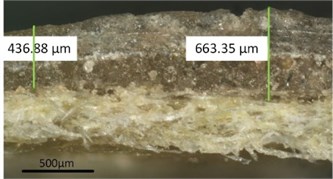
b) Surface profile view under the microscope
Fig. 4Measured dust surface profile on different specimens (–––– – dust, - - - - – filtering material)
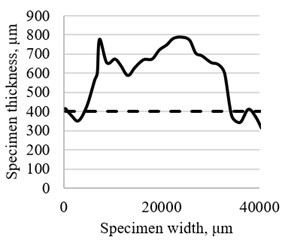
a) Measured results of the 1-st specimen at the cutting zone II
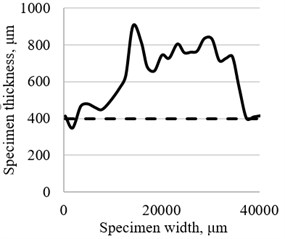
b) Measured results of the 1-st specimen at the cutting zone III
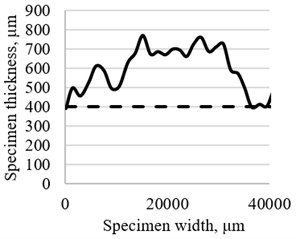
c) Measured results of the 1-st specimen at the cutting zone IV
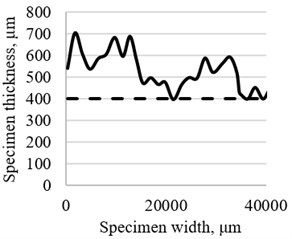
d) Measured results of the 2-nd specimen at the cutting zone II
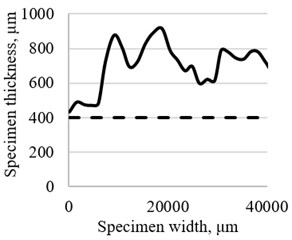
e) Measured results of the 2-nd specimen at the cutting zone III
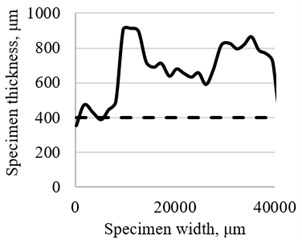
f) Measured results of the 2-nd specimen at the cutting zone IV
3. Experimental research of the impact influence for cleaning polluted surface
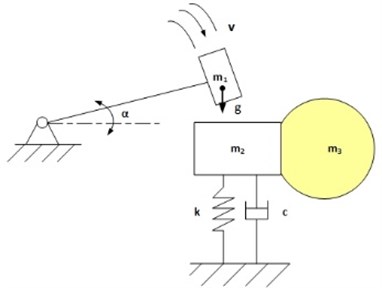
After measurements was founded, that some areas of the dust have small thickness specifically near filtering material thickness, and some areas – big thickness, specifically about two times bigger, comparing with the filtering material thickness. First experimental research shows, that these irregularities on the specimen surface has different adhesion force. Therefore, generated small mechanical vibrations shakes out some dust. It was necessary to check whether the created impact has enough energy to shake out more dust? The experimental setup of this study is shown in Fig. 5(a).
Fig. 5Experimental setup for impact influence of adhere dust research: α – angle of the hammer, m1 – moving mass, m2 – non-moving mass, m3 – specimen mass, k – experimental setup rigidity, c – experimental setup damping ratio. 1 – angle limiter, 2 – resistive angle measuring sensor, 3 – specimen holder, 4 – specimen, 5 – shake out dust, 6 – PC oscilloscope “Picoscope 3424, 7 – Osciloscope “Gwinstek GDS-2304A”, 8 – universal accelerometer “MMF KD-37”, 9 – hammer
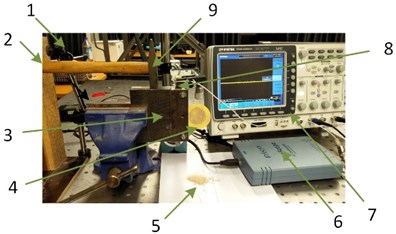
a) Experimental setup
b) Circuit diagram of experimental setup
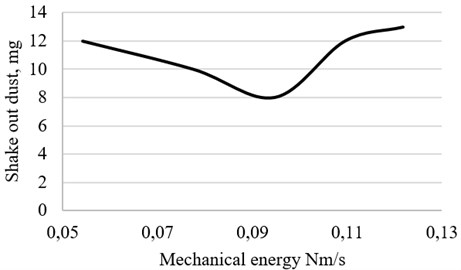
During experiments, specimens were polluted weighted before pollution, after pollution and after impact. Polluted specimens weight differences were up to 3 %. This difference is due to the methodology used for contamination. Because it may be that vacuum pump do not absorb some dust due to clogged pores of filtering material. According to the literature resources [4, 5] were calculated these parameters: mechanical energy and hammer moving speed. Characteristic was formed using the measured values and calculated parameters. This characteristic presented in Fig. 6. Here was founded that the impact strength has less influence than dust adhesion. Therefore, additional studies are needed that to find the strength of dust adhesion.
Fig. 6Experimental results of impact influence for cleaning polluted surface
4. Conclusions
After the surface profile measurements, was founded that the dust distributed chaotically. This is because the filter paper composed of small fibers, which also located chaotically.
After experimental research of the impact influence for dust adhere was founded that the impact strength has less influence than dust adhesion. This is because measured weight of shake out dust do not depend of the impact strength.
Planned future work is dust adhesion force calculations and measurements at the locations where is different dust layer thickness.
References
-
Erem’yants V. E., Panova L. T., Asanova A. A. Choice of rational parameters of vibration-shock machines for surface cleaning. Journal of Machinery Manufacture and Reliability, Vol. 42, Issue 6, 2013, p. 463-467.
-
Rozenberg L. D. Physical Principles of Ultrasonic Technology. Springer, 1976.
-
Di Felice R., Shkrebtii A. I., Finocchi F., Bertoni C. M., Onida G. Surface vibrations at clean and hydrogenated GaAs from ab-initio molecular dynamics. Journal of Electron Spectroscopy and Related Phenomena, Vols. 64-65, 1993, p. 697-706.
-
Mechanical Energy. https://en.wikipedia.org/wiki/Mechanical_energy
-
Mathematics of Circular Motion. http://www.physicsclassroom.com/class/circles/Lesson-1/Mathematics-of-Circular-Motion
