Abstract
This paper describes the comparison of the numerical analyses with the real frequency search test for the distribution transformer. The advanced measurement device (laser scanning vibrometer) and the accelerometers were used to measure the frequencies and the modes of the frequency search test.
1. Introduction
The resonant frequencies and the corresponding mode shapes are one of the most important features of each system. Measured in Hertz (Hz), the resonant frequencies characterize the values for which the system is vibration-sensitive and the amplitude tends to infinity. Since this amplitude can cause the damage of the system, it is very important to find its value.
There are some methods which lead to the determination of the resonant frequencies. One of them is the real frequency search test (i.e. sine sweep). It can be performed on the shake-table. The second method is the snapback test and the third one is the man-shake test [1].
The resonant frequencies obtained in the real frequency search test on the shake-table can be compared to the results of the numerical analyses performed using FEA software such as SIMULIA Abaqus or Ansys Workbench. The analyses in SIMULIA Abaqus could be done using the Frequency step or the Steady-state dynamics, direct step.
2. Overview
For the numerical analyses, the resonant frequencies for the distribution transformer were found during the seismic test. The seismic test was performed through the following steps:
• the static step (i.e. the gravity or another static load can be applied),
• the frequency search step,
• the response spectrum analysis/the sine beat analysis/the time history analysis or another type of the analysis defined by the seismic standard (IEEE, IEC, ASCE, etc.).
The frequency search test is the second step of the three-step seismic test which was performed using Abaqus software. The resonant frequencies and the corresponding mode shapes obtained through the numerical analyses were compared with the results obtained in the real frequency search test performed on the single-axis shake-table. The work that is presented in this paper shows the frequencies and mode shapes measurement done using the advanced vibrometer. The vibrometer is able to quickly and accurately determine the resonant frequencies and their corresponding mode shapes of complex objects across a wide range of frequencies. The great advantage of this device is the ability to measure the vibration not only in the single points, as the accelerometers do, but also its ability to measure the whole surface. This allows to have the complex image of how the whole surface vibrates. In this paper, the results of accelerometer measurements for some single points were also depicted.
One of the biggest issues that a simulation engineer can face is how to model the oil behavior in the transformer tank. A few numerical analyses were performed in order to find the most accurate method. The oil behavior was included using the nonstructural mass, the hydrostatic pressure, acoustic elements or a combination of them. The work presents the results for some approaches mentioned above and outlines the advantages and the disadvantages of each method.
The frequency step result provides a valuable input to the remaining steps of the seismic test.
2.1. Numerical analyses
The first analysis (first case) assumes that the oil was not included in the transformer tank. The FEA model was calculated as an empty tank. The resonant frequencies found in the frequency search test (numerical analyses) are higher than the results of the real frequency search test.
The second model (second case) assumes that the oil was included in the transformer tank. The oil was modelled using the hydrostatic pressure. The resonant frequencies found in the frequency search test (numerical analyses) are also higher than the results of the real frequency search test. In general, the results obtained in the second case are similar to those that were obtained in the first case.
The third model (third case) assumes that the oil was modelled using the nonstructural mass and the hydrostatic pressure. The hydrostatic pressure was calculated based on the formula, please see Eq. (1):
The nonstructural mass is equal to the mass of the oil in the transformer tank. The distribution type which was used is mass proportional. The picture Fig. 1 presents the model for the third case.
The components, with the exception of some parts (i.e. insulators and lower boxes), were modelled using the shell elements (second order elements S8R). The thickness was assigned to the shell elements and the values were taken from the real sheet metal parts of the transformer. The bulk components such as the active part, the insulators and the lower boxes were modelled using the solid elements (second order elements C3D20R). The rods connect the ribs of the radiators. Those rods were modelled using the beam elements (cubic beam elements B33). The upper cover was connected with the remaining parts of the transformer using the bolts. The numerical modelling of bolted joints was carried out by using the connector elements. The bolts were not preloaded. In most cases, the non-conformal mesh was used, which determined the use of the tie contacts. The resonant frequencies found in the frequency search test for the numerical analyses are lower than the results of the real frequency search test. For more details, please see the paragraph 3.
Fig. 1The finite element model for the third case
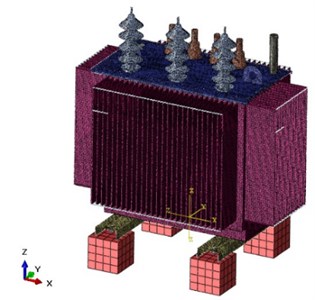
Fig. 2The finite element model for the fourth case
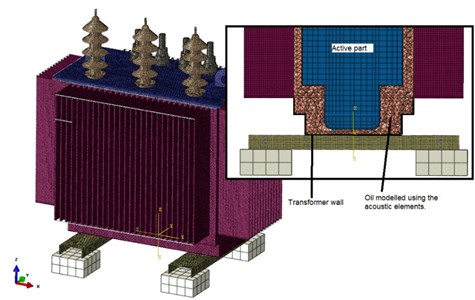
The fourth model (fourth case) assumes that the oil was modelled using the acoustic elements. In general, the approach of the modelling was the same but there were some minor exceptions. The acoustic elements (AC3D4 and AC3D8) were used for modelling oil undergoing small displacements. The acoustic medium has one degree of freedom because it is defined by a single pressure [2]. The picture Fig. 2 presents the model for the fourth case.
The oil was connected with the remaining parts (i.e. the active part or the transformer’s wall) using the tie contacts. The nonstructural mass and the hydrostatic pressure were replaced by the acoustic elements. The resonant frequencies found in the frequency search test for the numerical analyses are higher than the results of the real frequency search test. For more details, please see the paragraph 3.
The special attention was paid to the third and the fourth case which reflect most closely the real conditions (the full modelling of the oil was included). In the reality, the oil has impact on the transformer’s behavior not only in the frequency search step but also during the response spectrum analysis, the sine beat analysis or the time history analysis.
2.2. Real frequency search test
The real frequency search test was carried out on the shake-table twice. The first test was done for the case where the distribution transformer was measured using the advanced vibrometer (test 1) and the second test was done for the case where the distribution transformer was measured using the single accelerometers (test 2). In the case of the first test described in this article, the excitation signal with close to the flat power density spectrum was used for data acquisition on the short and on the long side of the tank (horizontal directions) [3]. The frequency characteristics of both signals are presented in Fig. 3.
Fig. 3The FFT of the excitation signal for measuring short and long wall of the tank in a logarithmic scale
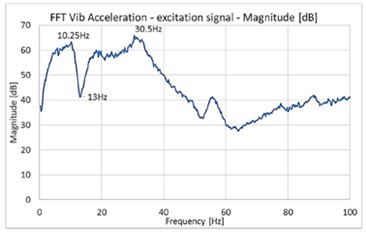
a) Short wall
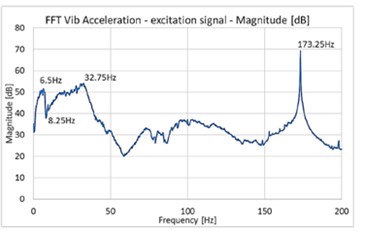
b) Long wall
Fig. 4The distribution of the single accelerometers for the test 2 (blue dots)
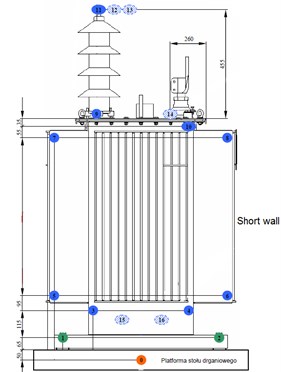
In the case of the second test described in this article, the excitation signal was sine sweep. The signal was applied in three directions separately and was in the frequency range 2.2 Hz-40 Hz. A sine sweep frequency search was conducted at a rate which was equal to one octave per minute. The distribution of the single accelerometers for the test 2 is presented in Fig. 4 [4].
3. Results
This chapter presents the results of the numerical analyses (case 3 and case 4) and the real frequency search test [3, 4]. The results of the real frequency search test are depicted for both tests: 1 and 2 (see paragraph 2.2).
Fig. 5The vibration image for the resonant frequency 7.77 Hz – numerical analyses case 3
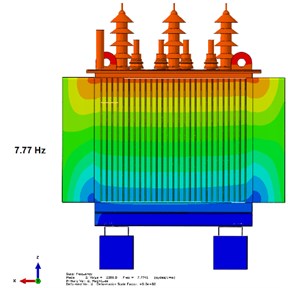
Fig. 6The vibration image for the resonant frequency 8 Hz, the magnitude (left) and phase (right) – test 1
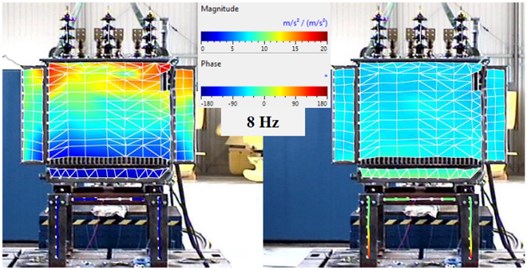
Fig. 7The vibration image for the resonant frequency 11.79 Hz – numerical analyses case 3
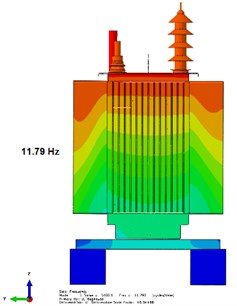
Fig. 8The vibration image for the resonant frequency 13 Hz, the magnitude (left) and phase (right) – test 1
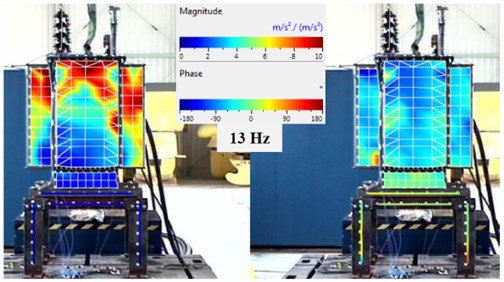
Fig. 9The vibration image for the resonant frequency 25.16 Hz – numerical analyses case 3
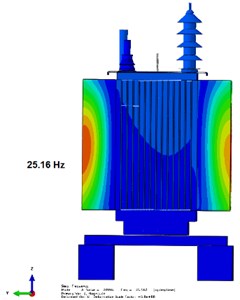
Fig. 10The vibration image for the resonant frequency 27.5 Hz, the magnitude (left) and phase (right) – test 1
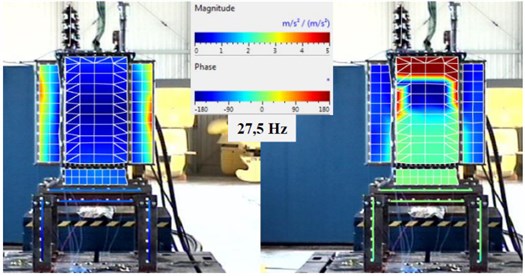
Table 1The results of the numerical analyses versus the real frequency search test – test 1 and test 2
No. | Frequency Hz – numerical analyses | Frequency Hz – laser vibrometer (test 1) | Frequency Hz – accelerometers (test 2) | Direction | Mode number |
1 | 7.77 – case 3 | 8.00 | 7.74 – 7.83 | y | Mode 1 |
2 | 11.79 – case 3 | 13.00 | 12.75 – 13.08 | x | Mode 2 |
3 | 25.16 – case 3 | 27.50 | 27.46 – 27.53 | x | Mode 3 |
4 | 9.87 – case 4 | 8.00 | 7.74 – 7.83 | y | Mode 1 |
5 | 13.91 – case 4 | 13.00 | 12.75 – 13.08 | x | Mode 2 |
Based on the table above, it can be said that the accuracy between the numerical analyses and the real frequency search test 1 is high. In particular, in the case 3 (mode 1) and in the case 4 (mode 2), the approximation error is minor and equals 2.8 % and 7 %, respectively. For the remaining examples, the approximation error is less than 10 % with one exception of the case 4 (mode 1). In this example, the approximation error is higher than 20 %. The modes shapes are also very similar.
Based on the table above, it can be said that the accuracy between the numerical analyses and the real frequency search test 2 is similar and even higher. The frequencies for the test 2 were taken from single points (please see Fig. 4) and it gives the frequency range rather than the precise value, which is different from the test 1. The frequency range 27.46 Hz-27.53 Hz comes from two accelerometers (7 and 8) [4]. It means that the ribs of the radiators are moving so the mode shape is also similar to the mode registered using the vibrometer (please see Fig. 10).
In general, it can be said that the numerical analysis is a useful tool for predicting the resonant frequencies of the structure.
For the purpose of the article, only the most important facts were presented. In fact, the remaining modes (such as mode 4, mode 5, etc.) also show a high accuracy between the numerical analyses and the real frequency search test.
4. Conclusions
Based on the results presented in the paragraphs 3, it can be concluded that the numerical analyses have a high accuracy with the real frequency search tests and, therefore, they are a good example of the cost saving in the designing process. The next step of this approach would be the comparison of the numerical analysis (results of the sine beat analysis/the time history analysis) with the real seismic tests.
References
-
Fronk R., Fujisaki E., King A. IEEE Recommended Practice for Seismic Design of Substations. New York, 2006.
-
ABAQUS, Analysis User’s Manual. Version 6.14, Dassault Systèmes, Fremont, California.
-
Kozupa M., Sawicki B. TN_9ADB009772_Modal Analysis of 1 MVA Transformer using Laser Doppler Vibrometer in the Seismic Frequency Range. Internal Document of the ABB Company, Kraków, 2016.
-
Michniewicz H., Szkudlarek W. Test Report No. RS-2016/B-186, Dynamic Test of the Distribution Transformer 1000 kVA. Internal Document of the ABB Company and Ship Design Center Company, Draft Version, Gdańsk, 2016, p. 14-35.
