Abstract
The car seats are exposed to short-term and long-term exertion. Long-life test run after tens of hours loading a car with a driver. Such tests are time-consuming and very costly. Load is spread into dynamic and static zones that are constantly changing. The car must therefore be continually operated under the constant supervision of the operator. This article describes the possibility of transferring such tests in the lab and describes the different methods of lifetime tests of the car seats and their impact on final test results.
1. Introduction
Life testing car seats is realized according to specified parameters. The seat is placed in the car, preferably as the driver's seat. Before and after the test is performed defined measurement car seat.
2. Testing equipment
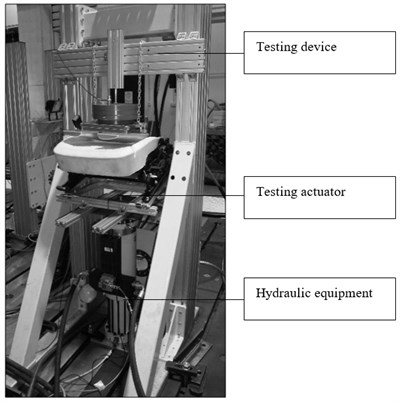
The test device is located in a hydrodynamic laboratory at the Technical University in Liberec. The device consists of an aluminum frame, single hydrodynamic actuator, control and measuring computers (Fig. 1-3). The test signals are read into the control computer and then transferred to the control unit hydrodynamic actuator. Signal is obtained from tests on a real car.
Fig. 1Testing equipment
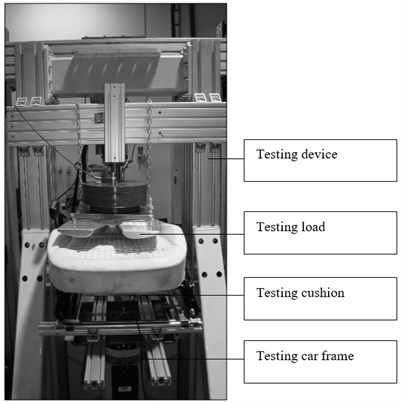
Fig. 2Testing equipment
3. Testing signal
The testing signal used for the life tests seat is a signal obtained from a real drive after the test track in real car. After filtering out spurious high frequencies above 35 Hz we have got about 20 minutes long original dynamic signal (Fig. 4). The signal was repeated several times and therefore we got the entire 180 hours longest signal.
Fig. 3Control and measurement PC
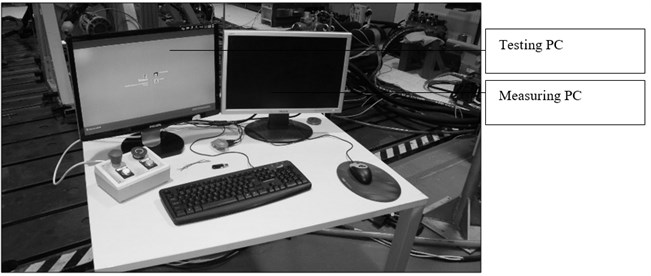
Fig. 4Original dynamic signal

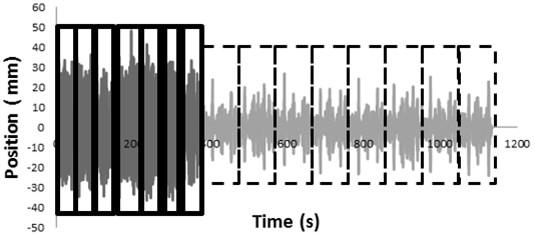
Also complicated and time consuming signal was in a first step, divided into a strong dynamic part and weakly dynamic part almost “static”. Thus splitting the signal was overmixed on only part of a strong dynamic part and “static”. By this combination was created new mixed signal (Fig. 5). This new mixed signals for 20 minutes was again repeated several times and was longest signal by required 180 hours.
On base by mixing of the original signal was created next signal combinations. It was a complete separation of dynamic and “static” part (Fig. 6). Created two signals – dynamic – about 6 minutes long static – about 14 minutes long. Both were repeated several times and therefore we get two signals long – 77 hours and 103 hours.
Fig. 5Combined dynamic +static signal
4. Evaluation of the testing signal
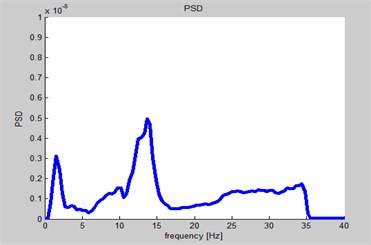
For correctness of mixing by the original signal was done analysis based on an assessment power density of energy of all three signals. As is evident from these Figs. 7-9, all three signals are equal and can be mutually replaced.
Fig. 6Divided dynamic and static signal
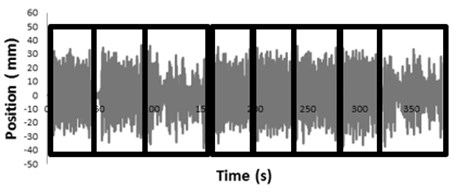
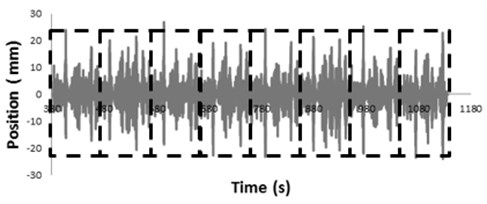
Fig. 7Original Dynamic Signal – PSD
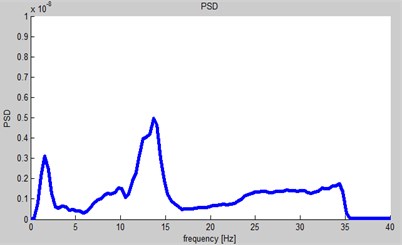
Fig. 8Combined Dynamic +Static Signal – PSD
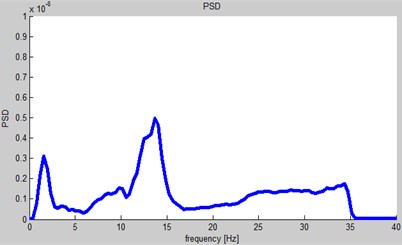
Fig. 9Divided Dynamic and Static Signal – PSD
Accordance with the requested parameters needed to measure relative subsidence seats before and after the test. These values were measured for all three signals the measured values were given in Table 1. These values are comparable.
Table 1Measured relative deformation
Signal | Deformation |
ODS | 5.6 mm |
CDSS | 5.5 mm |
DDSS | 5.5 mm |
As the previous Figs. 7-9 and Table 1 it is clear that we really did not make any mistakes and actually measured signal can be replaced or rearranged laboratory signal which will have the same PSD.
5. Conclusions
We conclude that the implementation of testing car seats can be transferred to the laboratory. By mixing static and dynamic segments can achieve the same results. From the point of view during the test is preferable at the beginning of the test implement dynamic load and at the end of the static. This significantly shortens the active test. In static load test equipment can be turned off and do not require attendance. Shortens the test time and cost of the test. Finally, it should also be noted to “amplify” the test signal, i.e. to increase the energy density (which is not possible in actual testing in a car).
References
-
Stoica P., Moses R. L. Introduction to Spectral Analysis. Prentice Hall, Upper Saddle River, 1997.
-
Turkay S., Akcay H. A study of random vibration characteristics of the quarter-car model. Journal of Sound and Vibration, Vol. 282, Issue 1, 2005, p. 111-124.
-
Schneider L. W., et al. ASPECT: the next-generation H-point machine and related vehicle and seat design and measurement tools. SAE Technical Paper, 1999.
About this article
This publication was written at the Technical University of Liberec as part of the Project “Innovation of products and equipment in engineering practice” with the support of the Specific University Research Grant, as provided by the Ministry of Education, Youth and Sports of the Czech Republic in the year 2016.
