Abstract
Based on the secondary development of LS-DYNA program, the nonlinear dynamic p-y model and Bonora damage material model of steel were applied in the main program. Taking a four-span approach bridge as an example, the plastic damage model of the upper bridge and four simplified bridge pile-foundation models, including beam on Winkler foundation model, effective length pile model, total pile model considering soil-structure interaction (SSI) and no pile model, were introduced. The earthquake motions obtained by a free-field analysis were applied to the different depth of pile profile. The free vibration characteristics, displacement, internal force and damage under different levels of earthquake motions were analyzed. The stress-strain curve of different depth of p-y elements and pile deflection of Winkler-methods model were discussed. Analysis results indicated that the structure responses are different among the four pile-foundation models, the responses of the bridge in longitudinal and transverse directions are totally different, and the p-y model can be used to simulate the bridge precisely.
1. Introduction
Bridge structures always fall under earthquake motions because of the base foundation failure, and the SSI can be an important consideration in evaluating the seismic response of the bridge. Seismic property analysis methods of soil- pile- structure interaction have been developed more than 40 years, including that the dynamic beam on a nonlinear Winkler foundation, i.e. dynamic p-y model, is the most widely used method because of its precision and simplification. Pioneering studies were made on the dynamic p-y model including Matlock [1] et al., Kagawa and Kraft [2], Novak and Sheta [3], and Nogami et al. [4]. Based on their works, Wang et al. [5]compared several implementations of the dynamic p-y model and showed that calculations can be sensitive to the details of nonlinear springs and dashpots but that different codes did produce similar results when similar modeling details were used. The validity and reliability of the p-y model analysis methods is verified by Boulanger et al. [6] according to the centrifuge model tests. Zou et al. [7] investigated the influence of Pile-Soil-Structure Interaction (PSSI) on pounding responses of adjacent buildings under earthquake excitations, their results show that the PSSI has an obvious influence on the seismic responses of the adjacent structures with pile foundation. Wang and Liu [8] developed a p-y curve model based on a cyclic degradation model through the accumulated plastic soil displacement, they embedded this model into the Open Sees program to investigate the cyclic lateral responses of soil elements and pile. Luo et al. [9] conducted a nonlinear 3D finite element numerical simulation to investigate the seismic soil-pile-structure interaction. Xie et al. [10] developed and validated a p-y model, the key parameters of this model are the ultimate resistant force and displacement at the half of the ultimate force, and this model was used to predict seismic responses of highway bridges with considerations of soil-structure interaction effects. Falamarz-Sheikhabadi and Zerva [11] examined the effects of soil-foundation-structure interaction on the seismic response of a tall partially embedded flared bridge pier, they examined the variations of the maximum moment and shear distribution along the pier and pile foundation. Kavitha et al. [12] presented a comprehensive state-of-the-art review of researches on the soil-structure interaction analysis of laterally loaded piles, their literature review summarized that properties of soil and pile, type of loading, analysis methods, etc. play important roles in predicting the behavior of a soil-structure system.
Moreover, a bridge with unequal piers heights is significantly different from an equal piers heights bridge. In this paper, the nonlinear dynamic p-y model and the Bonora [13]damage material model of steel is applied in the main program of LS-DYNA [14], four bridge pile foundation models, including beam on Winkler foundation model, effective length pile model, full length pile model considering the SSI effect, and rigid foundation model are built and analyzed. Then the free vibration characteristics, displacement, base shear force and damage under three levels of earthquake motions are discussed.
2. Dynamic p-y model
Based on the dynamic p-y model proposed by Boulanger et al. [6] as shown in Fig. 1, the secondary development of LS-DYNA program is conducted in this paper. The dynamic p-y model is composed of elastic element (p-ye), plastic element (p-yp), gap element (p-yg) and damping element, where the gap element consists of a parallel connected drag element and closure element, and the damping element is parallel connected to the elastic element, the displacement-force relation of this p-y model is:
The force-displacement relation of the elastic element is:
where Ke is the primary stiffness, and can be calculated by the static p-y curve.
Fig. 1p-y model
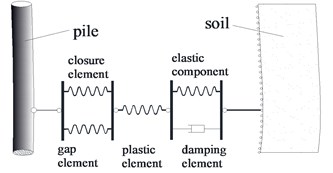
The plastic element is within the range of -crpult<p<crpult, where c(r)=p/pult, beyond this range, the plastic element begins to yield, then the force is expressed as:
where pult is the ultimate stress in the current loading direction of the p-y model, y50 is the displacement of the pier when it reaches the 50 % ultimate stress, p0 is the values of p at the start of the current plastic loading cycle, and yp0 is the displacement at the start of the current plastic loading cycle, c and n are model constants that control the shape of the plastic component. The closure component of the model is:
where y+0 and y-0 represent the memory term for the positive side of the gap and memory term for the negative gap side. The initial values of y+0 and y-0 were set as y50/100 and –/100. The factor of 1.8 brings up to during virgin loading to or . The nonlinear drag spring is described by:
where is the ratio of the maximum drag force to the ultimate resistance of the - element, and represents the start of the current loading cycle. The parameters in this model are determined as:
where is the pile diameter, is the lateral bearing capacity factor, is the average buoyant unit weight, is the depth, is the undrained shear strength, is the vertical effective stress, OCR (over consolidation ratio), is strain of the 50 % of the ultimate stress, Matlock suggest that 0.5 for soft soil.
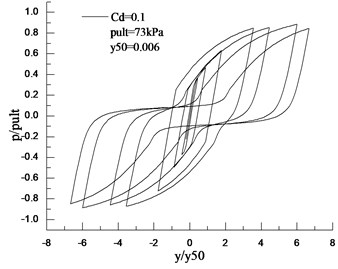
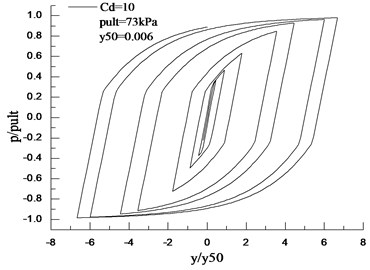
Based on the - model proposed by Boulanger, the difference method is secondarily developed in the LS-DYNA program. Choosing 73 kPa, 0.006, and 0.1 and 10, Fig. 2 shows the pier-soil relation, this simulation results are definitely the same with the results proposed by Boulanger et al.
Fig. 2Pile-soil interaction hysteretic curves for Cd= 0.1 and 10
3. Numerical example
3.1. Model description
A four-span bridge of 3×65 m + 40 m with the slope of 2 % is analyzed in this paper, as shown in Fig. 3. The height and width of the main bridge girder are 13.69 m and 32.67 m. The bridge piers from left to right are denoted as 1 to 5 with the height of 23 m, 21.5 m, 20 m, 10 m and 9.2 m. The additional vertical force due to the girder from the left span of pier 1 is about 12190.65 kN, and the additional moment is 1.72×10⁹N.m. Similarly, the additional force and moment of pier 5 are 1447.21 and 1.94×10⁷ N.m. The length of all the piles is assumed to be 34 m with the diameter of 1.8 m. The soils of the foundation from top are mud, mucky soil, silty clay, silty clay, grit, silty clay and bedrock. The detailed parameters of the soil are shown in Table 1. The main girder, piers and piles are simulated by a fiber beam element model, and by adopting the damage material model of Bonora, the global finite element model of this bridge is built in the LS-DYNA program.
The base of the bridge is simulated by the beam Winkler foundation (denoted as Winkler hereinafter), effective length pile model (Effective) and full length pile model (Full) considering SSI, and rigid foundation model (Rigid) non-considering the SSI. The SSI effect is considered by the developed - model. Based on the soil properties, the characters of the - model corresponding to the soil layer are determined, and one node of the model is hinge connected to the bridge piles, and the other end is affected by earthquake motions calculated in the free field solution. The length of the piles of the Effective model is 15 m based on the Technical specification for building pile foundations (JGJ94-2008), the earthquake motions are only applied at the end of the effective piles and obtained in the free field solution. The Full model is the same to the Winkler model except there are no - models between the soil and piles, and the earthquake motions calculated by the free field solution are directly applied to the nodes of the piles in the corresponding depth.
Table 1Characteristic parameters of soil
Soil layer | Density (kN/m3) | Shear velocity (m/s) | Layer depth (m) | (kPa) | Damping coefficient |
Mud | 16.5 | 100 | 4 | 4 | 0.9 |
Mucky soil | 17 | 135 | 8 | 6 | 0.82 |
Silty clay 1 | 18.1 | 220 | 4 | 16 | 0.77 |
Silty clay 2 | 19.2 | 270 | 4 | 35 | 0.61 |
Grit | 18 | 410 | 8 | - | 0.1 |
Silty clay 3 | 19.2 | 300 | 4 | 27 | 0.6 |
Bedrock | – | >500 | – | – | – |
3.2. Earthquake motions
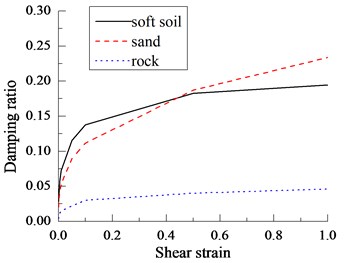
Under large earthquake motion excitations, the soil fall into a strong nonlinear by its properties state, and the free field solution method is approximately used to be an approximation. It is assumed that the site soil is distributed in layers in the depth, each soil layer is isotropic, and the earthquake motions incident normally from the bedrock, the equivalent linearization method is used to conduct the free field solution. Three earthquake motions of type I site, i.e. Qianan earthquake motion, Cpm-cape Mendocino earthquake motion and Oroville earthquake motion, are chosen to do the free field solution. The predominant frequencies of these three earthquake motions are 7.51 Hz, 3.05 Hz and 5.54 Hz. The fortification intensity of the site is 8 degrees, and the corresponding peak ground acceleration 70 cm/s2, 210 cm/s2 and 400 cm/s2. The curve and curve of soft soil, sand and rock are shown in Fig. 4 and Fig. 5. The calculated accelerogram is then applied at the end of the - model in proper depth of the piles.
Fig. 4γ-G/G0 curve of site
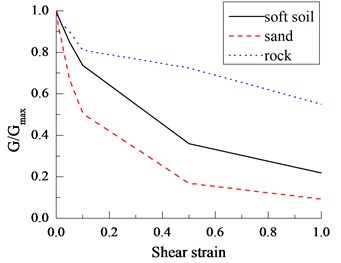
Fig. 5γ-ζ curve of site
3.3. Free vibration characteristics
The free vibration characteristics of the bridge using the aforementioned four base simulations are summarized in Table 2. Table 2 shows that the Effective model, Winkler model and Full model have longer periods comparing to the Rigid model. Because the Winkler model take the SSI into consideration, which reduces the base stiffness, and this model has the longest period. The period of the Full model is in between, and the Rigid model has the shortest period.
Table 2Fundamental period
Model | Longitudinal direction (s) | Transverse direction (s) |
Effective length pile model | 1.241 | 0.704 |
Beam Winkler foundation | 1.538 | 0.869 |
Full length pile model | 1.266 | 0.716 |
Rigid foundation model | 0.79 | 0.447 |
3.4. Pier displacement
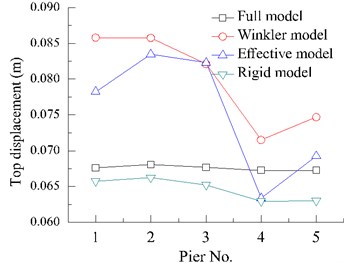
Under the frequent and moderate earthquake motions, the pier displacements have similar deformation properties, therefore, only the deformation of the piers under frequent and major earthquakes are analyzed. Figs. 6 to 8 show the relative displacement of piers under Qianan, Cpm and Oroville earthquake motions in the longitudinal direction. Figs. 6 to 8 indicate that the top displacement of the piers in the transverse direction is proportional to the pier height because of the constraints of the deck beams at the top of the piers, the SSI effect increase the displacement of the piers significantly, and the increase of taller piers is larger than that of the shorter ones.
Fig. 6Pier top deflection of bridge in parallel direction under Qianan earthquake motions
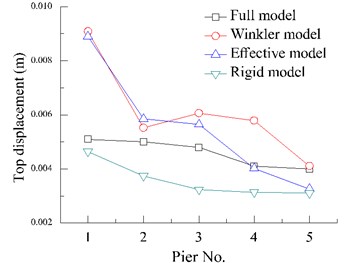
a) 70 m/s2
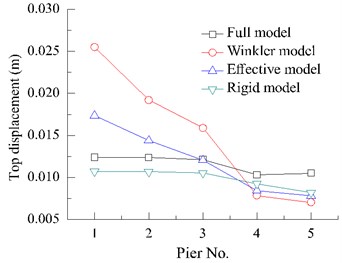
b) 400 m/s2
Fig. 7Pier top deflection of bridge in parallel direction under Cpm earthquake motions
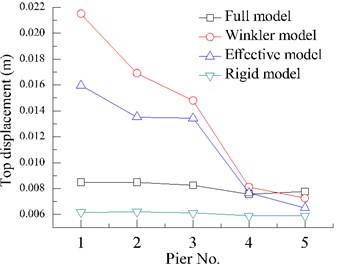
a) 70 m/s2
b) 400 m/s2
The Effective model and Winkler model have similar responses both in the transverse and longitudinal directions because of the similar base stiffness. The Full model and Winkler model have the same earthquake motion input except the consideration of SSI effect of the Winkler model, however, because of the constraints of the surrounding soil, the base stiffness of the Full model is much larger than the Winkler model and approximately equal to the Rigid model, therefore, the displacement of the piers of the Winkler model is larger than the Full model and Rigid model. For different earthquake motions input, the predominant frequency of the Cpm earthquake motion is close to the fundamental frequency of the bridge, then it triggers the largest displacement responses, and, on the contrary, the displacement of the piers under the Qianan earthquake motion is the smallest.
Fig. 8Pier top deflection of bridge in parallel direction under Oroville earthquake motions
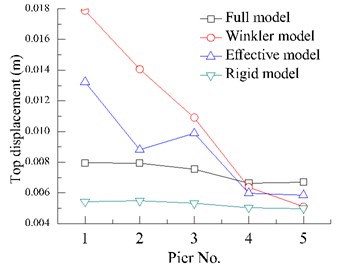
a) 70 m/s2
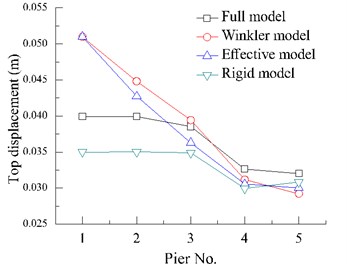
b) 400 m/s2
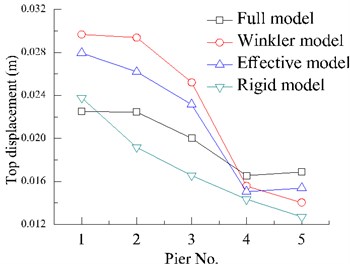
Fig. 9Pier top deflection of bridge in vertical direction under Qianan earthquake motions
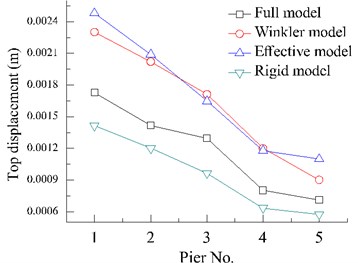
a) 70 m/s2
b) 400 m/s2
Figs. 9 to 11 show the displacement of the piers in the transverse direction, comparing with the responses of the longitudinal bridge direction, the influences of the pier height on the top displacement of the piers are more significant, especially the Rigid model and the Full model. Under frequent earthquake motions with the peak ground acceleration equal to 70 cm/s2, the displacements of all four models in the transverse direction are smaller than those in the longitudinal direction, and the top piers undergo larger displacement, however, under major earthquake motions, the displacements in the transverse direction are larger than those in the longitudinal direction.
Figs. 9 to 11 also show that the piers in the transverse direction deform independently from each other because of the weak transverse constraints of the deck beams, and the maximum displacements of the piers in the transverse direction under major earthquake motions are 8 to 12 times larger than those under frequent earthquake motions, however, they are about 3 to 5 times in the longitudinal direction. For the four base simulation methods, the responses of the Winkler model are similar to the Effective model and larger than the Full model and Rigid model, which means the SSI effect will enlarge the displacement response, and the Full model and Rigid model will under estimate the seismic responses of the bridge. For three different earthquake motions, similar conclusions to the longitudinal direction are obtained, i.e. the displacement under Cpm is the largest, and under Qianan earthquake motion is the smallest.
Fig. 10Pier top deflection of bridge in vertical direction under Cpm earthquake motions
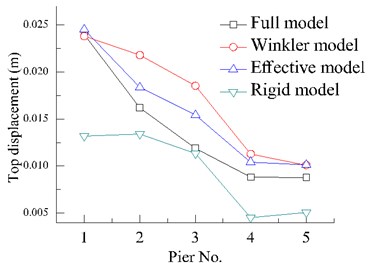
a) 70 m/s2
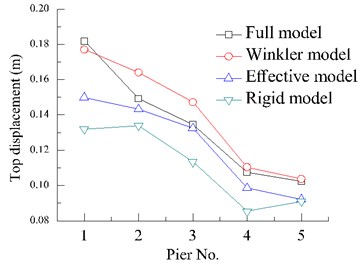
b) 400 m/s2
Fig. 11Pier top deflection of bridge in vertical direction under Oroville earthquake motions
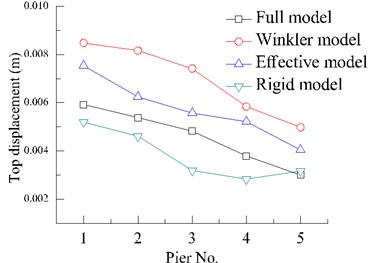
a) 70 m/s2
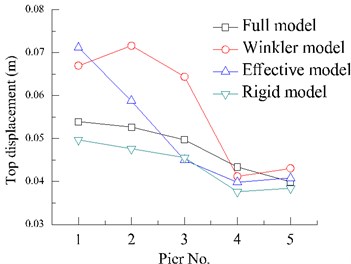
b) 400 m/s2
3.5. Base shear
Table 3 and Table 4 show the maximum base shear of the piers under frequent and major earthquake motions. From Tables 3 to 4, it is indicated that the Rigid model has the largest base shear, the Full model is the next, and the Winkler model the smallest. Because of the larger bridge stiffness in the transverse direction, the base shear in the transverse direction is larger than that in the longitudinal direction for all four models.
Table 3Maximum shear force of the piers under 70 m/s2 earthquake motions (unit: MN)
Model | Longitudinal direction | Transverse direction | ||||
Qianan | Cpm | Oroville | Qianan | Cpm | Oroville | |
Effective model | 8.19 | 25.9 | 19.8 | 17.1 | 15.7 | 15.8 |
Winkler model | 4.67 | 7.69 | 6.3 | 3.92 | 7.35 | 5.71 |
Full model | 3.9 | 8.93 | 5.61 | 4.13 | 12.1 | 13.1 |
Rigid model | 17.4 | 34.1 | 35.6 | 24.6 | 22.3 | 27.1 |
For different earthquake motion excitations, the shear forces of the Winkler model and Effective model under Cpm excitation are the largest, the Rigid model under Oroville excitation is the largest. Under major earthquake motions, the differences of the base shear between the Winkler model and Effective model increase, because under frequent earthquake motion, the Effective model can approximately consider the SSI effect, and it is not well considered when the piers experience large deformation. With the increase of the earthquake motion intensities, a major part of the seismic energy is dissipated by the plastic deformation of the - models in the Winkler model, therefore, the acceleration at the top of the piers and the base shear of the piers are deduced.
Table 4Maximum shear force of the piers under 400 m/s2 earthquake motions (unit: MN)
Model | Longitudinal direction | Transverse direction | ||||
Qianan | Cpm | Oroville | Qianan | Cpm | Oroville | |
Effective model | 42.2 | 54.1 | 59.7 | 54.5 | 61 | 75.1 |
Winkler model | 16.3 | 25.1 | 17.4 | 18.3 | 19.9 | 19 |
Full model | 17.2 | 36 | 19.8 | 33.8 | 33.5 | 37.2 |
Rigid model | 58.1 | 79.4 | 73.2 | 83.9 | 91 | 109 |
3.6. Damage analysis
The damage index is within the range of 0 for no damage to 1 for total failure. In this paper, the damage material model proposed by Bonorais secondarily developed into the LS-DYNA program, the damage evolution law of the Bonora model is expressed in Eq. (11) as:
where and are the critical and threshold equivalent accumulated plastic strain, is the damage increase, is the damage, and are critical and initial damage of the material corresponding to and , respectively, is the increase of equivalent plastic strain, and is the cumulative equivalent plastic strain, is the damage model parameter, is plastic multiplier, is the function for considering the triaxial stress effect.
Fig. 12Piers damage process under 400 cm/s2
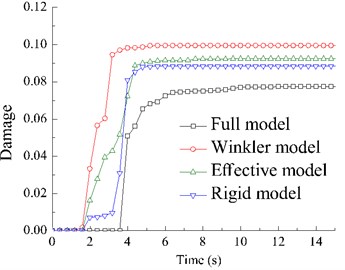
a) Qianan
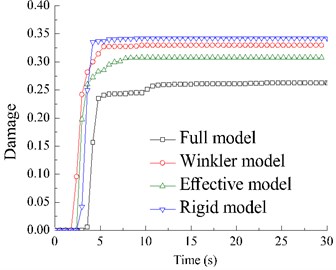
b) Cmp
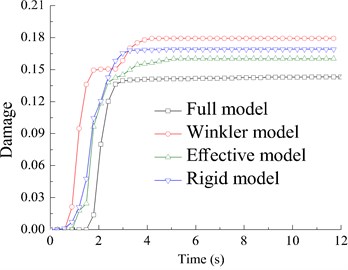
c) Oroville earthquake motions
Adopting the fiber beam element model, the pier damage index is defined as the average value of all the fibers. The damage process of the piers under major earthquake motions are shown in Fig. 12. Choosing the damage process of pier 4 and pier 5 as examples, it is shown that the Rigid model has the smallest damage, and the damage of the Winkler model, Full model, and Effective model is similar and larger than that of the Rigid model, so the SSI effect will enlarge the bridge damage.
3.7. - relation of Winkler beam foundation model
Figs. 13 and 14 show the - relation of the Winkler model under 70 cm/s2 and 400 cm/s2 Oroville earthquake motions at the depth of 1 m and 10 m. Fig. 13 shows that under frequent earthquake motions, the soil is almost elastic irrespective of the depth of the pile node positions. With an increase of earthquake intensities, while under major earthquake motions, a strong nonlinearity happens at the 1 m depth position of the pile, the soil undergoes plastic yield, forms unrecoverable deformation, produces an obvious gap and slides between the pile and soil. The nonlinearity decreases with the depth of the pile position, as shown in Fig. 14, the nonlinearity of the soil pile interaction at 10 m under the ground is weak.
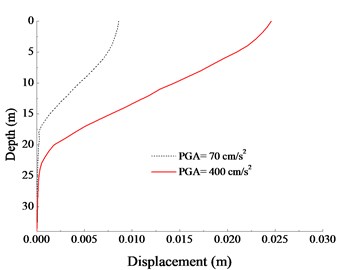
Fig. 15 shows the maximum pile deformation under 70 cm/s2 and 400 cm/s2 Qianan earthquake motions, it is indicated that the maximum displacement happens at the top of the pile. Under the frequent earthquake motion, with the increase of the depth from 0 to 17 m, the deformation decreases fast to 0, the depth of 17 m is similar to that of the effective pile length. The zero-pile deformation position under major earthquake motion is about 24 m under the ground, which means that the effective length pile model is more suitable to the seismic analysis of the bridge under frequent earthquake motions.
Fig. 13p-y hysteresis curves under 70 cm/s2 Oroville wave
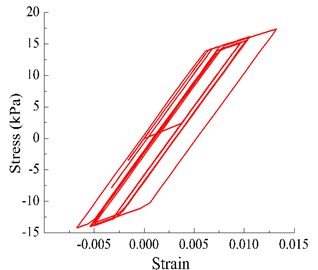
a) 1 m
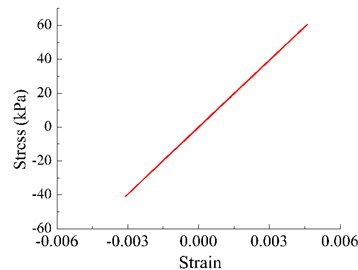
b) 10 m
Fig. 14p-y hysteresis curves under 400 cm/s2 Oroville wave
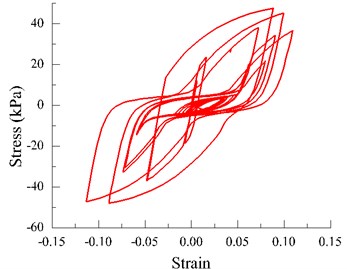
a) 1 m
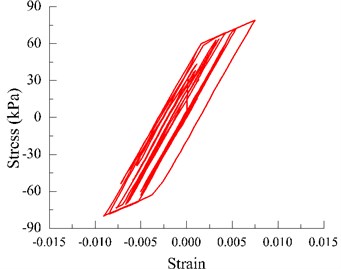
b) 10 m
Fig. 15Displacement of pile under 70 cm/s2 and 400 cm/s2 Qianan wave
4. Conclusions
Comparing studies of seismic bridge performance with the base foundation simulated by the Winkler beam foundation model, effective length pile model and full pile model considering the soil-structure interaction and no-pile model were introduced. The free vibration characteristics, displacement, acceleration, internal force and damage under different levels of earthquake motions were analyzed. The findings obtained in this study are summarized as follows.
1) The SSI effects will reduce the base and bridge stiffness, increase the displacement and acceleration at the top of the piers, and enlarge the maximum moment and damage at the pier base.
2) For the Winkler beam foundation model, the zero-deformation position of the piles under the ground level excited by different earthquake motions is various, specifically, the stronger the earthquake motions are, the deeper the zero-deformation position is, therefore, the effective length pile model may be not suitable for the seismic analysis of the structures considering the soil-pile interaction under a strong earthquake.
3) Because of the strong deck beam constrained in the longitudinal direction, the seismic responses of an unequal height pier bridge in the transverse direction and longitudinal direction are different.
References
-
Matlock H., Foo S. H., Bryant L. L. Simulation of lateral pile behavior. Proceedings of the Earthquake Engineering and Soil Dynamics, ASCE, New York, United States, 1978.
-
Kagawa T., Kraft L. M. Soil- pile- structure interaction of offshore structures during an earthquake. Proceedings of 12th Annual Offshore Technology Conference, Vol. 3, 1980, p. 235-245.
-
Novak M., Sheta M. Approximate approach to contact problems of piles. Proceedings of Pile Found: American Petroleum Institute, 1980.
-
Nogami T., Otani J., Konagai K., Chen H. L. Nonlinear soil-pile interaction model for dynamic lateral motion. Journal of Geotechnical Engineering, Vol. 118, Issue 1, 1992, p. 89-106.
-
Wang S., Kutter B. L., Chacko J. M., Wilson D. W., Boulanger R. W., Abghari A. Nonlinear seismic soil-pile-structure interaction. Earthquake Spectra, Vol. 14 Issue 2, 1998, p. 377-396.
-
Boulanger R. W., Curras C., Kutter B., Wilson D., Abghari A. Seismic soil-pile-structure interaction experiments and analyses. Journal of Geotechnical and Geoenvironmental Engineering – ASCE, Vol. 125, Issue 9, 1999, p. 750-759.
-
Zou L. H., Huang K., Wang L. Y., Fang L. Q. Pounding of adjacent buildings considering pile-soil-structure interaction. Journal of Vibroengineering, Vol. 15, Issue 2, 2013, p. 905-918.
-
Wang T., Liu W. Development of cyclic p-y curves for laterally loaded pile based on T-bar penetration tests in clay. Canadian Geotechnical Journal, Vol. 53, Issue 10, 2016, p. 1731-1741.
-
Luo C., Yang X., Zhan C. B., et al. Nonlinear 3D finite element analysis of soil-pile-structure interaction system subjected to horizontal earthquake excitation. Soil Dynamics and Earthquake Engineering, Vol. 84, 2016, p. 145-156.
-
Xie Y. Z., Huo Y. L., Zhang J. Development and validation of p-y modeling approach for seismic response predictions of highway bridges. Earthquake Engineering and Structural Dynamics, 2016.
-
Falamarz Sheikhabadi M.-R., Zerva A. Effect of numerical soil-foundation-structure modeling on the seismic response of a tall bridge pier via pushover analysis. Soil Dynamics and Earthquake Engineering, Vol. 90, 2016, p. 52-73.
-
Kavitha P. E., Beena K. S., Narayanan K. P. A review on soil-structure interaction analysis of laterally loaded piles. Innovative Infrastructure Solutions, Vol. 1, Issue 1, 2016, p. 1-14.
-
Bonora N. A nonlinear CDM model for ductile failure. Engineering Fracture Mechanics, Vol. 58, Issue 1-2, 1997, p. 11-28.
-
LS-DYNA. Keyword user’s manual. Livermore, California: Livermore Software Technology Corporation, 2016.
About this article
The authors gratefully acknowledge the partial support of this research by the National Natural Science Foundation of China under grant number 51508373 and 51578361, the National Key Research and Development Plan under grant number 2016YFC0701100, and the Tianjin Basic Research Program under grant number 16JCZDJC38900 and 15JCZDJC39900.

