Abstract
There are two key problems in bearing fault diagnosis that need to be addressed, one is feature selection, the other is faulty dataset problem. On the one hand, signal decomposition methods are popular ways to decompose signal into a number of modes of interest, while the most interesting modes need to be selected to represent original signal. This procedure may easily lead to loss of important information. On the other hand, most of works adopt the faulty data to train fault diagnosis classifier, while the faulty data sets are difficult to collect in real life. Hence many existing methods are unsuitable for practical application. Moreover, a high number of researchers introduce various hybrid methods to improve the ability of original methods, which increases the complexity of fault diagnosis. To solve these problems, firstly, a canonical variate analysis (CVA) detector based on visual inspection is proposed to classify operating states. Healthy dataset obtained under normal condition is applied for building a reference model and generating a threshold. CVA transforms the unknown variable into state space and residual space, then T2 and Q metrics are used to capture the variation in the two spaces, respectively. The metrics of variable compared with reference model will determine the state of rolling bearing. Considering that the threshold of proposed detector is likely to be exceeded, and visual inspection fails to identify bearing fault automatically. Then the means of T2 and Q metrics are presented to enlarge the distance between normal and abnormal conditions to avoid those drawbacks. At last, experiment and comparison are conducted to verify the capability of the proposed work. The results demonstrate that the proposed work is simple and effective in bearing fault diagnosis.
1. Introduction
Rolling bearing is considered as a critical component in rotating machinery system. However, bearing failures may induce machine breakdown and even trigger catastrophic events. In order to enhance the reliability and safety of rolling bearing, fault diagnosis has become a hot topic in the last decades. To sum up, fault diagnosis can be interpreted as pattern recognition problem, which includes three main procedures, i.e. feature extraction, feature selection and feature identification [1]. Numerous fault diagnosis approaches have been presented by a high number of researchers, e.g. empirical mode decomposition (EMD) [2, 3], local mean deposition (LMD) [4], wavelet packet decomposition (WPD) [5] and so on. However, these signal decomposition methods are widely employed for decomposing original signal into a number of modes, and the modes of interest are selected to form feature vectors which are used as input of classifier, such as neural network (NN) [6], support vector machine (SVM) [7, 8] and so on. This procedure generates two challenging tasks, one is feature selection problem and the other is the faulty dataset problem. As analysis conducted in [2], feature selection is a complex work in practice. To overcome this disadvantage, a high number of efforts have been performed. Zhang [9] suggests a correlation coefficients criterion to select the potential modes. Van [3] uses particle swarm optimization (PSO) to determine the optimal components. Cerrada [10] applies genetic algorithm (GA) for selecting the best features for spur gears fault diagnosis. Feng [11] presents a sensitive feature selection method based on instantaneous frequency to diagnose bearing fault. Sun [4] utilizes mutual information based technique to select the sensitive product function. An [12] uses a demodulation analysis method to identify bearing fault based on the first three components. The selection procedure may rely on expert’s knowledge and cause more problems such as information loss. Taking particle swarm optimization as an example, PSO attempts to exploit the optimal elements but attracts extra parameters and calculations. The complexity of bearing fault diagnosis is extended to some extent. In addition, many meaningful works resort to denoising approaches to preprocess the original data since vibration signal is generally contaminated by the external noise. Lv [13] employs nonlocal means (NLM) de-noising method to filter the noises and redundancy in signals. Cui [14] processes the original signal prior to feature extraction with the help of wavelet de-noising technique. Besides, signal reconstruction is also a foremost choice for elimination of noises in bearing fault diagnosis. The aim of these methods is to decompose vibration signal into a number of modes/components, the first several components are then retained for reconstruction while the rest is removed. However, the rejected components may include useful fault information. So, it is of great importance to present an efficient approach to avoid feature selection and speed up fault diagnosis step without information loss [2]. On the other hand, most of the published works concerning bearing fault diagnosis depend on the information derived from the normal and faulty data sets. The possible fault features are labeled to train classifiers mentioned above, while the faulty datasets are not readily available in practical applications [15], making the faulty data based approaches invalid and impractical.
It is worth pointing out that hybrid technique is another hot direction of fault diagnosis in these years. The purpose of which is to make full use of the complementary merits of involved methods to archive a perfect performance. Liu [16] proposes a hybrid method which consists of various techniques such as second generation wavelet de-noising and correlation estimation to improve the performance of LMD. Li [17] gives an integrated fault diagnosis method to enhance identification accuracy of bearing fault. Aside from this, in [18], a singular value decomposition (SVD) based technique is introduced to extract features input to SVM optimized by PSO. The experimental results verify that hybrid technique outperforms the traditional approaches, but the main drawback is that these techniques are computationally intensive. So, it is important to develop a tool that can simplify fault diagnosis procedure based only on the healthy data set.
Canonical variate analysis (CVA) is an outstanding means to monitor the operating conditions of process [19, 20]. It requires data set recorded under normal condition to train a CVA’s model. Then the metrics of a new variable compared with the reference model will recognize the corresponding condition. T2 and Q metrics are special tool respectively defined into the retained space and residual space to estimate respective deviations. This underlines our motivation for proposing a common approach to cope with the disadvantages aforementioned. Therefore, a visual inspection method is proposed to diagnose bearing fault based on healthy data. However, a common defect in the threshold based methods is the false alarm. So, the suggested method cannot identify the fault automatically. Furthermore, this paper proposes a novel detector to meet this demand.
This paper is organized as follows: Section 2 briefly reviews the theoretical background of the proposed work. Section 3 demonstrates the effectiveness of the proposed approach in practical application, and comparison of the proposed approach with the published works is done. Eventually, the conclusion is drawn in section 4.
2. Methodology
2.1. Canonical variate analysis
CVA is an effective dimensionality reduction tool, which has been widely employed for nonlinear dynamic process monitoring. The aim of CVA is to provide a linear combination which maximizes the correlation statistic between pairs of variables [21]. For a vibration signal xt, considering the serial correlations xt can be expressed at each sample point t by setting past and future lags. So, the following vectors are given [21, 22]:
where p is the length of past observation, f is the length of future observation.
Then those variables are scaled to zero mean:
where ˉxp,t and ˉxf,t are the sample means of xp,t and xf,t, respectively. All the normalized variables are collected and arranged into past and future observation matrices Xp and Xf:
where m+p+f-1=N, N and m are the number of observations and lagged vectors, respectively.
Therefore, covariance and cross-covariance matrices of Xp and Xf are respectively defined as:
where H is the scaled Hankel matrix. The canonical variates can be obtained through solving the singular value decomposition (SVD) [22]:
where ∑ is a diagonal matrix, U and V are orthogonal matrices. The elements in ∑ are arranged in descending order (λ1>λ2⋯>λr>⋯>λm), the dimensionality reduction matrix Vr is obtained by retaining only the first r columns of V associated to the most attractive singular values in ∑. Then the projection matrices J and L can be calculated as:
The projection matrices transform the data matrix Xp (the past matrix) into new matrices Z and E of uncorrelated variables termed canonical variates and residuals, respectively:
So the most commonly used criterions Hotelling T2 and Q respectively defined into the canonical variates and residuals, are employed to display the information about the states of variables, and are given by:
where zi,t and ei,t are the elements of column vectors of matrices Z and E, respectively.
2.2. Kernel density estimation based control limit
As aforementioned, T2 and Q metrics are used as indicators to estimate the deviations between normal and abnormal operating states. That is to say, the amplitudes of the two metrics compared with the upper control limit (UCL) will judge whether or not the operating conditions are healthy. So, the UCL has a crucial influence on the detection result. However, Traditional threshold based on the Gaussian assumption is not consistent with the practical case, which is easy to cause the false result. Hence the Kernel density estimation based approach is developed to overcome this problem [22].
For a given variable, x, Eq. (18) gives the probability under the condition of (x<s):
where s is a certain value, p(x) is the probability density function estimated by kernel function K() and can be expressed as follow:
where M is the number of samples of x, h is the selected bandwidth and the optimal bandwidth hopt=1.06σN-1/5 [22], σ is the standard deviation of variable.
Then, replacing xk with T2k and Qk achieved in Eq. (16) and (17), respectively, for the purpose of estimating the corresponding probability density functions of metrics. So, the control limits on T2 and Q metrics, with a confidence level α of 99 % are obtained through solving:
Generally speaking, the vibration signals recorded by acceleration sensor under various operating states are easy to be contaminated by noises and redundancy, which led the threshold based methods to produce a number of false alarms. Here, we use the CVA based threshold method as a binary classifier to diagnose bearing faults, the same problem needs to be compensated in the testing phase. Instead of considering the case that amplitudes of metrics violate the chosen threshold as faulty condition, in this paper, the mean of metric is proposed to avoid the false classification. That is, the mean of metric compared with the threshold trained by the healthy dataset will determine the operating condition. Viz. if the mean is larger than the obtained threshold, the faulty condition is separated, while the mean below the threshold indicates healthy condition. The mean can be illustrated as follow:
where, x=T2t for the retained space, x=Qt for the error space.
3. Case study
To illustrate the efficiency of the proposed method, the experiment based on the sampled vibration signal is conducted. The experimental data used in this work is selected from CWRU [23], Fig. 1 shows the CWRU bearing test rig [23, 24]. In this study, the data sets about bearing faults corresponding to various severity levels are shown in Table 1.
Fig. 1CWRU bearing test rig
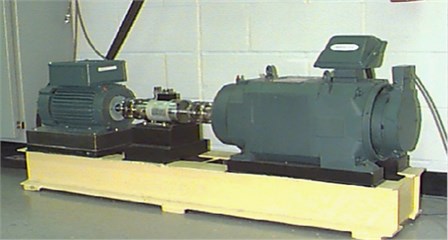
Table 1Data sets used in this work
States | Training sets | Ball fault | Inner race fault | Outer race fault |
Normal state | 97.mat, 98.mat | 99.mat | 99.mat | 99.mat |
0.007’’ | 97.mat, 98.mat | 120.mat | 107.mat | 132.mat |
0.014’’ | 97.mat, 98.mat | 187.mat | 171.mat | 199.mat |
0.021’’ | 97.mat, 98.mat | 224.mat | 211.mat | 236.mat |
As mentioned above, CVA requires the dataset acquired under fault-free condition to train a reference model so that the model can distinguish the faulty condition. Therefore, 97.mat and 98.mat are employed to train the CVA’s model. Simultaneously, the thresholds are determined through estimating the probability density functions (PDF) of T2 and Q statistics using Eq. (19). It should be noted that CVA transforms original space into state space and residual space, T2 and Q metrics defined into these spaces are designed to measure the total variation in the state space (retained space) and the sum of squared error in the residual space, respectively. Fig. 3 gives the corresponding metrics. Moreover, the two metrics are complementary [25, 26], that is, the impact of the number of retained variates on the reference model can be ignored due to the variances changed in the T2 metric will be compensated in the Q metric. The vibration signals sampled under the healthy condition and ball fault are depicted in Fig. 2.
Fig. 2Original signal

a) Normal condition

b) Ball fault
Fig. 3The corresponding metrics
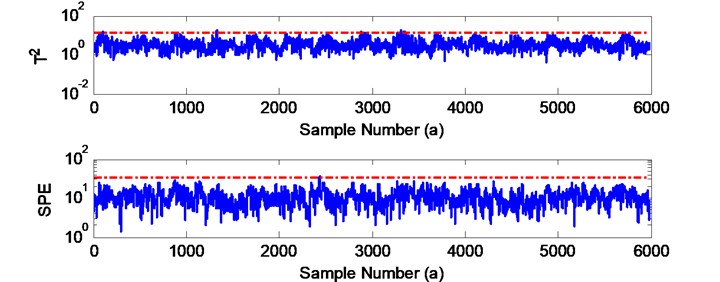
a) Normal condition
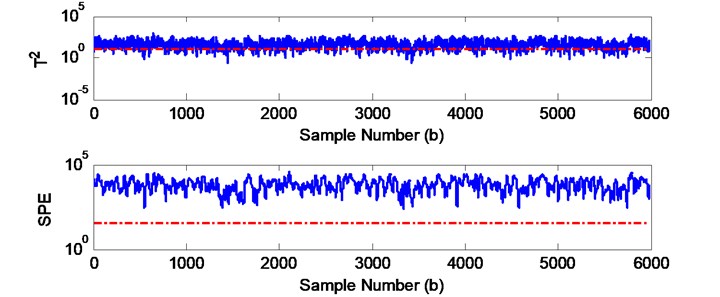
b) Ball fault
In this work, the considered past observation p=15, the future observation f=15, and the number of canonical variates retained r=4. As can be seen in Fig. 3(a), the healthy data set described in Fig. 2(a) is converted into two spaces, and the whole state information captured by T2 and Q metrics is below the trained threshold. While the metrics generated by ball fault violate the thresholds in Fig. 3(b), which can be interpreted as faulty condition. On the other hand, it can be visibly observed in Fig. 3(b) that the T2 metric can also be considered as false discriminant caused by noises, that is to say, the T2 corresponding to the data set may be normal. Thanks to the Q metric which exceeds the threshold completely, and the original diagnosis result can be insisted. That is also consistent with the conclusion that T2 and Q metrics are complementary.
However, the CVA based approach can recognize bearing fault efficiently by visual inspection, it is not appropriate for fault diagnosis in an automatic manner principally since some data points reach the thresholds. So, the mean based method is proposed to overcome the issue mentioned above. The objective of the proposed method is to increase the distance between thresholds and operating conditions so as to classify the bearing fault automatically and enhance the recognition accuracy.
For each fault, the testing sets listed in Table 1 are used to produce 160 samples in total, 40 samples under each condition. Then the samples are taken as the input of CVA based detector to demonstrate the proposed approach. The detection results are described in Fig. 4 and Fig. 5, respectively.
Fig. 4Identification result using proposed method (T2)
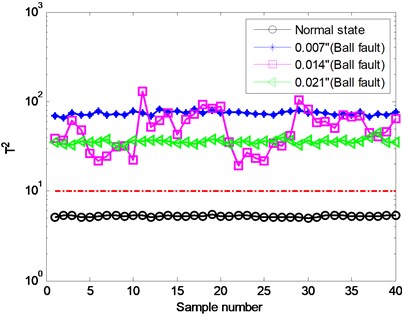
Fig. 5Identification result using proposed method (Q)
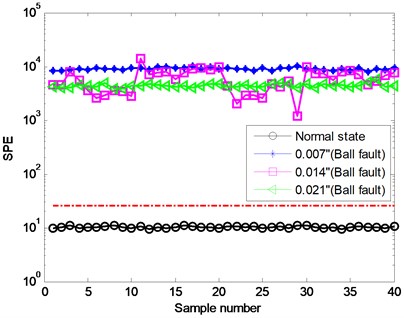
Similar to support vector machine (SVM), here the obtained threshold is regarded as a hyperplane which separates the samples into two classes, i.e. normal and abnormal conditions. As previously expected, we can find that the healthy states are below the threshold, while the three faulty states are opposite. So, the proposed work can detect bearing faults without any misclassifications. Moreover, each operating condition consisting of 40 samples reveals their own pattern. These metrics shown in Fig. 4 and Fig. 5 have separable values with regard to each of the states. Besides, the two detection results which have similar variation trend account for the complementary property. To further investigate the capability of the proposed detector, the inner and outer race faults are also examined for verification.
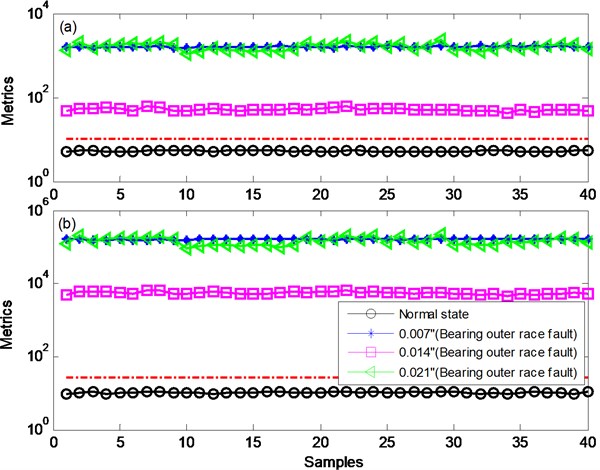
Fig. 6 indicates that the proposed detector is able to identify bearing inner race fault perfectly. The classification result for outer race fault displayed in Fig. 7 also demonstrates the effectiveness of the proposed work. From the results obtained, we can observe that bearing faults are captured by the two complementary spaces, state space and residual space. Actually, it is not necessary to ensure that all spaces are capable of detecting the faults mainly due to the fact that a fault may result in tremendous information variation in one space while the change may not influence the other obviously, vice versa. In this paper, a fault (F=1) determined finally should satisfy the following condition:
where ∥ represents logical OR operation. A and B are the diagnosis results for the retained space and residual space, respectively.
Fig. 6Identification result for inner race fault: a) classification result for state space, b) classification result for residual space
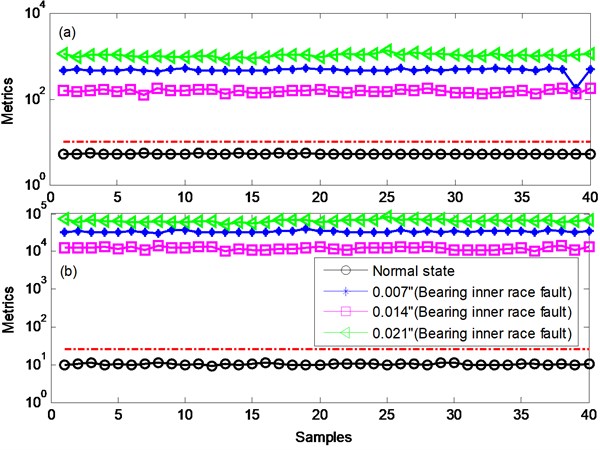
Fig. 7Identification result for outer race fault: a) classification result for state space, b) classification result for residual space
This is why the classification results are insensitive to the number of canonical variates retained. To this end, a harsh environment is taken into account for the purpose of validation.
Considering that the vibration signals used in this work are sampled from experimental setup, while the real data is usually buried in the external noise. Hence, the Gaussian white noises of SNRs +5, –5 and –10 dB are added into the original signal, respectively. As an example, Fig. 8 depicts the resulting signal with regard to bearing inner race fault. The corresponding classification results are listed in Table 2. In this study, the considered parameters p and f are set to 45, r=26. Similarly, the noisy signals are then employed to generate 160 samples in total, 40 samples under each condition. Due to the space limitation, the identification results for ball faults are presented in Fig. 9 for further analysis.
Fig. 8The original and resulting signals (inner race fault)
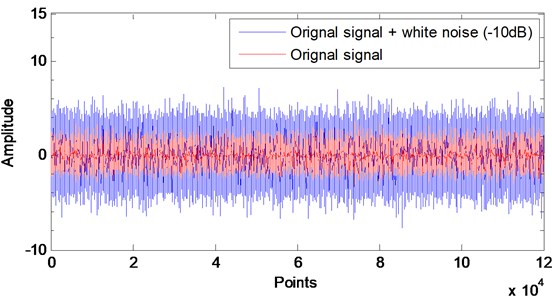
Table 2Detection results for noisy data
Conditions | SNRs | Classification accuracy (%) | ||
Ball fault | Inner race fault | Outer race fault | ||
1 | +5 | 100 | 100 | 100 |
2 | –5 | 100 | 100 | 100 |
3 | –10 | 100 | 100 | 100 |
As indicated in Table 2, though the original signals are buried by the noises, the proposed work still retains perfect robustness under various conditions. As shown in Fig. 9, when the SNR is varied from +5 to –10, the proposed technique is also efficient for fault diagnosis of rolling bearing. As a result, the proposed work is able to reject noises so that it is suitable for practical application. Since the proposed approach is tested based on the same number of canonical variates retained, taking the ball fault in condition 3 as an example to demonstrate the impact of the number retained r on diagnosis result is necessary. Fig. 10 shows the identification result for the two spaces for r=10. As displayed in Fig. 10, all states are separated accurately by the threshold except the ball fault of severity level of 21’’ in Fig. 10(a). The root cause for misclassification lies in that the number of canonical variates retained r fails to retain sufficient fault information for the construction of state space. However, this paper takes the two complementary spaces into account at the same time to diagnose bearing fault, the fault information not captured in the state space will be captured by the residual space, vice versa. Fig. 10 indicates that the ball fault misclassified in the retained space (as shown in Fig. 10(a)) are captured by the error space (Fig. 10(b)). Hence, the misclassification can be corrected by using Eq. (24).
A comparison between the results obtained is implemented for further investigating the complementary property of the proposed work. As shown in Fig. 9(c) and 11, for r=26, the experimental results indicate the ball faults can be detected by the two subspaces. This phenomenon illustrates that the fault information retained in each space is sufficient to judge whether the bearing is healthy or not. By comparing the results with Fig. 10, we can find that the metrics of the three faults depicted in Fig. 10(a) decrease evidently, in contrast to this, the metrics described in Fig. 10(b) increase largely compared with Fig. 11. According to Eq. (24), the same conclusion can be obtained so that diagnosis result of rolling bearing is insensitive to the number of canonical variates retained.
Then, comparison of the proposed approach with published works is carried out. The comparison details are depicted in Table 3.
Fig. 9Diagnosis results for the retained space of noisy data from different cases: a) Gaussian white noises of SNRs +5, b) Gaussian white noises of SNRs –5, c) Gaussian white noises of SNRs –10
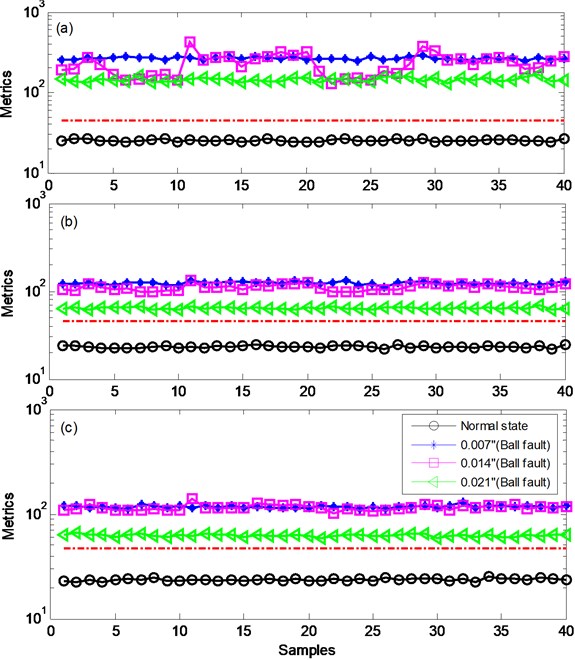
Fig. 10Classification result for r= 10: a) diagnosis result for the state space, b) diagnosis result for the residual space
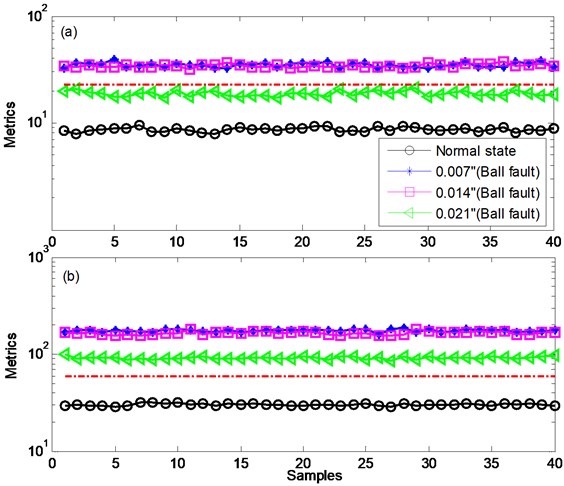
Fig. 11Diagnosis results for the error space of noisy data (for the case of SNR= –10 dB, r= 26)
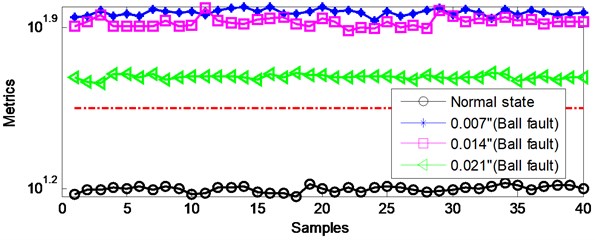
Table 3Comparison of present work with published approaches
Published works | Decomposition methods | Feature selection methods | Training data sets | Classification | De-noising and reconstruction methods |
[13] | EMD | Correlation analysis | N/A | Visual inspection | Nonlocal means Wavelet de-noising Mode selection |
[14] | Wavelet decomposition | Autocorrelation function estimation | N/A | Binary classification | |
[15] | EMD | Kurtosis | Normal data set | Binary classification | |
[27] | WPD | Frequency spectrum analysis | Normal +faulty data set | Multi-classification | Fisher discriminant analysis |
Proposed work | SVD | N/A | Normal data set | Binary classification | N/A |
Correlation analysis is performed in [13] to select effective mode so as to remove data redundancy derived from EMD, for the purpose of extracting the characteristic frequencies of rolling bearing. However, this is a visual inspection method. In [14], high-frequency characteristics based technique is put forward to identify the working conditions of rolling bearing, but this is an analysis method, which detects bearing's status by using the signal recorded under the corresponding condition. It is well known that bearing fault diagnosis includes three main procedures, viz. feature extraction, feature selection and fault diagnosis [3]. In [15], the proposed work decomposes the original signal into a set of modes by using EMD, then the feature vectors extracted from the modes of interest which are selected using kurtosis criterion are used as testing samples. At last, three detectors are combined to judge the operating condition through majority voting scheme, for the purpose of increasing classification accuracy. The diagnosis result obtained in [15] demonstrates that the proposed work is effective, but the diagnosis procedure is troublesome as well as the computation. Furthermore, the PCA detector in [15] is considered as a reconstruction method, i.e. the reconstructed signal is expressed by the retained principal components while the residual part is ignored. This manner yields the fault information loss. Similar to [15], feature selection is an inevitable topic in [27]. Frequency spectrum analysis is a visual inspection method which is applied to select decomposition scale so that the work in [27] is not suitable for diagnosing fault automatically. In this paper, different from the published works, SVD is applied to divide the original space into state space and residual space rather than to decompose modes. Hence the feature selection step can be eliminated. Besides, the two spaces are taken into account to reject the influence of the single space on diagnosis result. At last the result obtained is satisfactory. Based on the analysis above, we can observe that each work suggested in the literatures is composed of several methods, whereas these methods may introduce some additive problems which need to be solved. For example, signal decomposition produces the feature selection problem, various criterions and optimization algorithms are applied for feature selection, these operations complicate the diagnosis procedure.
4. Conclusions
This paper proposes a CVA based detector to diagnose the bearing fault considering the fact that faulty datasets are not readily available in practical application. The proposed work interprets the threshold trained by the normal dataset as a classification hyperplane to distinguish faulty operating condition. However, the amplitudes of two metrics T2 and Q are easy to exceed the thresholds. To compensate this issue, the CVA based detector adopts the mean of metrics to replace the amplitude to increase the classification distance, and takes advantage of the complementary property of T2 and Q to avoid the influence of the number of canonical variate retained on classification result. The efficiency of the proposed work is demonstrated by experimental data, and comparison of present work with published methods is provided. The result shows that the proposed work can be effectively applied for bearing fault diagnosis.
To sum up, the following conclusions can be obtained based on the analysis and experiments:
1) The proposed work separates the original signal into two complementary spaces for capture of fault information, so that the complex feature/mode selection procedure can be avoided. Experimental results demonstrate that the diagnosis result is insensitive to the number of canonical variate retained.
2) The two complementary spaces are considered at the same time in this paper to retain the fault information completely. As mentioned above, the fault information not captured in the state space will be captured by the error space.
3) The proposed work can be applied to engineering practice since its good performance in noises rejection.
4) The proposed work is simple and effective for fault diagnosis of rolling bearing, and the results obtained are satisfactory.
References
-
Jiang H., Chen J., Dong G., Liu T., Chen G. Study on Hankel matrix-based SVD and its application in rolling element bearing fault diagnosis. Mechanical Systems and Signal Processing, Vol. 52, Issue 53, 2015, p. 338-359.
-
Grasso M., et al. A data-driven method to enhance vibration signal decomposition for rolling bearing fault analysis. Mechanical Systems and Signal Processing, 2016.
-
Van M., Kang H. J. Bearing-fault diagnosis using non-local means algorithm and empirical mode decomposition-based feature extraction and two-stage feature selection. IET Science, Measurement and Technology, Vol. 9, Issue 6, 2015, p. 671-680.
-
Sun J., Xiao Q., Wen J., Zhang Y. Natural gas pipeline leak aperture identification and location based on local mean decomposition analysis. Measurement, Vol. 79, 2016, p. 147-157.
-
Evagorou D., Kyprianou A., Lewin P. L., et al. Feature extraction of partial discharge signals using the wavelet packet transform and classification with a probabilistic neural network. IET Science, Measurement and Technology, Vol. 4, Issue 3, 2010, p. 177-192.
-
Liu H., Han M. A fault diagnosis method based on local mean decomposition and multi-scale entropy for roller bearings. Mechanism and Machine Theory, Vol. 75, 2014, p. 67-78.
-
Lu C., Chen J., Hong R., Feng Yang, Li Y. Degradation trend estimation of slewing bearing based on LSSVM model. Mechanical Systems and Signal Processing, Vol. 76, Issue 77, 2016, p. 353-366.
-
Li Y., Xu M., Wang R., Huang W. A fault diagnosis scheme for rolling bearing based on local mean decomposition and improved multi scale fuzzy entropy. Journal of Sound and Vibration, Vol. 360, 2016, p. 277-299.
-
Zhang B., Zhang L., Xu J. Degradation feature selection for remaining useful life prediction of rolling element bearings. Quality and Reliability Engineering International, Vol. 32, 2016, p. 547-554.
-
Cerrada M., Zurita G., Cabrera D. Fault diagnosis in spur gears based on genetic algorithm and random forest. Mechanical Systems and Signal Processing, Vol. 70, Issue 71, 2016, p. 87-103.
-
Feng Z., Ma H., Zuo M. J. Amplitude and frequency demodulation analysis for fault diagnosis of planet bearings. Journal of Sound and Vibration, Vol. 382, 2016, p. 395-412.
-
An X., Zeng H., Li C. Demodulation analysis based on adaptive local iterative filtering for bearing fault diagnosis. Measurement, Vol. 94, 2016, p. 554-560.
-
Lv Y., Yuan R., Song G. Multivariate empirical mode decomposition and its application to fault diagnosis of rolling bearing. Mechanical Systems and Signal Processing, 2016.
-
Cui H., Qiao Y., Yin Y., Hong M. An investigation of rolling bearing early diagnosis based on high-frequency characteristics and self-adaptive wavelet de-noising. Neurocomputing, 2016.
-
Georgoulas G., Loutas T., Stylios C. D., et al. Bearing fault detection based on hybrid ensemble detector and empirical mode decomposition. Mechanical Systems and Signal Processing, Vol. 41, 2013, p. 510-525.
-
Liu Z., He Z., Guo W., Tang Z. A hybrid fault diagnosis method based on second generation wavelet de-noising and local mean decomposition for rotating machinery. ISA Transactions, Vol. 61, 2016, p. 211-220.
-
Li K., Zhang Q., Wang K., Chen P., Wang H. Intelligent condition diagnosis method based on adaptive statistic test filter and diagnostic Bayesian network. Sensors, Vol. 16, Issue 1, 2016, p. 76-91.
-
Zhang Y., Zuo H., Bai F. Classification of fault location and performance degradation of a roller bearing. Measurement, Vol. 46, 2013, p. 1178-1189.
-
Jiang B., Zhu X., Huang D., et al. A combined canonical variate analysis and Fisher discriminant analysis (CVA-FDA) approach for fault diagnosis. Computers and Chemical Engineering, Vol. 77, 2015, p. 1-9.
-
Jiang B., Huang D., Zhu X., et al. Canonical variate analysis-based contributions for fault identification. Journal of Process Control, Vol. 26, 2015, p. 17-25.
-
Ruiz-Cárcel C., Cao Y., Mba D., Lao L., Samuel R. T. Statistical process monitoring of a multiphase flow facility. Control Engineering Practice, Vol. 42, 2015, p. 74-88.
-
Odiowei P. E. P., Cao Y. Nonlinear dynamic process monitoring using canonical variate analysis and kernel density estimations. IEEE Transactions on Industrial Informatics, Vol. 6, Issue 1, 2010, p. 36-45.
-
Case Western Reserve University Bearing Data Center. http://csegroups.case.edu/bearingdata center/home.
-
Smith W., Randall R. B. Rolling element bearing diagnostics using the Case Western Reserve University data: a benchmark study. Mechanical Systems and Signal Processing, Vol. 64, Issue 65, 2015, p. 100-131.
-
Harmouche J., Delpha C., Diallo D. Incipient fault detection and diagnosis based on Kullback-Leibler divergence using principal component analysis: Part I. Signal Processing, Vol. 94, 2014, p. 278-287.
-
Harmouche J., Delpha C., Diallo D. Incipient fault detection and diagnosis based on Kullback-Leibler divergence using principal component analysis: Part II. Signal Processing, Vol. 109, 2015, p. 334-344.
-
Tao X., Lu C., Lu C., Wang Z. An approach to performance assessment and fault diagnosis for rotating machinery equipment. EURASIP Journal on Advances in Signal Processing, Vol. 2013, Issue 1, 2013, p. 1-16.
About this article
We are grateful to Case Western Reserve University Bearing Data Center for providing the original bearing fault vibration signals used in this paper.
The authors declare no conflict of interest.
