Abstract
A multichannel vibration data processing method in the context of local damage detection in gearboxes is presented in this paper. The purpose of the approach is to achieve more reliable information about local damage by using several channels in comparison to results obtained by single channel vibration analysis. The method is a combination of time-frequency representation and Principal Component Analysis (PCA) applied not to the raw time series but to each slice (along the time) from its spectrogram. Finally, we create a new time-frequency map which aggregated clearly indicates presence of the damage. Details and properties of this procedure are described in this paper, along with comparison to single-channel results. We refer to autocorrelation function of the new aggregated time frequency map (1D signal) or simple spectrum (that might be somehow linked to classical envelope analysis). The results are very convincing – cyclic impulses associated with local damage might be clearly detected. In order to validate our method, we used a model of vibration data from heavy duty gearbox exploited in mining industry.
1. Introduction
A problem of fault diagnosis in rotating machines has attracted attention of researchers for many years. In the literature one can find several comprehensive reviews on damage detection in gears and bearings [1-3]. Classical methods incorporate high-order statistics [4], empirical mode decomposition [5], wavelet transform [6], time-frequency domain analysis [7-9], bi-frequency analysis [1, 10]. Vibration signal from a machinery system is often a mixture of several source signals. For instance, a signal acquired on a bearing operating in a belt conveyor driving station, might be contaminated with vibrations of a gearbox located nearby or by vibrations caused by other damage [11-16]. Signal acquired on a gearbox revealing multiple damage is another example of a multi-source signal [15, 16]. In this paper we incorporate principal component analysis (PCA) for local damage detection in a two-stage gearbox operating in a belt conveyor driving station. The investigated data represents vibration acceleration of a single gearbox, measured at 4 different locations. PCA is performed on time-frequency representations of the signals. Additionally, performance of the proposed algorithm in comparison to single-channel analysis will be discussed. The method proved that integration of vibration signals from several channels provide a much clearer damage indication than a single signal does.
2. Methodology
In this chapter we will discuss the methodology that we applied to vibration signal from heavy duty gearbox operating in a belt conveyor driving station used in underground mining industry. The technique consists of several main steps.
In our analysis we take under consideration not the input signals directly, but the sets of four narrow-band slices from individual spectrograms of those signals.
First, the transformation of input channels into time-frequency representations (spectrograms) is performed. The spectrogram is a square of absolute value of the short-time Fourier transform (STFT) defined as follows:
where w(t-τ) is shifted window and xk is the input signal. In the next step we divide the time-frequency maps into narrow-band slices corresponding to given frequency bins. As a result of this step we obtain four dimensional sub-signals for each frequency band, since 4 channels are analyzed. Then we make use of Principal Component Analysis (PCA) [17-20].
Principal Component Analysis is one of the most common and widespread methods for multivariate linear data analysis. It serves for investigating data structure, data mining, data smoothing and approximation, also for exploring data dimensionality. The method permits to build new features, called principal components (PCs), which may serve for visualization of the data.
Let X of size n×d denote the observed data matrix. For simplicity of presentation, assume that n>d, and that X is of full rank. It is advised to standardize or normalize the matrix X. We assume that the data matrix is columnwise normalized. It means that all columns have means equal to 0 and variances equal 1/n. The PCA starts from computing the eigenvalues (λ) and eigenvectors (v) of the cross-product matrix S=XTX satisfying the matrix equation (S-λI)v=0. This results in d eigenvalues:
and d eigenvectors associated with them:
The eigenvectors constitute the loading matrix V=[v1,…,vd]. The two fundamental PCA paradigms are:
1) Feature construction:
The new features identified as columns of Z(K) are called Principal Components.
2) Data reconstruction:
Taking K=d, the full original data matrix Xn×d is reconstructed. For K<d the best linear approximation of Xn×d by a rank-K matrix ˆX(K)n×d is obtained – it is best in the meaning of the L2 norm.
The constructed PCs have the major advantage that they are uncorrelated, which permits to analyze each of them separately, without referring to the others.
Principal components can be also computed via Singular Value Decomposition (SVD):
where Z=UD e contains the PCs, and V the loading matrix.
For each of four-dimensional sub-signals X(K)n×K we calculate PCA which returns four new features Z(K)n×K. Then we select the first component and insert it into a new array. As a result we obtain the new time-frequency map which consists of selected features corresponding to given frequency bands. At the end we aggregate the newly constructed time-frequency map into time domain to produce one-dimensional time series which is expected to contain cyclic impulsive components related to local damage.
Fig. 1The scheme of the introduced technique of local damage detection
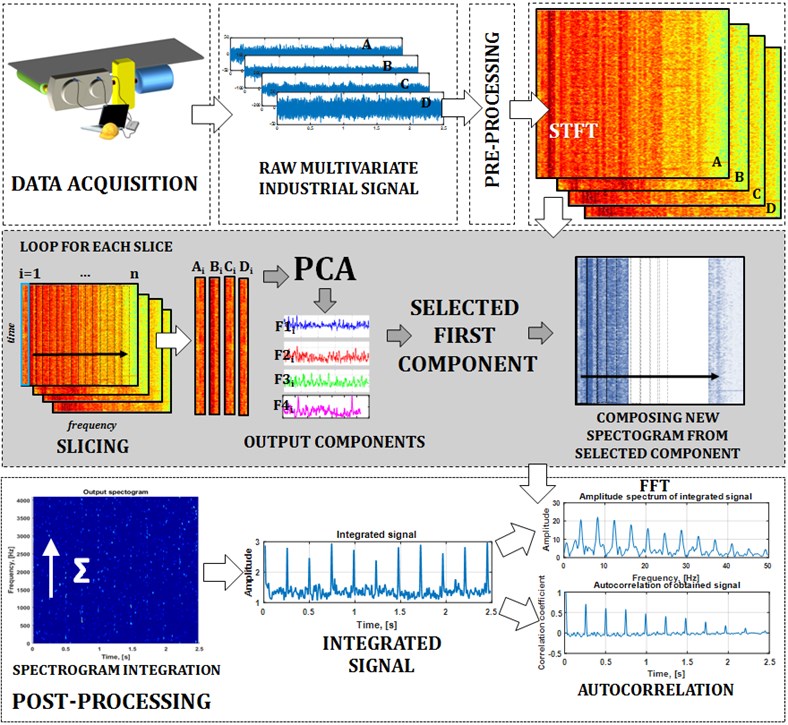
In order to detect cyclicity of the obtained time series we calculate spectrum and its autocorrelation function. We remind the autocorrelation of random stationary process X for time-lag τ is defined as:
where E is the expected value operator and μ, σ are mean and standard deviations of X, respectively. Such spectrum can be considered as envelope spectrum since integration of the spectrogram returns information about signal energy flow and can be related to upper envelope of the signal. The scheme of the presented methodology is shown in Fig. 1.
3. Application to industrial data
3.1. Machine and experiment description
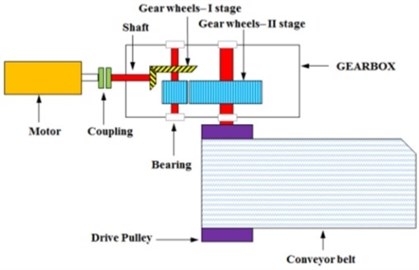
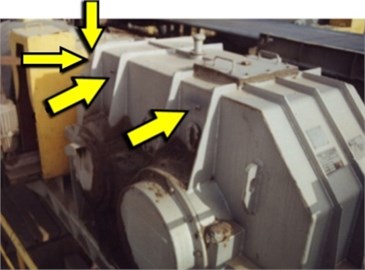
The machine considered here is a two-stage gearbox used in drive system for belt conveyor, see Fig. 2(a). Data used for validation of the method has been measured using accelerometers located on the gearbox housing (Fig. 2(b)) and the Brüel&Kjær system. The gearbox operates under stationary conditions, i.e. load and rotational speed are approximately constant. During the experiment four signals of equal duration have been acquired, each related to different sensor location (Fig. 2(b)).
Fig. 2a) Scheme of the investigated machine, b) location of sensors on gearbox housing
a)
b)
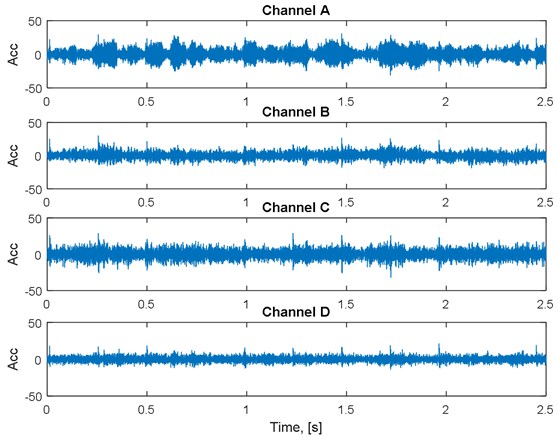
Fig. 3Multichannel input signal
The experiment shows that the gearbox does not reveal any damage. Thus, an artificial damage is introduced by specific signal processing technique in order to illustrate benefits of the proposed methodology. Namely, each of four acquired signals is considered as a response of the system (each signal stands for an individual system) to stationary noise, since there is no damage in the gearbox. Thus, we fit the autoregressive (AR) model to each of four signals by Yule-Walker equations and obtain four sets of coefficients called the impulse responses of the system. Orders of the AR models are high enough to reflect complexity of amplitude spectra of the acquired signals. Then, four pulse trains (Kronecker combs) with additive Gaussian noise are designed as excitation signals (source signals) that correspond to a damaged gearbox. Duration of the excitation signals is equal to the duration of signals acquired during the experiment. The fault frequency associated to damage in gear-wheel on the middle shaft is 4.1 Hz and this is the frequency of impulses in the pulse trains. The ratio of impulse to noise amplitudes is different for each excitation signal, which corresponds to different distance between each sensor and the damaged gear. Finally, the pulse trains are convolved with corresponding impulse responses and such signals are further analyzed and referred as “raw signals”.
3.2. Diagnostic data – raw multichannel signal
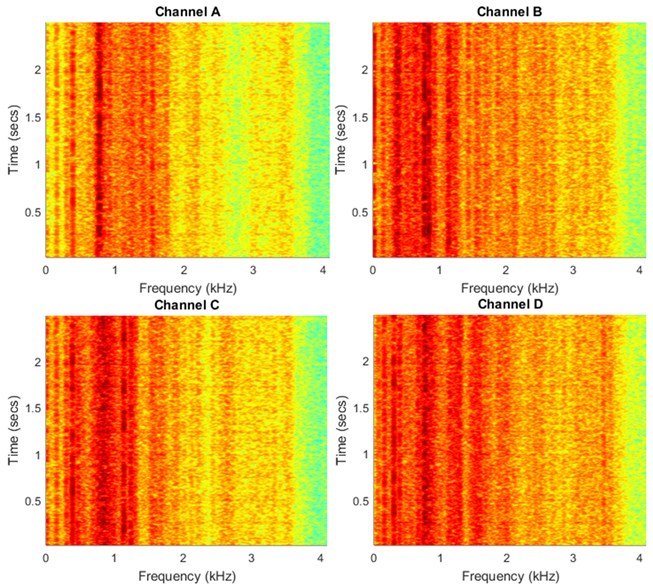
Raw multivariate (4D) signal considered here consists of four 2.5 s time series representing gearbox vibration under “normal” operation i.e. during transportation of bulk material. Frequency sampling is fs=8192 Hz. Raw multichannel signal and its spectrogram representation is shown in Fig. 3 and 4, respectively. Both time series and their spectrograms allow to notice some weak wideband impulsive components but it is impossible to distinguish them unambiguously.
Fig. 4Spectrograms of the multichannel signal
3.3. Evaluation of the algorithm performance on industrial data
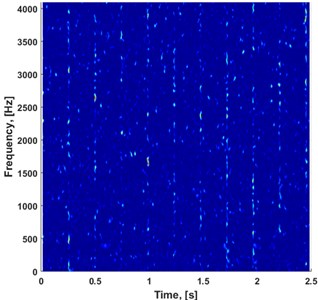
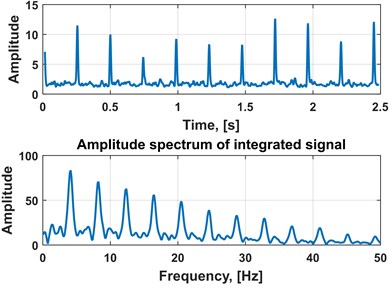
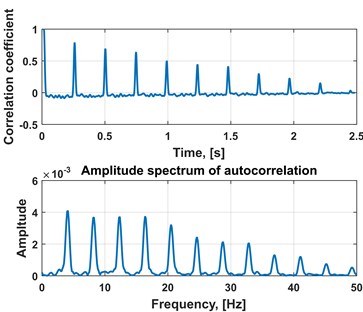
In this section we present the results of the introduced method, i.e. performance of the algorithm applied to the discussed industrial data. Fig. 5(a) presents new time-frequency map which consists of the components extracted by applying PCA to the sub-signals from the initial spectrograms. As we observe, the impulses (wideband excitations) are much more clear than in the spectrograms of the multichannel raw signal, see Fig. 4. Moreover, simple aggregation of 2D map into 1D vector by integration of energy for each time instance shows impulsive nature of energy flow. Using autocorrelation or simple spectrum one might identify period/frequency of impulse repetition that corresponds to fault frequency, see Fig. 5(b), (c).
It is also important to note that scores of principal components of slices from initial spectrograms vary in frequency domain. Although the first component was taken always, its score ranged from over 0.99 for heavily impulsive frequency bins, down to less than 0.6 for bins that do not carry as much impulsive information.
Fig. 5a) Output spectrogram composed of first PCA components, b) time series extracted from output spectrogram, spectrum of integrated time series and c) autocorrelation function of the integrated time series with its spectrum
a)
b)
c)
3.4. Comparison with hypothetical individual channel processing
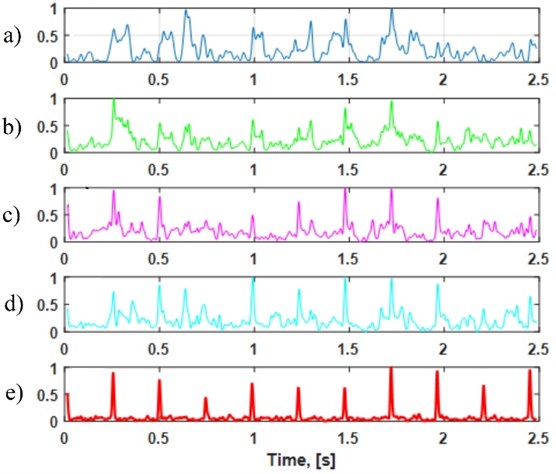
It is very important to justify the benefits of presented method in comparison to results of analogous approach applied to individual channels separately. For one channel we can only calculate the spectrogram and then aggregate it, since there is no multidimensionality to begin with. We have done this for four input channels. Fig. 6 presents comparison of the results with the output of our multichannel method. It is clear that the multichannel analysis is undoubtedly beneficial. As a measure of impulsiveness we chose kurtosis, which is widely appreciated as a standard indicator of signal impulsiveness. The empirical kurtosis for vector of observations x1, x2,…, xN has the following form:
Kurtosis values of individual channel outputs and multichannel procedure output are presented in Table 1.
Table 1Comparison of kurtosis values for individual channels vs. multichannel procedure
Channel | Kurtosis |
1 | 4,06 |
2 | 6,15 |
3 | 10,34 |
4 | 7,82 |
Multichannel | 22,83 |
Fig. 6Comparison of single channel analysis vs. proposed multichannel method (all normalized by scaling down to value range 0-1). Panels a)-d) show outputs for every channel separately, and panel e) presents output signal from our method
4. Conclusions
In this paper we have introduced a new method of local damage detection applied to the real vibration signal from heavy duty gearbox used in mining industry. This methodology is based on the analysis of multichannel time series and its representation in time-frequency domain (spectrogram). In order to extract information about the damage we analyze the features obtained by applying PCA to four-dimensional sub-signals corresponding to given frequencies on the spectrogram. The introduced technique applied to vibration signal gives much better results than the classical methods based on the analysis of one-dimensional vibration signal. By using the methodology cyclic impulses might be clearly noticed which allows to relate them with the damage. We should mention, that the proposed algorithm is automatic and can be applied to other vibration signals for which the classical methods do not provide desired results.
References
-
Randall R. B., Antoni J. Rolling element bearing diagnostics – a tutorial. Mechanical Systems and Signal Processing, Vol. 25, Issue 2, 2011, p. 485-520.
-
Samuel P. D., Pines D. J. A review of vibration-based techniques for helicopter transmission diagnostics. Journal of Sound and Vibration, Vol. 282, Issues 1-2, 2005, p. 475-508.
-
Feng Z., Liang M., Chu F. Recent advances in time-frequency analysis methods for machinery fault diagnosis: a review with application examples. Mechanical Systems and Signal Processing, Vol. 38, Issue 1, 2013, p. 165-205.
-
Antoni J., Randall R. The spectral kurtosis: application to the vibratory surveillance and diagnostics of rotating machines. Mechanical Systems and Signal Processing, Vol. 20, Issue 2, 2006, p. 308-331.
-
Lei Y., Lin J., He Z., Zuo M. J. A review on empirical mode decomposition in fault diagnosis of rotating machinery. Mechanical Systems and Signal Processing, Vol. 35, Issue 1, 2013, p. 108-126.
-
Lin J., Zuo M. Gearbox fault diagnosis using adaptive wavelet filter. Mechanical Systems and Signal Processing, Vol. 17, Issue 6, 2003, p. 1259-1269.
-
Burdzik R., Konieczny L., Folega P. Structural health monitoring of rotating machines in manufacturing processes by vibration methods. Advanced Materials Research, Vol. 1036, 2014, p. 642-647.
-
Lazarz B., Wojnar G., Czech P. Early fault detection of toothed gear in exploitation conditions. Eksploatacja i Niezawodnosc – Maintenance and Reliability, Vol. 49, Issue 1, 2011, p. 68-77.
-
Feng Z., Liang M., Chu F. Recent advances in time-frequency analysis methods for machinery fault diagnosis: a review with application examples. Mechanical Systems and Signal Processing, Vol. 38, Issue 1, 2013, p. 165-205.
-
Borghesani P., Pennacchi P., Chatterton S. The relationship between kurtosis- and envelope-based indexes for the diagnostic of rolling element bearings. Mechanical Systems and Signal Processing, Vol. 43, Issues 1-2, 2014, p. 25-43.
-
Obuchowski J., Wylomanska A., Zimroz R. Stochastic modeling of time series with application to local damage detection in rotating machinery. Key Engineering Materials, Vols. 569-570, 2013, p. 441-448.
-
Zak G., Obuchowski J., Wylomanska A., Zimroz R. Application of ARMA modelling and alpha-stable distribution for local damage detection in bearings. Diagnostyka, Vol. 15, Issue 3, 2014, p. 3-10.
-
Obuchowski J., Wyłomanska A., Zimroz R. The local maxima method for enhancement of time-frequency map and its application to local damage detection in rotating machines. Mechanical Systems and Signal Processing, Vol. 46, Issue 2, 2014, p. 389-405.
-
Obuchowski J., Wyłomańska A., Zimroz R. Selection of informative frequency band in local damage detection in rotating machinery. Mechanical Systems and Signal Processing, Vol. 48, Issues 1-2, 2014, p. 138-152.
-
Obuchowski J., Wylomanska A., Zimroz R. Two-stage data driven filtering for local damage detection in presence of time varying signal to noise ratio. Mechanisms and Machine Science, Vol. 23, 2015, p. 401-410.
-
Zak G., Obuchowski J., Wyłomanska A., Zimroz R. Novel 2D representation of vibration for local damage detection. Mining Science, Vol. 21, 2014, p. 105-113.
-
Moore B. Principal component analysis in linear systems: Controllability, observability, and model reduction. IEEE Transactions on Automatic Control, Vol. 26, Issue 1, 1981, p. 17-32.
-
Jolliffe I. T. Principal Component Analysis and Factor Analysis. Principal Component Analysis, 1981, p. 150-166.
-
Krzanowski W. J. Principles of Multivariate Analysis. Oxford University Press, 1988.
-
Zimroz R., Bartkowiak A. Two simple multivariate procedures for monitoring planetary gearboxes in non-stationary operating conditions. Mechanical Systems and Signal Processing, Vol. 38, Issue 1, 2013, p. 237-247.
Cited by
About this article
This article is a result of teamwork. Jacek Wodecki prepared a manuscript and implemented the algorithm. Paweł Stefaniak provided the measurement data along with the mining expertise and supported developing the algorithm. Jakub Obuchowski modeled the test signals. Agnieszka Wyłomańska verified theoretical integrity from the mathematical point of view. Radosław Zimroz provided the mining knowledge and revised the article critically for important intellectual content.

