Abstract
The flow-induced interior noise in pump as turbine (PAT) consists of flow-borne noise and flow-induced structure noise from dipole source. Without accurate distinguishing of main interior noise, the noise control and management cannot be guided. The experiments of flow-induced interior noise and free modals for rotor and casing were performed to validate the accuracy of numerical methods. The computational models for flow-induced noise and flow-borne noise considering structure in interior acoustic field were developed. On the basis of this, the spectrum characteristics of each noise source and their contribution to the total noise were distinguished. It is found that within interior noise, the radiated energy of flow-induced structure noise is less than that of flow-borne noise generated by dipole source. Compared with the experiment, the flow-borne noise considering structure due to casing source can more precisely reflect joint action of multiple sources. Especially in larger flow conditions, the maximum error is only 5.9 % at Blade-Passing Frequency (BPF) and its harmonics.
1. Introduction
The ability for pumps to operate efficiently in reverse as turbines was firstly established by Thoma [1] in 1931, when mapping the full operating characteristic of a centrifugal pump. In recent decades, pump as turbine (PAT) has been found to be one of the cheap and attractive alternatives in high pressure fluid and small hydropower exploration [2]. As a kind of energy saving technology by recovery of residual pressure, it is gradually developing for high-power for further improving the efficiency of energy recovery. Moreover, the subsequent flow-induced noise has become one of the most important issues that cause negative effect on the operation stability.
As concerns PAT, considerable researches have deal with hydraulic performance prediction (especially at Best Efficiency Point) used for type-selection [3-6] and performance improvement with focusing on the impact of impeller and volute geometry parameters [7-11]. With respect to the operation stability, only pressure fluctuation characterisc within flow passages was researched [12]. However, the flow-induced noise due to pressure fluctuation acting on inner surface of PAT was seldom concerned. There are two main types of interior noise in PAT, namely flow-borne noise and flow-induced structure noise. Flow-borne noise propagates as the forms of internal stress and pressure disturbance of fluid, mainly induced by turbulent fluctuation, rotor-stator interaction, flow separation, cavitation, and so on [13, 14]. The elastic structure under the action of fluid load will produce forced vibration and radiated noise, that is flow-induced structure noise [15]. Actually, a closed flowing space is formed by PAT and the inlet and outlet piping system. The flow-borne noise will spread along with the flow-induced structure noise. So, how to predict each noise source, distinguish their contribution to the total noise and propose a model expressing their combined effect needs be solved urgently.
As a promising technique, computational acoustic has the advantage of not requiring large scale experiment facilities with acceptable accuracy. It has been widely used for exploring the mechanism and features of flow-induced interior noise. It can roughly be classified into three types of methods, namely Computational Aero-Acoustic (CAA) [16], Lighthill’s Acoustic Analogy [17] and Hybrid Method [18]. Based on N-S Equations, the CAA method can obtain the unified solution of flow and acoustic fields, not relying on any acoustic model. However, due to the big difference between flow and acoustic fields (i.e. acoustic wavelength and turbulence scale, acoustic energy and vortex energy, sound pressure and macropressure magnitude of fluid), high requirements on mesh scale, computation time and discretization scheme are needed. And this method is only applicable to practical engineering problems with relatively small calculating domain. The Lighthill’s Acoustic Analogy method calculates acoustic field by transforming flow information to sound source, based on acoustic model built-in CFD softwares. Due to separate calculation of sound production and propagation, the computing amount and scheme are decreased. This method is generally applied to calculate far-field noise, with larger error in near-field noise. In Hybrid Method, the acoustic source intensity of internal flow field is firstly calculated by CFD software, then flow-induced noise is calculated combined with acoustic software. In essence, it is a kind of Lighthill’s Acoustic Analogy method. Moreover, the reflection and scatteration of structure will be considered and the radiated noise of structure caused by fluid load will also be calculated by this method. As a physics-based mathematical model used in acoustic software, acoustic Boundary Element Method (BEM) greatly reduces the degree of freedom in calculation and improves solving accuracy. Unlike traditional Lighthill’s acoustic analogy theory, it can solve the acoustic information of the whole calculation domain without distinguishing far- and near- fields. As for turbo machinery, the unsteady hydrodynamic force acting on the surfaces of impeller and casing is dipole source casing flow-borne noise. In addition, it will induce structural noise, involving fluid load, structure response and vibroacoustic coupling. When concerning the noise radiated from the elastic structure in fluid, the effective coupled method of BEM and structure Finite Element Method (FEM) can be adopted. The fluid load is taken into account by BEM, and the elastic structure is simulated with FEM. Kato [19] and Jiang [20] et al. presented a full-scale weakly coupled method for simulating flow-induced mechanical vibration and noise. Firstly, a time series of pressure fluctuations on inner surface of pump were obtained using CFD program, then they were used for structural analysis based on an explicit dynamic FEM method. However, the final radiated noise from vibration velocity by Sysnoise acoustic software was not involved. Kato et al. [21] actually performed the acoustical computation radiated to the ambient air in a multi-stage centrifugal pump, mainly due to rotor-stator interaction. However, it is confined to flow-induced structure noise in external field, with little focusing on distinguishment of main source in interior noise and prediction of the combined effect of the two interior noises.
To address the above questions, the experimental studies of flow-induced noise and free modal parameters for rotor and casing were conducted to clarify the accuracy of numerical methods. Then, the dipole sources on the surfaces of rotating blade and stationary casing were extracted. Based on BEM and coupled FEM/BEM, the flow-borne noise and flow-induced structure noise due to different sound sources were compared. After that, the analytical model is put forward to represent the combined interior noise verified by experiment.
2. Experimental investigation
2.1. Interior noise test
A standard test facility for the interior noise measurement of the investigated PAT has been constructed in [22], as shown in Fig. 1. In the test facility, a feed pump was installed to supply high pressure fluid required for PAT energy recovery. The pressure energy of fluid was transformed to the mechanical energy of shaft by rotating impeller. An electric eddy current dynamometer was adopted to measure and consume energy generated by PAT and to regulate rotating speed. The inlet and outlet pressure were obtained using pressure transmitters. The discharge was measured by using a turbine flow meter. At four times diameter of inlet pipe and draft tube, ST70 hydrophones were installed to measure the interior noise generated by PAT, with a sampling frequency of 25.6 kHz. The average method in whole range was adopted to reduce random noise error. And Hanning window was used to reduce leakage error in frequency-domain due to time-domain truncation. Note that, because the PAT was connected with the pipeline system, it must try to eliminate the effect of other sound sources in the pipeline to ensure the measurement accuracy. At each working condition, each valve in the loop system remained fully open, so the effect of valve noise can be ignored. Due to the flush installation method of hydrophone, the noise can be measured reliably with minimum effect on the flow field in the pipe. A shortcoming of this method is the measurement will be affected by the boundary layer turbulence noise on the pipe walls. However, the existing studies have shown that the boundary layer turbulence noise is so small compared with pulsating noise [23], so the measured noise by hydrophone can be thought of as the noise generated by the PAT.
Fig. 1Sketch of the test installation
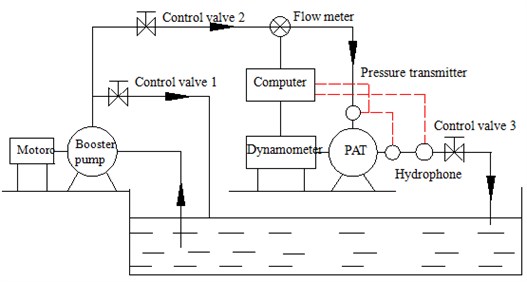
The PAT investigated in this study is a volute-type single-stage centrifugal pump operating in a turbine mode. Its design parameters in pump mode are as follow: flow rate 90 m3/h, head 35 m, rotating speed 1500 r/min and specific speed 60. Table 1 lists its main geometric parameters in pump mode.
Table 1Main PAT geometric dimensions
Impeller inlet diameter, (mm) | 102 |
Impeller outlet diameter, (mm) | 255 |
Impeller outlet width, (mm) | 14 |
Inlet vane angle, (°) | 19.5 |
Outlet vane angle, (°) | 20 |
Blades, | 6 |
Blade wrap angle, (°) | 130 |
Volute base circle diameter, (mm) | 266 |
Volute outlet width, (mm) | 26 |
2.2. Experimental modal analysis
Experimental modal analysis was a kind of dynamic test based on the exciting force and the response of a system. Fig. 2 shows the sketch of modal test. The highest natural frequencies of the mounting systems were verified to be far less than 20 % of the first-order natural frequency of structure itself. The acceleration sensor and hammer were connected to the signal modulation system and SD380 dynamic analysis system, respectively. By it, the matrix of frequency response function can be obtained through measurable and controllable dynamic excitation over structure. Then, the modal parameters can be acquired by polynomial curve fitting method in frequency domain. By motivating each point with a single response measuring point fixed, the modal experiment was performed. The acquisition frequency was chosen equal to 5.12 kHz with a resolution of 6.4 Hz. The transient force window was imposed to improve the signal-to-noise ratio of excitation signal. And index window was imposed on response signal, to accelerate vibration attenuation and avoid the leakage of frequency response function.
Fig. 2Sketch of the modal test
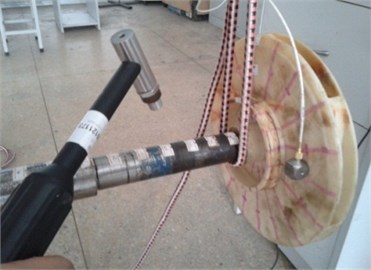
a) Rotor
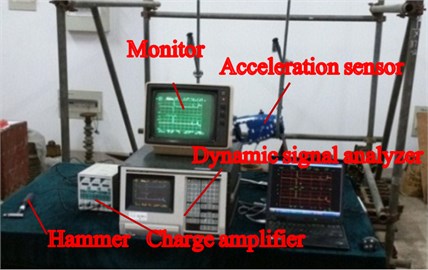
b) Casing
The measuring points should be distributed appropriately to distinguish each vibration. The factors that should be considered when choosing the location of measuring points are as follows: (1) the structure contour of the PAT should be reflected and the measuring points on the regular part of structure should be arranged symmetrically. (2) Measuring points should be arranged closely at main load-bearing parts. (3) The acceleration sensor should be placed away from the nodes of each vibration modal without losing modal. (4) More measuring points should be placed at some local area where there may be more modal. Finally, 164 and 306 measuring points are arranged at the main part of rotor and casing.
3. Numerical simulation
3.1. Acoustic simulation
With fluid as noise source in PAT, there are two main forms of dipole sources, that are rotating dipole source on the surfaces of the impeller and fixed dipole source on the casing wall. And, the flow-induced interior noise can be divided into two kinds: (1) the directly radiated interior noise due to dipole source, that is flow-borne noise. (2) the radiated interior noise due to structure vibration under the action of dipole source, that is flow-induced structure noise. The two forms of interior noise exist side by side. Based on LMS Virtual.Lab 12, the BEM and FEM/BEM vibroacoustic coupling method were adopted to solve flow-borne noise and flow-induced structure noise. Fig. 3 shows the calculation process. In terms of the flow-borne noise excited by casing source, firstly four cycles of pressure fluctuations on inner walls of casing were solved based on URANS. Then, the interior acoustic field was solved based on BEM method. While as for the flow-borne noise generated by impeller source, only the pressure fluctuations on the walls of rotating impeller in time-domain was extracted. During the noise calculation, when the size of impeller is far less than the wavelength, the sound field caused by pressure fluctuations on the impeller surface can well be characterized by the fan sound source. While when the impeller size is bigger, the discrete fan sound source is needed to be used to calculate the sound field. That is, the impeller is divided into n parts with the load and its location defined on each part. Here, the impeller was divided into 10 pieces. Concerning the flow-induced structure noise, the load is no longer macro pressure fluctuation, but sound pressure on the casing due to internal dipole source. The pressure fluctuations on casing walls were firstly transferred onto the meshes of solid walls. Then, the solution of vibration displacement under the excitation was performed based on the natural modal of structure. Finally, with the vibration displacement as boundary conditions, the flow-induced structure noise was solved by FEM/BEM method. To predict the combined effect of the two interior noises, a computing method was employed, which was still based on FEM/BEM method. The only difference was that the pressure fluctuation was interpolated on the casing surfaces of interior acoustic model, not structure. In this way, the flow-borne noise considering structure can be solved under sound pressure.
Fig. 3Calculation process of BEM and FEM/BEM
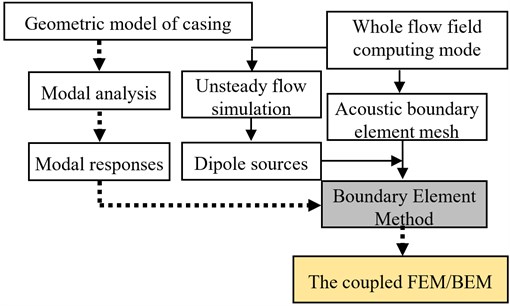
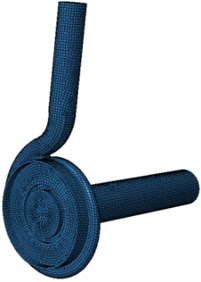
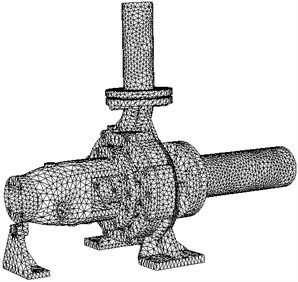
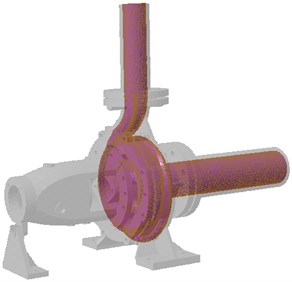
Fig. 4 gives a general view of the generated meshes for acoustic boundary element and structure finite element. As for BEM, the closed surface mesh with consistent size was required. 6 millimeters were chosen as the element size, which is less than 1/6 of the corresponding wavelength at the maximum calculated frequency ( 2000 Hz, sound velocity in water 1500 m/s). When taking into account of the influence of structure, the modal responses of casing was analyzed by FEM. The casing structure consisted of pump body, cover, suspension, supporting feet, inlet pipe and draft tube. The inner walls of the whole flow field were used as field point for measuring main acoustic results. When mapping acoustic boundary element mesh with structure finite element mesh, the geometry interpolation method of Element Maximum Distance was adopted. Four closest nodes were interpolated from the elements whose distance was less than 10 mm. The coupling interfaces were shown in Fig. 4(c). To simulate the direct spread of noise in piping without reflection, the inlet pipe and draft tube of PAT were set to full absorption, and other surfaces were defined as total reflection, with the acoustic impedance 1.5×10⁶ kg/(m2·s), Monitoring points were set at inlet pipe and draft tube for studies of the propagation properties, at the same position of the experiment.
Fig. 4Mesh diagram for interior noise
a) Acoustic boundary element
b) Structure finite element
c) Coupled interface mesh
To make the load transfer more accurate from flow-field to acoustic field, the whole fluid domain, including volute, impeller, leakage chambers, inlet pipe and draft tube, was discretized with tetrahedral cells. By it, the fluid forces acting on all surfaces of impeller and volute were taken into account. Three sets of tetrahedral mesh were generated and chosen by a grid independence test. It was found when the total number of cells is increased up to 2600k, the obtained head of centrifugal pump in turbine mode becomes independent of mesh size. The unsteady pressure fluctuations on the walls were calculated by CFX. With multiple coordinate systems, the flow field in the impeller was calculated in a rotating coordinate system, while others were set in a steady coordinate system. The interfaces were used for data transfer among rotating and static parts. For an initial steady calculation, the frozen rotor/stator interface was used, and the transient rotor/stator interface was used for transient calculation. The inlet and outlet in turbine mode were set as static pressure, and mass flow, respectively. All surfaces were defined as no-slip walls. The roughness was set to 50 μm. The turbulence selected was k-ε model. For sufficiently distinguishing the unsteady information, the time step was set to 1.1111×10⁻⁴ s, which means the impeller rotates about 1° in each time step [24].
3.2. Structural simulation
The modal responses of rotor and casing were analyzed by ANSYS. It was the preparation for vibration modal and radiated noise without understanding local characteristics and stress conditions. So, the modeling process only retained the structures with larger normally radiating area. The other tiny structures (i.e. bosses, transition fillets) were removed. Moreover, the holes on the structure surface, such as injection and drainage holes and cover surface, were filled. The type of 187 solid elements was used. The finite element models of rotor and casing included 338 569 elements, 69 716 nodes and 1 914 480 elements and 379 537 nodes, respectively. The impeller was made of ABS with a mass density of 1050 kg/m3, an elastic module of 1.25 GPa and Poisson ratio of 0.39. The shaft was made of steel 45 with a mass density of 7890 kg/m3, an elastic module of 209 GPa, and Poisson ratio of 0.269. Gray Cast HT200 was applied to the casing, whose density 7200 kg/m3, elastic module 148 GPa and Poisson ratio 0.3.
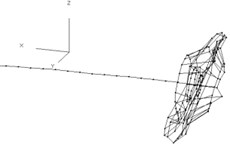
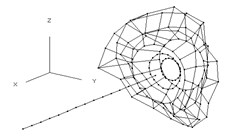
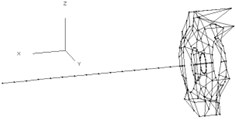
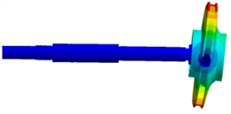
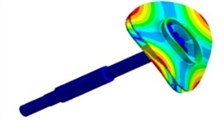
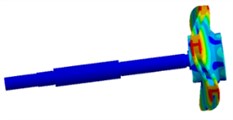
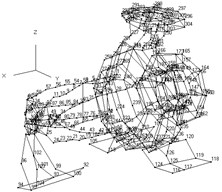
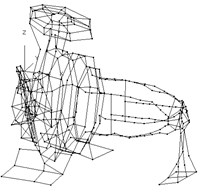
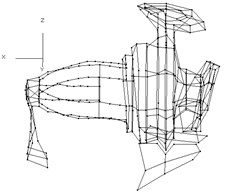
Table 2 lists the comparison of free modal frequencies among calculation and experiment. And Fig. 5 gives some orders of vibration modals. Under the approximate vibration modals, the absolute value of frequency error is under 10 % and 8 %, and the average error is only 5.12 % and 4.60 %, respectively for the rotor and casing. For the rotor, the frequency at fourth modal is closest to the experiment, with an error of 1.12 %, while the fifth modal is most deviating from the experiment, with an error of 9.46 %. The first modal is characterized by swinging around axis as a whole. The outer edge of impeller deforms alternately with 90 degrees and 60 degrees, respectively for the fourth and fifth modal. For the casing, the minimum error is 1.31 % at third modal, and the largest error is 7.57 % at sixth modal. The suspension twists around axis at second modal. At third modal, the discharge flange swings on - plane and the suction flange swings in an oblique 45° direction. At sixth modal, the left and right support foots swing around axis. All these indicate the modal calculated is in good agreement with that of the experiment, suggesting that the dynamic characteristics of actual structure can be perfectly reflected by the finite element model established.
Table 2Comparison of free modal frequency
Order | Frequency/Hz | Error / % | Damping ratio / % | ||
Experiment | FEM | ||||
Rotor | 1 | 263.05 | 253.33 | –3.70 | 1.03 |
2 | 464.62 | 497.71 | 7.12 | 1.18 | |
3 | 575.98 | 582.88 | 1.20 | 2.67 | |
4 | 576.98 | 583.45 | 1.12 | 1.23 | |
5 | 807.60 | 884 | 9.46 | 0.78 | |
6 | 908.90 | 982.6 | 8.11 | 1.73 | |
Casing [22] | 1 | 285.62 | 265.84 | –6.93 | 1.62 |
2 | 618.65 | 638.84 | 3.26 | 0.70 | |
3 | 864.23 | 875.59 | 1.31 | 0.30 | |
4 | 1010.0 | 946.66 | -6.27 | 0.68 | |
5 | 1050.0 | 1073.9 | 2.28 | 0.28 | |
6 | 1110.0 | 1194 | 7.57 | 0.26 | |
In real work, the rotor system was directly connected to the dynamometer, the casing was fixed on the foundation by foundation screw, and the inlet and outlet of PAT were fixed at the corresponding pipeline. So, plane constraints were imposed at the bearing of rotor system. Six direction constraints were placed on the contact between the casing and foundation. The inlet pipe was confined up-down displacement, and the draft tube was confined the axial displacement. Table 3 lists the top seven constraint modal frequencies of rotor and casing. For the rotor system, the natural frequency under constraint is greater than APF (25Hz), avoiding the possibility of resonance. The flow-induced structure noise excited by the impeller rotating dipole source can be ignored.
Table 3Constraint modal frequencies of rotor and casing
Model | Frequency (Hz) | ||||||
1 | 2 | 3 | 4 | 5 | 6 | 7 | |
Rotor | 336.99 | 583.45 | 860.95 | 1222.6 | 1372.1 | 1682.3 | 1783.7 |
Casing | 311.10 | 416.83 | 762.87 | 886.73 | 1363.75 | 1603.67 | 1715.77 |
Fig. 5Comparison of free vibration modal for the rotor and casing
a) Third order
b) Fourth order
c) Fifth order
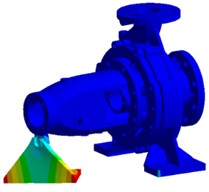
d) Second order [22]
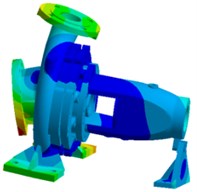
e) Third order [22]
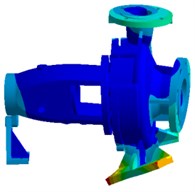
f) Sixth order [22]
4. Results and discussions
4.1. Comparison of flow-borne noise due to different dipole sources
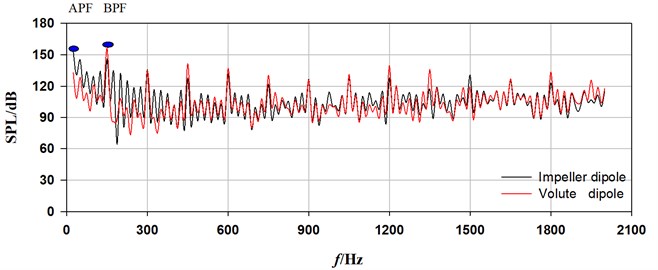
The sound pressure spectrum curves obtained by BEM at monitoring points for design flow rate (90 m3/h) were compared, as shown in Fig. 6. More obvious harmonic characteristic can be observed for sound pressure radiated from casing source. The impeller source shows stronger sound pressure within the frequency range of 300 Hz. While, the higher sound pressure has been obtained from impeller source during other frequencies, especially at inlet pipe.
Fig. 7 and 8 give a comparison of sound pressure distributions in interior noise due to impeller and casing dipole sources. For impeller source, the highest sound pressure inside the casing surface is 181dB at APF (25 Hz), and the sound pressure reduces gradually with the increase of frequency order. At APF, the highest sound pressure can be found on the surfaces of the cover and draft tube. While most of sound energy is concentrate on the walls of casing at BPF and its second harmonic. As for casing source, the sound pressure with highest pressure can be observed, which is 167 dB at BPF (150 Hz), and the smallest pressure has been obtained at APF. At APF, higher sound pressure is located on the surfaces of draft tube, and the smallest pressure is on the most surfaces of casing. At BPF and its second harmonic, most of sound energy is concentrate on the walls of casing and draft tube. Comparing Fig. 14 with 15, the impeller source can be considered the main source at APF. While at BPF and its harmonics, main source comes from the casing source.
Fig. 6Sound pressure spectrum curves due to dipole sources (Q= 90 m3/h)
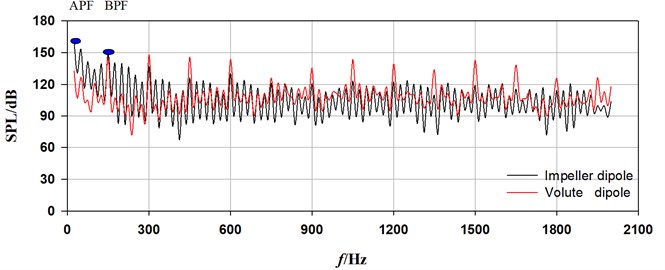
a) Inlet pipe
b) Draft tube
Fig. 7Sound pressure in interior noise due to impeller dipole sources (Q= 90 m3/h)
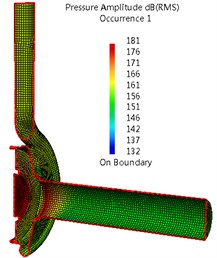
a) APF
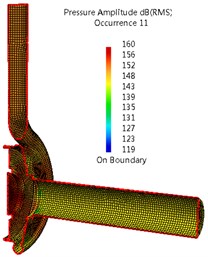
b) BPF
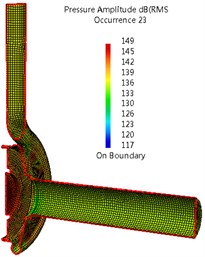
c) Second order BPF
Fig. 8Sound pressure in interior noise due to casing dipole sources (Q= 90 m3/h)
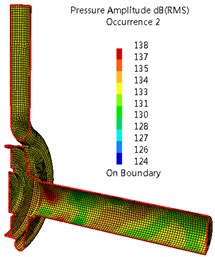
a) APF
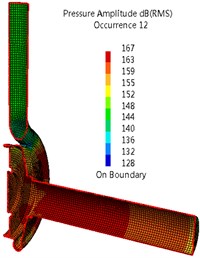
b) BPF
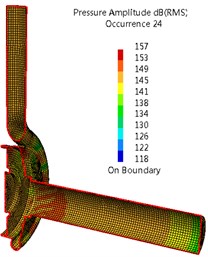
c) Second order BPF
4.2. Comparison of flow-induced noise due to casing source
Fig. 9 shows a comparison of spectrum curves of flow-induced noise at draft tube for three typical flow rates. As it can be seen from the figure, the sound pressure of flow-borne noise due to casing source is highest at BPF, with a sound pressure level (SPL) of 156.4 dB. Several other obvious peak values occur at its harmonic frequencies. Within the range of 150 Hz, the SPLs at broadband noise show higher. From Fig. 9 and Table 3, we can see as for flow-induced structure noise, the highest SPL is 116.5 dB at second BPF, not BPF. This is mainly because the vibration response is easily induced when the frequency is close to the first order natural frequency of structure. There has been an increase in SPL above 1200 Hz. By contrast, the SPL of flow-induced structure noise under certain frequency is lower than that of flow-borne noise. The biggest decline is 55.0 dB at BPF, and the smallest decline of 0.6 dB appears at tenth BPF. It can be inferred that the flow-induced structure noise is not the main factor of interior noise in PAT. The flow-borne noise considering structure shows nearly the same trend of spectrum curve with flow-borne noise. What is different, however, is that there is a slight increase and decrease of SPL, respectively at second BPF and other discrete and broadband frequencies. The sound energy is decreased mainly due to the dissipation by casing vibration, while the sound pressure at the second BPF under resonance excitation is enhanced.
Fig. 9Sound pressure spectrum curves due tocasing source at draft tube
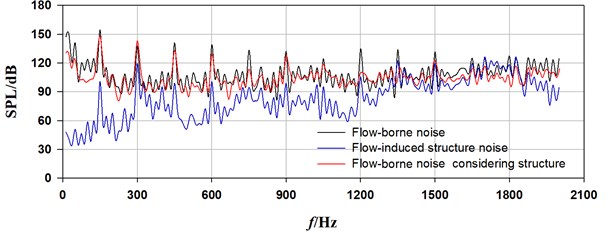
a) 80 m3/h
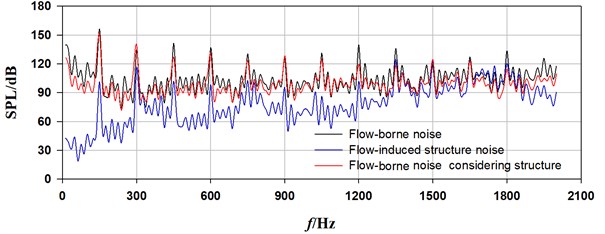
b) 90 m3/h
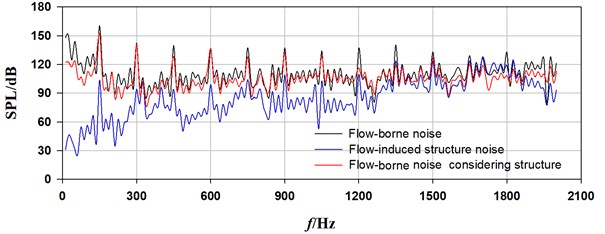
c) 110 m3/h
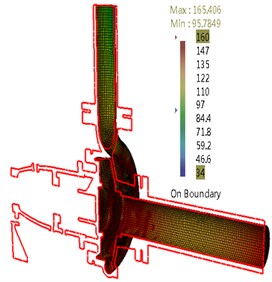
The sound pressure distribution on casing surface for flow-borne noise considering structure at BPF is shown in Fig. 10. It can be found there is a strong ability of noise radiation at the surface of tongue. Compared with the inlet pipe and tongue, the SPL at draft tube is larger. With increasing flow rate, the noise is radiated from a larger area of casing and draft tube with enhancing amplitude.
Fig. 10Sound pressure for flow-borne noise considering structure at BPF
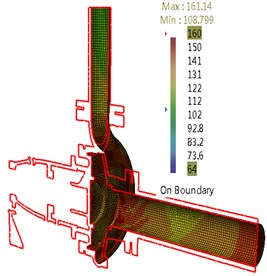
a) 80 m3/h
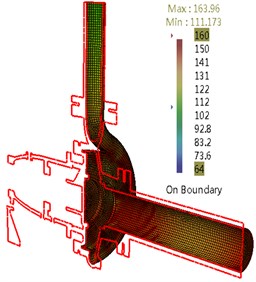
b) 90 m3/h
c) 110 m3/h
4.3. Comparison of calculation and experiment
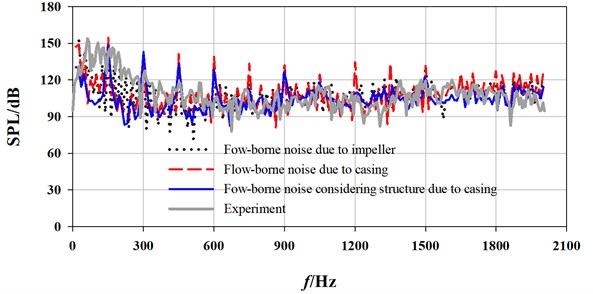
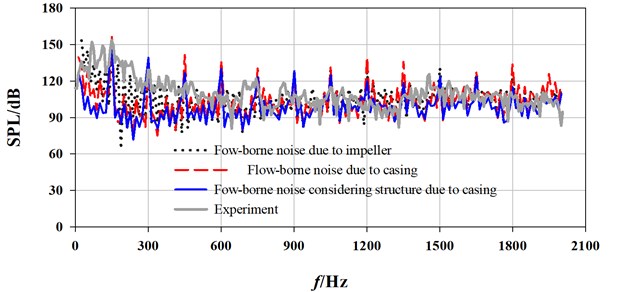
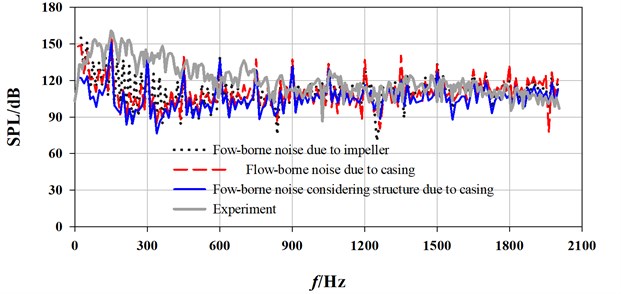
The numerical and experimental spectrum curves of different interior noises are demonstrated in Fig. 11 in terms of flow rate. The spectrum curves due to flow-borne noise considering structure generated by casing source show a similar trend with those of experiment, especially at a flow rate larger than 90 m3/h. Within the range below 450 Hz, larger differences at broadband exist, and the experimental value is higher than calculated value on the whole.
As shown in [22], at APF, the interior noise is dominated by impeller source, but with bigger difference with the experiment. The minimum error is 12.6 % at 90 m3/h and the maximum error is 15.9 % at 110 m3/h. At BPF and its harmonics, the interior noise is basically determined by casing source, with relatively smaller errors at optimal and large flow rates. At BPF and its harmonics under these flow rates, the biggest error of flow-borne noise from casing source is only 9.3 %, and the minimum error is –0.9 %. As for flow-borne noise considering structure due to casing, the maximum error is 5.9 %, the minimum error is 0.4 % and the average error is only 3.25 %. All these illustrate that the flow-borne noise considering structure due to casing source can reflect joint action of multiple sources with better accuracy. And, it is quantitatively feasible to predict interior flow-induced noise induced only by casing source through FEM/BEM.
5. Conclusions
The flow-borne noises due to impeller and casing were solved by BEM and the coupled FEM/BEM was used to calculate flow-induced structure noise due to casing. Based on these, their contribution to the total interior noise was distinguished. Because the natural frequency of rotor under constraint is larger than APF, the flow-induced structure noise due to impeller can be ignored. At APF and broadband below 300 Hz, the sound pressure from flow-borne noise due to impeller is higher. And within the range from 300 to 2000 Hz, the flow-borne noise due to casing is highest, while that of flow-induced structure noise is smallest. For flow-induced interior noise, the flow-borne noise is main source.
Fig. 11Comparison of spectrum curves between calculation and experiment at draft tube
a) 80 m3/h
b) 90 m3/h
c) 110 m3/h
A calculating method of flow-borne noise considering structure for expressing the combined effect of the two kinds of flow-induced noises was proposed. Unlike the simulation of flow-induced structure noise, the pressure fluctuation was interpolated on the casing surfaces of interior acoustic model, not structure. The flow-borne noise considering structure shows nearly the same trend of spectrum curve with flow-borne noise, with more calculation accuracy compared with the experiment.
References
-
Thoma D., Kittredge C. P. Centrifugal pumps operated under abnormal conditions. Power, Vol. 73, 1931, p. 881-884.
-
Nautiyal H., Anoop Kumar V. Reverse running pumps analytical, experimental and computational study: a review. Renewable and Sustainable Energy Reviews, Vol. 14, Issue 7, 2010, p. 2059-2067.
-
Derakhshan S., Nourbakhsh A. Experimental study of characteristic curves of centrifugal pumps working as turbines in different specific speeds. Experimental Thermal and Fluid Science, Vol. 32, 2008, p. 800-807.
-
Derakhshan S., Nourbakhsh A. Theoretical, numerical and experimental investigation of centrifugal pumps in reverse operation. Experimental Thermal and Fluid Science, Vol. 32, Issue 3, 2008, p. 1620-1627.
-
Singh P., Nestmann F. An optimization routine on a prediction and selection model for the turbine operation of centrifugal pumps. Experimental Thermal and Fluid Science, Vol. 34, 2010, p. 152-164.
-
Yang S.-S., Derakhshan S., Kong F.-Y. Theoretical, numerical and experimental prediction of pump as turbine performance. Renewable Energy, Vol. 48, 2012, p. 507-513.
-
Derakhshan S., Mohammadi B., Nourbakhsh A. Efficiency improvement of centrifugal reverse pumps. Journal of Fluids Engineering, Vol. 131, Issue 2, 2009, p. 021103.
-
Singh P., Nestmann F. Experimental investigation of the influence of blade height and blade number on the performance of low head axial flow turbines. Renewable Energy, Vol. 36, Issue 1, 2011, p. 272-281.
-
Singh P., Nestmann F. Internal hydraulic analysis of impeller rounding in centrifugal pumps as turbines. Experimental Thermal and Fluid Science, Vol. 35, Issue 1, 2011, p. 121-134.
-
Yang S.-S., Kong F.-Y., Chen H., et al. Effects of blade wrap angle influencing a pump as turbine. Journal of Fluids Engineering, Vol. 134, 2012, p. 61102.
-
Yang S.-S., Kong F.-Y., Jiang W.-M., et al. Effects of impeller trimming influencing pump as turbine. Computers and Fluids, Vol. 67, 2012, p. 72-78.
-
Yang S.-S., Kong F.-Y., Fu H., et al. Numerical research on effects of splitter blades to the influence of pump as turbine. International Journal of Rotating Machinery, 2012, p. 123093.
-
Dai C. Flow-Induced Noise Characteristics for Centrifugal Pump as Turbine: Theoretical, Numerical and Experimental Investigations. Jiangsu University, Zhenjiang, China, 2014.
-
Choi S., Mclaughlin D. K., Thompson D. E. Experiments on the unsteady flow field and noise generation in a centrifugal pump impeller. Journal of Sound and Vibration, Vol. 263, Issue 3, 2003, p. 493-514.
-
Silja C., Wulkau M. Hybrid numerical simulation of flow-induced radiation of air suction structures lined with porous material. Proceedings of the 11th Pan-American Congress of Applied Mechanics, Iguacu, Brazil, 2010.
-
Christopher K. W. Computational aero-acoustics: issues and methods. AIAA Journal, Vol. 33, Issue 10, 1995, p. 1788-1796.
-
Oberai A., Roknaldin F., Hughes T. R. Computation of trailing edge noise due to turbulent flow over an airfoil. AIAA Journal, Vol. 40, Issue 11, 2002, p. 2206-16.
-
Seola H., Suhb C., Leec S. Development of hybrid method for the prediction of underwater propeller noise. Journal of Sound and Vibration, Vol. 288, Issue 1, 2, p. 345-360.
-
Kato C., Yoshimura S., Yamade Y., et al. Prediction of the noise from a multi-stage centrifugal pump. ASME 2005 Fluids Engineering Division Summer Meeting, Houston, USA, 2005.
-
Jiang Y. Y., Yoshimura S., Imai R., et al. Quantitative evaluation of flow-induced structural vibration and noise in turbomachinery by full-scale weakly coupled simulation. Journal of Fluids and Structures, Vol. 23, Issue 4, 2007, p. 531-544.
-
Kato C., Yamade Y., Wang H., et al. Numerical prediction of sound generated from flows with a low Mach number. Computers and Fluids, Vol. 36, Issue 1, 2007, p. 53-68.
-
Dai C., Dong L., Xia B., et al. Noise reduction in centrifugal pump as turbine: influence of leaning blade or tongue. Journal of Vibroengineering, Vol. 18, Issue 4, 2016, p. 2667-2682.
-
Feng T., Liu K., L X. H. Development of the experimental system for measuring the hydrodynamic noise in centrifugal pump. Fluid Machinery, Vol. 33, Issue 4, 2005, p. 27-30.
-
Dai C., Kong F. Y., Dong L. Pressure fluctuation and its influencing factor analysis in circulating water pump. Journal of Central South University, Vol. 20, Issue 1, 2013, p. 149-155.
Cited by
About this article
This work was supported by National Natural Science Foundation of China (No. 51509111, 51309119), China Postdoctoral Science Foundation (2015M581734), a project funded by the Priority Academic Program Development of Jiangsu Higher Education Institutions (PAPD), the Advanced Talent Foundation of Jiangsu University (12DG082, 15DG052), the Open Research Subject of Key Laboratory of Fluid and Power Machinery, Ministry of Education, Xihua University (szjj2015-017), Sichuan Provincial Key Lab of Process Equipment and Control (GK201403), and Major Science and Technology Projects of Zhejiang Province (2014C01004-1).

