Abstract
The article reviews the problems arising during the development of the stand for dynamic tests of technical products in the mode of amplitude-frequency modulation with hydrostatic vibratory drive. It is possible to control the change of the modulating function law and get various spectrograms of the oscillatory process and the oscillation mode with amplitude-frequency modulation, which allows to achieve the maximum effect of vibration tests in the stand.
1. Introduction
The negative effect of vibration on the technical devices and the objects of ground transportation and technological devises and equipment (flight computers, pneumatic valves, hydraulic valves, electronic devices, radio-relay devices and other mechanical and electrical devices) is due to the occurrence of resonance phenomena in the devices elements and dynamic loads which causes the failure at standard operation (vibrostability loss) and mechanical failure of the constructional parts (vibration resistance loss) [1, 2].
There is one of the most effective vibration test and vibration resistance test for such products that is a method when oscillation superpositioned with the amplitude-frequency modulation during the process of vibratory and dynamic action amplitude and forcing frequency is changed simultaneously and continuously in a pre-given range [1-3].
The method provides the simulation of hard harmonic vibratory actions the most often used for road construction, earthmoving and lifting equipment processes. The method can be implemented by electrodynamic vibration exciters with a set of a number of main oscillators of sinusoidal signals [1, 4], synthesizing frequency modulated and spectrally rich variations. These systems are multi-operated, but are extremely complex and have a low lifting capacity compared to the hydrostatic vibration stand [1, 2].
The purpose of research is to test the properties of the test stand with hydrostatic excitation of oscillations and the synthesis of oscillations with the amplitude-frequency modulation.
2. Theoretical research
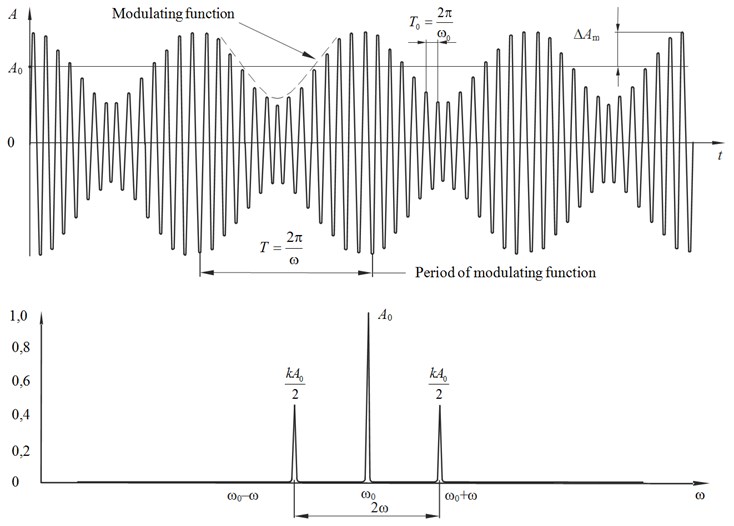
Amplitude modulation (АМ) of harmonic vibrations involves amplitude deformation by modulating function (envelope amplitude) which is the tonal harmonic (Fig. 1) in the simplest case.
In the radio systems an amplitude modulation of harmonic vibration is the carrier of the transmitted signal (message). The same valid signals applied to the vibration test technology. The signal consists of a large number of harmonics, transmitted to the testing device for obtaining feedback in the form of resonances of some of its elements.
The signal with harmonically modulated amplitude can be expressed by a temporal function:
where ω0 – carrier frequency, θ0 – start phase angle.
The pattern of modulating function A(t) Eq. (1) defines the set and the size of the synthesized harmonics. In case of tone-modulated signal, being that of shown (Fig. 1):
its amplitude equals to ΔAm.
The ratio equals to:
where A0 – amplitude average value is called the modulation degree.
Fig. 1Oscillations modulated by the harmonic function
Thus, the expression:
gives an instantaneous value of modulated oscillation.
For harmonic (tone) modulation, when the envelope is represented by the Eq. (2), the Eq. (3) can be reduced to form [5]:
+0,5kA0cos[(ω0–
The first term on the right side of the expression is the original non-modulated oscillation with the carrier frequency . The second and third terms stand for the new oscillation (harmonic), appear during the amplitude modulation. The frequencies of these oscillations and are called the upper and lower side modulation frequencies.
The spectrum of the resulting function Eq. (4) is shown in Fig. 1. The width of the spectrum in this case is equal to doubled frequency modulation 2, and the oscillation amplitude of side frequencies cannot exceed a half of the modulated oscillation amplitude (when 1).
If the modulating function is not tonal and carries a number of harmonics then the spectrum pattern does not change radically but each component of the spectrum gives a pair of side frequencies [5, 6]. As a result, the spectrum is formed. It consists of two bands which are symmetrical about the carrier frequency , and the increasing number of harmonics in the spectrum, decreases the value of the modulation degree per each component (Fig. 2).
Fig. 2The AFC spectrum at complex AM-function

AM-oscillation mode synthesizes line spectrum with a high level of carrier energy and side harmonics, but the natural frequencies of the tested product components can be in the intervals between harmonics and natural frequencies and do not produce any resonance reaction. To solve the difficulty and to make tests the most efficient, it is necessary to specify the fluctuation to the carrier frequency in the range which intercepts adjacent frequencies of line spectrum. This process is provided by the amplitude-frequency modulation oscillation regime (Fig. 2). But now the spectrum is continuous, it is characterized by oscillation spectral density and is recognized in coordinate systems [5].
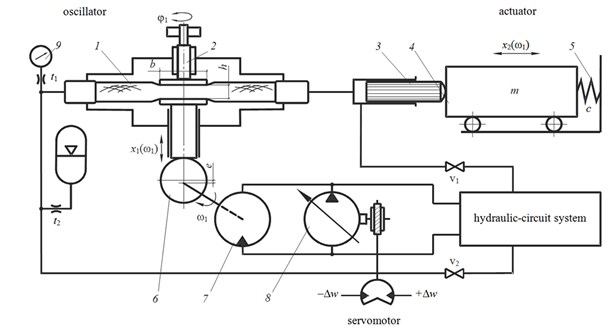
The amplitude-modulated oscillation with a complex harmonic composition can be obtained on the test stand with a hydrostatic nonlinear generator of excitation signal (Fig. 3).
The vibration test stand includes a hydrostatic vibration generator, where the elastic shell 1 (high pressure hose HPH) operates as hydraulic liquid displacer. The vibration test stand is provided with a preload shell regulator on the length of . The shell is connected with a one-way hydraulic cylinder 3, with the plunger pressed to the platform 4 mass , and a spring-actuated by the restoring spring 5.
The throttles and are installed in the hydraulic system of the test stand. The throttles prevent pressure pulsation in a pressure gauge 9 and hydro-pneumatic accumulator, providing compensation of the leaks in the system. The bleeding hydraulic liquid is air free and is carried out by the valves and .
The eccentric shaft 6 is connected with the hydraulic motor 7 and when it rotates the hydraulic piston reciprocates fastening and unfastening the shell 1 and displacing an alternating flow of hydraulic liquid into the hydrocylinder 3. In such a way the test platform 4 of the dynamic test stand oscillations are exited.
The law of displacement of the hydraulic liquid from the envelope is described by a quadratic function [7]:
where and– geometrical constants of the shell, equals:
Fig. 3Basic diagram of the test stand with a hydrostatic nonlinear generator of excitation signal
The parameter limits variations have structural constraints:
where and – outer and inner diameter of the shell, – generator shaft concentricity.
The dynamic structure of the oscillatory system in question can be represented by the scheme (Fig. 4). Volumetric difference forms the deformation volume of the shell cavity that is caused by the dynamic pressure in the oscillation circuit “shell – hydrocylinder – test platform”. The dynamic pressure varies nonlinearly, in accordance with the volume elastic characteristic of the shell [7]:
where (N/m5) and (N/m8) – empirical coefficients.
Nonlinear function Eq. (8) leads to the formation of nonlinear elastic connection:
where – surface area of the hydrocylinder piston, – volumetric stiffness of the shell which is under initial pressure at initial volumetric deformation , and equals:
The determining factor in the formation of a “soft” amplitude-frequency characteristic (AFC) with a left angle (Fig. 5) is a unidirectional exciting circuit of oscillations, when in the resonant mode the amplitude increases and the test platform with a hydrocylinder plunger detach from the oscillating circuit and the pressure in it falls below up to atmospheric pressure .
In this temporal segment, (“pause” time ) the spring stiffness activates for a short time in the system. So the circuit separated and the position of the switch (circuit selector valve) CSV1 – “open” position and CSV2 switch – “closed” correspondingly.
Fig. 4Block scheme of the test stand with a hydrostatic nonlinear generator of excitation signal
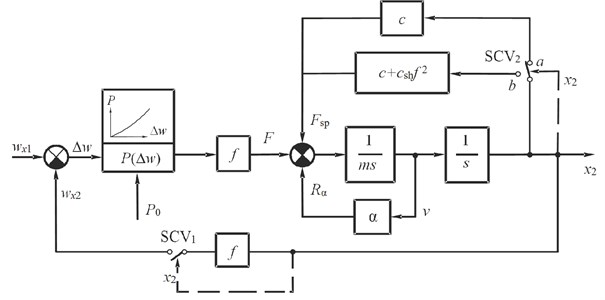
Fig. 5AFC of the test stand
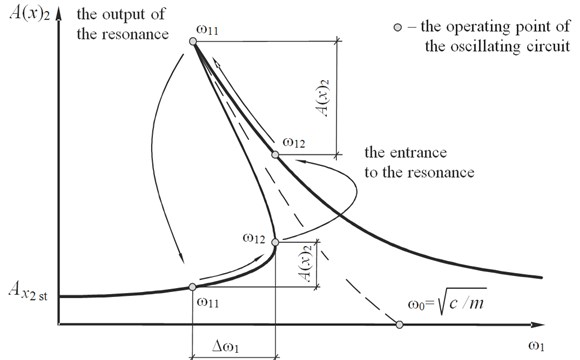
While rising resonance, the amplitude is increased by (Fig. 5), then pause time prolongs and the resonance input in one oscillation period increases too. The average integral value of the stiffness Eq. (9) reduces and the natural frequency of the system equals:
where the coefficients and equals:
where – the total weight of the platform and the tested product.
Inherent frequency of the system is indicated in the graphic chart by a dotted “backbone curve”. It is in angle left position. Thus, the inherent frequency of the oscillating circuit depends on the amplitude and the system has a variable structure (Fig. 4).
If the “backbone curve” is known the amplitude in the resonance can be expressed in terms of the quality factor of the system :
where – static amplitude at 0, equals:
Resonant mode of the amplitude is given by:
where – coefficient of the of relative damping oscillation:
where – viscous friction coefficient (N·sm/m).
There is – input action or the law of generator piston motion (Fig. 3):
– output action (test platform oscillations).
Inherent frequency of the oscillating circuit is moved Eq. (11) in a given frequency range (Fig. 5) and is carried out by the initial pressure in the system .
3. Experimental research
Fig. 6 shows the experimental logarithmic amplitude-frequency characteristics (AFC) received on a physical model of the vibration stand with the following design parameters (Fig. 3):
• inner diameter of the shell 0,025 m;
• plungers diameter – 0,02 m (2 pieces);
• other parameters: 0,07 m, 40 kg, 33100 N/m, 0,03…0,036 m, 1,25·10-3 m.
Fig. 6Experimental logarithmic amplitude-frequency characteristics of the vibration stand
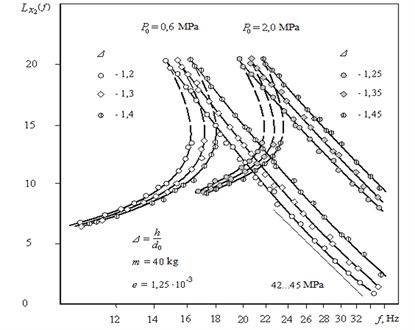
The character of the logarithmic amplitude-frequency characteristics curves is fully corresponds with the graphic chart shown in Fig. 5.
Dotted lines of the logarithmic amplitude-frequency characteristics indicate the unrealizable areas of the characteristics.
The quality factor of the system is independent of the relative preload and the initial pressure .
So when 0,6 MPa, the quality factor is estimated by value 20 ... 20.5 dB, but when 2,0 MPa the quality factor is growing to only 20,5 ... 21 dB.
But this is due to:
• moving out of the plunger from the cylinder when the pressure increases;
• reducing the contact area of the cylinder and the plunger;
• reducing the coefficient of viscous friction.
The slope of the high-frequency asymptotes of the logarithmic amplitude frequency characteristics for all values of the initial pressure and the relative preload is approximately 42...45 dB/decade. It is specific for non-linear systems of the second order and corresponds to the block diagram (Fig. 4).
Experimental logarithmic amplitude frequency characteristics indicate the extra settings possibility for the natural frequency of the oscillating system changing the shell preload .
Due to the “soft” AFC in the oscillating circuit of vibration stand the platform oscillations in the amplitude frequency modulation mode can be obtained [8, 9].
Servomotor of the vibration stand (Fig. 3) serves to control the amount of liquid – and +. Servomotor is connected to the mechanical transmission and to the drag link of the swash plate of controlled axial piston pump 8, that provides a change of working volume in the range from to . This change is equivalent to a change in the feed from to , accordingly, and the angular speed change of hydromotor 7 in the range of ,…, . Thus, the carrier frequency is not a constant.
At a certain sweep velocity of an exciting frequency the modal point will move on AFC graphic chart from till with the gradual increase of the oscillations amplitude . Fig. 7 shows the temporal sweep of the oscillation process, this transition process corresponds to the time and the amplitude increment (Fig. 5).
At the point with the angular frequency on the lower branch of the AFC, the system is not stable. The AFC function is discontinuous and the oscillation circuit immediately transforms to another (stable) state corresponding to the resonant mode.
Fig. 7Oscillations modulated by the jump nonlinear function
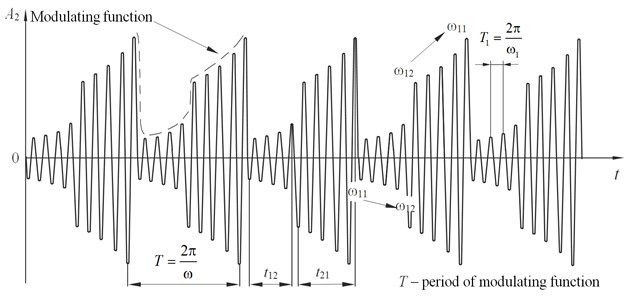
Immediately after the transformation, the drive starts to decrease the excitation frequency from to , bringing the oscillating circuit to the mode with the maximum amplitude . Time (Fig. 7) and much more increment (Fig. 5) corresponds to the transformation process.
Thus, the shape of the modulating AM oscillations is determined by the transformation process time and and the shape of the AFC system at the segments corresponds to the interval (Fig. 5).
By changing the time and and the nature of the modal point dynamic at these time intervals (according to the sine law, linear law, etc.) it is possible to control the change of the modulating function law (Fig. 7) and get various spectrograms of the oscillatory process.
As the cyclic transformations from one transformation process to and vice versa are accompanied by the change of the carrier frequency excitation , then after all we get the oscillation mode with amplitude-frequency modulation, which allows to achieve the maximum effect of vibration tests, realizing the constant oscillatory spectrum with the width (Fig. 5). This process is completely identical to the amplitude frequency modulation [18].
4. Conclusions
The AFC spectrum is implemented by means of the hydraulic drive test stand with a nonlinear hydrostatic generator and is an adequate oscillation process that simulates the transport vibration and the vibration of power-units of land transport and technological machinery and equipment. Therefore, this test stand with hydrostatic excitation of the mechanical oscillations can be used to test various objects for vibrostability and vibration resistance.
References
-
Kljuev V. V. Test Engineering. Mashinostroeniye, Moscow, 1982, (in Russian).
-
Kljuev V. V. Devices and Systems for Measuring Vibration, Noise and Shock. Book 2. Мashinostroenie, Moscow, 1978, (in Russian).
-
Groves R. L., Pipho G. A. Test Stand for Testing Hydraulic Devices. United States Patent 4368638, 1983.
-
Wan D. T., Bao Y. W., Tian Y., Liu Z., Qiu Y. Design and application of testing equipment for determining the mechanical properties of ceramics at ultrahigh temperatures. Key Engineering Materials, Vol. 680, 2016, p. 3-8.
-
Solodovnikov V. V. Technique Cybernetics. Аutomatic Control Theory. Mashinostroeniye, Moscow, 1967, (in Russian).
-
Goinaraghi F., Kuo В. C. Automatic Control Systems. Wiley Online Library, 2010.
-
Nizhegorodov A. I. Hydro-volume vibratory drive of testing stand for amplitude-modulated vibration excitation. Stroitel’nye i Dorozhnye Mashiny, Vol. 5, 2014, p. 30-33, (in Russian).
-
Nizhegorodov A. I., Gavrilin A. N., Moyzes B. B. Hydrostatic vibratory drive of the test stand for excitation of the amplitude-modulated vibrations. Journal of Physics: Conference Series, Vol. 671, 2016, p. 012037.
-
Minorsky N. Non-linear Oscillation. D. Van Nostrand Company, New York, 1962.
Cited by
About this article
Anatolij Nizhegorodov – the general management of research and development works. The Design of experimental stand. The development of the experimental design. Mathematical model development. Alexey Gavrilin – designing and supervising the of experimental stand making. The development of the experimental design. Conducting experiments. Boris Moyzes – the development and testing of mathematical model. Ivan Ditenberg – strength calculations and mathematical model testing. Olga Zharkevich – information search and rationale for scientific relevance of research. Gulnara Zhetessova – rationale for scientific relevance of research. Oleg Muravyov – the processing of experimental data. Mikhail Bets – the processing of experimental data.
