Abstract
Feature extraction plays an important role in machinery fault diagnosis and prognosis. The features extracted from time, frequency and time-frequency domains are widely investigated to describe the properties of overall signal from different perspectives (e.g. RMS, energy, etc.), seldom considering the sequential pattern of time-series signal in which the fault information may be embedded. This paper contributes a novel approach based on Symbolic Aggregate approXimation (SAX) framework and bitmap technology to extract fault information by analyzing sequential pattern in time-series signal for fault diagnosis. In the proposed method, SAX and bitmap are subtly combined. SAX technique reduces the dimensionality of raw data by transforming the original real valued time series into a discrete one. Fault features are extracted with bitmap representation by a simple histogram form summarizing the occurrence of the chosen symbols words, in which signal timing change character is investigated. Compared with the commonly used methods, the proposed approach has high computation efficiency and feature extraction accuracy. Experimental studies on reciprocating compressor valve demonstrate that the presented approach outperforms the methods of SAX-entropy and EMD-energy-entropy using support vector machine for classification.
1. Introduction
Modern manufacturing aiming to achieve higher productivity, better quality, and increased flexibility is highly dependent on fault-free operations of various components in manufacturing machines [1-3], which requires timely condition monitoring and diagnosis of the working status of vital machine components [4]. Intelligent fault diagnosis methods, as a diagnosis technology that can effectively analyze massive data and automatically provide accurate diagnosis results, have been a hot research in recent years. At present, various intelligent fault diagnosis methods, such as expert system [5, 6], support vector machine [7, 8], neural network [9-11], fuzzy logic [12, 13], rough set [14, 15], and their hybrid method [16, 17], have been successfully applied to distinguish machinery health conditions.
Generally, intelligent fault diagnosis follows a roadmap of data acquisition, feature extraction, fault classification and diagnostic decision making, in which feature extraction is a crucial step that can influence the performance of classifier. Vibration signal is the most commonly used for fault diagnosis, which is easy to reflect signal changes caused by fault components. However, the raw data acquired from sensors is too high in dimensionality to be efficiently computed and sampled in a dynamic environment where various factors concur, such as noise and signal modulation effect, which will cause information redundancy [18]. Hence, effective techniques to reduce dimensionality of vibration signal and extract features become highly desirable.
Various feature extraction techniques have been introduced for machinery fault diagnosis and can be categorized in three domains, including time domain, frequency domain and time-frequency domain. Time domain methods [19] include peak amplitude, root mean square (RMS), crest factor, kurtosis and shock pulse counting, while Fourier transform, spectrum analysis, and the envelope spectra technique [20] belong to frequency domain methods. Time-frequency domain methods can characterize varying frequency information at different time with the advantages of dealing with non-stationary signals. So during the past several decades, a significant amount of research has been undertaken in this domain. Commonly used time-frequency analysis methods include short-time Fourier transform (STFT), wavelet transform (WT) and empirical mode decomposition (EMD). The basic idea of STFT is windowing and performing Fourier transformation of windowed signals. Hence, it is possible to express the frequency spectrum property of the time interval using the signal within this interval. For instance, Walker et al. [21] applied short-time Fourier transform combining with butterworth filter to the localization of unbalance fault in rotating machinery; Xie et al. [22] established a new adaptive short-time Fourier transform algorithm, which adjusts the window width by adapting to the instantaneous bandwidth at each frequency position. With wavelet transform technique, the signal can be broken into many different frequency bandwidths to extract failure feature from the noise signal. This approach has received widespread attentions in recent years due to its proven advantages. For example, Chen et al. [23] used the discrete wavelet transform for feature extraction with wavelet coefficients as features; Yen et al. [24] applied the wavelet node energy extracted by wavelet packet transform to diagnose the gearbox fault conditions; Wavelet analysis was utilized to predict the location of structural damage in [25]; Zhang et al. [26] proposed a method that combined wavelet analysis and neural network to study face recognition. However, in many cases, the parameters such as wavelet decomposition levels are determined with experience, which will make great subjective influence on results. EMD is a newly developed powerful method for non-linear and non-stationary time series analysis. The signal is decomposed into a set of completed and almost orthogonal components, named as intrinsic mode function (IMF), based on which one can get an elaborate energy-frequency-time distribution of the signal. Ricci et al. [27] proposed a merit index that automatically selects the intrinsic mode functions. The effectiveness of the method was proven by the experimental tests using the merit index for investigating the damaged gearbox; In [28] EMD was applied to the extraction of four features with two specific intrinsic mode functions (IMFs) both from the time and the frequency domain. The features were then fed to an ensemble anomaly detector to detect four different types of faults; In [29] EMD method and autoregressive (AR) model were combined for feature extraction, with which the AR parameters and the remnant’s variances of the AR model for each IMF component were treated as the feature vectors for roller bearings diagnosis.
Unfortunately, all these methods extract features directly based on raw vibration signals. In some cases, the large amounts of raw data make the extracting feature process become ineffective computing. Additionally, the traditional methods extract features based on either several representative points or the overall raw data characteristic, yet these existing methods ignore the signal timing change information in a part of signal sequence which exactly contains important mechanical operation information. Specifically, the indexes, such as crest factor, shock pulse counting and peak amplitude, are based on analyzing several special points in the data for diagnosis, while ignoring the information of other points; The RMS and kurtosis factor require computing based to every point value. Also, the methods based on frequency-domain analysis, (e.g., Fourier transform, spectrum analysis, and the envelope spectra technique) and time-frequency analysis (e.g., short-time Fourier transform, wavelet transform, and EMD) carry out transform regarding the whole data sequence but losing sequential change information. In a word, the traditional methods extract feature regarding either too few special points to gain comprehensive information or the overall data transformation but losing partial information, more important they hardly capture the sequential information in time-series, so the traditional methods extract feature poorly to some extent.
To address the issues, a hybrid approach of SAX [30, 31] and bitmap technology is proposed for the analysis of vibration signals by mapping them into a discrete symbolic sequence and then extract features by bitmap representation [32]. SAX is a new time series representation effectively addressing the discrete representation problem. It can tremendously reduce the dimensionality of time series to form a new symbolic sequence for computing high-efficiency. The bitmap is originally a visualization tool and further exploited for anomaly detection and classification [30, 32]. In this study, bitmap is used as features extracted from symbolic sequence. By combining SAX and bitmap representation, a novel feature extraction method based on sequential analysis pattern is proposed, which captures the signal timing change character of raw data, in the process a parameter optimization process is investigated. The main merit of the approach lies in acquiring fault information by analyzing the sequential change character in the vibration signal accurately and efficiently through bitmap representation. The experimental studies on reciprocating compressor valves suggest that this new representation is efficient for the condition monitoring and fault identification.
The rest of the paper is organized as follows. The theoretical background of symbolic aggregate approximation and bitmap technology are introduced in Section 2. The proposed scheme is then presented in Section 3. Section 4 presents the effectiveness of the developed method demonstrated in the experimental studies on compressor valve. Finally, the conclusions of this paper are drawn in Section 5.
2. Theoretical framework
2.1. Symbolic aggregate approximation
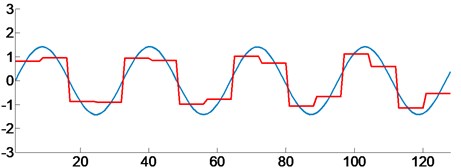
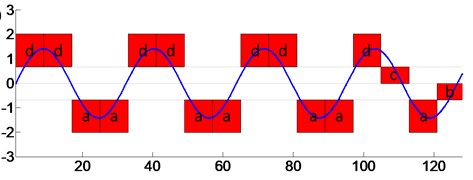
As a symbolic representation of sequential data, SAX has been verified as a simple but effective tool for solving some time series data mining problems, such as clustering, classification, indexing, anomaly detection, and motif finding. SAX transforms a time series S of length n into a string of arbitrary of length w, where w≪n. It operates by using an alphabet a of size a> 2, to produce the string. The algorithm can be decomposed into three main steps. Firstly, the time series is normalized in order to have zero mean and standard deviation of one. Secondly, the signal is divided into equal sized sections and the mean value of each section is calculated. By substituting each section with its mean, a reduced dimensionality process is achieved. This process is known as Piecewise Aggregate Approximation (PAA). Finally, after the time series has been transformed to its PAA representation, a discretization takes place in order to produce a word with approximately equiprobable symbols. For example, as seen in Fig. 1(a), a time series of length n=128 is segmented into a new sequence with w=16 mean values. In Fig. 1(b) the normalized time series is symbolized by four words and the area is divided into four regions in vertical using three breakpoints [33].
Fig. 1The representations of PAA and symbolic representation
a)
b)
2.1.1. Piecewise aggregate approximation
The time series S of length n can be transformed into a new sequence ¯A of length w. PAA means that a time series S={a1,a2,…,an} can be represented by a sequence ¯A={¯a1,¯a2,¯a3,…,¯aw}. An arbitrary element ¯ai∈¯A can be calculated by:
The original time series can be represented by the sequence, of which the element is composed of the mean value of every equal-length segment. In this way, long time series can be transformed into a short sequence and the vector of the mean values becomes the data-reduced representation.
In most cases, time series must be normalized as a new series with a mean of zero and a standard deviation of one before being transformed into the PAA representation. It means that the method can be used to achieve this function. That is:
where B is the normalized series of A, μ is the mean of all the points in A and σ is its standard deviation. After normalization, the different offsets and amplitudes can be neglected when comparing time series.
2.1.2. Discretization
After the time series has been transformed to its PAA approximation, we apply a further transformation to obtain a discrete representation. Having normalized the time series, the new time series will approximately follow a Gaussian distribution and has simply determined “breakpoints” that will produce equal sized areas under a Gaussian curve.
Definition 1. Breakpoints: breakpoints are a sorted list of numbers B=β1,…,βα-1 such that the area under a N(0,1) Gaussian curve from βi to βi+1=1/a (β0 and βa are defined as -∞ and +∞, respectively). These breakpoints may be determined by looking them up in a statistical table. Table 1 gives the breakpoints for values of a from 3 to 8.
Table 1A lookup table containing the breakpoints that divide a Gaussian distribution in an arbitrary number (from 3 to 8) of equiprobable regions
βi | a | |||||
3 | 4 | 5 | 6 | 7 | 8 | |
β1 | –0.43 | –0.67 | –0.84 | –0.97 | –1.07 | –1.15 |
β2 | 0.43 | 0 | –0.25 | –0.43 | –0.57 | –0.67 |
β3 | 0.67 | 0.25 | 0 | 0.18 | –0.32 | |
β4 | 0.84 | 0.43 | 0.18 | 0 | ||
β5 | 0.97 | 0.57 | 0.32 | |||
β6 | 1.07 | 0.67 | ||||
β7 | 1.15 | |||||
Once the breakpoints have been obtained we can discretize a time series in the following manner. We first obtain a PAA of the time series. All PAA coefficients below the smallest breakpoint are mapped to the symbol a; all coefficients greater than or equal to the smallest breakpoint and less than the second smallest breakpoint are mapped to the symbol b, etc.
2.2. Parameters
The SAX algorithm requires two parameters: the word length w and the alphabet size a. For instance, with a= 4, w= 16, the time series is mapped as shown in Fig. 1(b). The larger the value of a and w, the more focus will be on denser division in vertical and transverse direction respectively. On the contrary, the smaller the value of a and w, the more focus will be on sparser division in vertical and transverse direction, respectively. Thus, with different parameter combination, the symbolic sequence differs.
While, the value of parameter a and w is uncertain, with the appropriate parameter combination, the information of time series can be expressed by symbolizing more accurately.
2.3. Bitmap
Bitmap is further introduced to replace the standard file icons with automatically created icons reflecting the contents of the files in a principled way for desktop interfaces [34]. The icons are created by hashing the filenames to seeds of a pseudorandom generator that, in turn, is used to create a shape grammar. In this way, similar filenames will map to similar shapes, and thus allow a user to see at glance when two files are related. It is usually a small image of size 32×32 and in the case that the icon is a sub-sample of the initial image. Thus, the bitmap extracts information from the files, and thus the user can get an idea of what image the file contains simply and quickly.
3. The proposed method
Generally, a bitmap icon reflects the content of the files in the computer system. The basic idea of extracting features from the files, measuring their frequency, and mapping these frequencies to color and spatial arrangements, can be easily applied to other domains. These general principles are familiar to those in the machine learning and visualization communities. Therefore, this paper leverages bitmaps to extract feature from machinery vibration signal for classification/detection purposes. Since the bitmap representation is meant for symbolic series sequence, such as DNA symbolic sequence, the SAX representation is used to symbolize the time series. SAX representation tremendously reduces the dimensionality of the time series data, and thus reduces the strain on the memory space and computational power required, which is the reason we choose the method. The hybrid approach of SAX and bitmap (SAX-bitmap) for machine fault diagnosis is proposed, the flowchart is shown in Fig. 2.
Fig. 2Flowchart of the proposed approach for machinery diagnosis
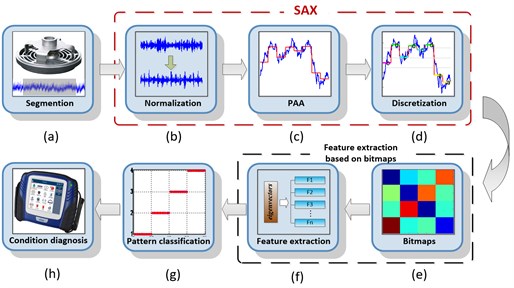
Firstly, the acquired original signal is segmented to obtain multi-group sample data and each segment undergoes SAX analysis to create a symbolic representation of the original signal. Secondly, the symbolic representation is transformed into a feature vector through the application of the bitmap rationale. Finally, the machinery status is assessed according to the analysis results. In addition, parameters selection in the process of SAX is also investigated.
The details of feature extraction by bitmap and parameters selection are discussed as below.
3.1. Feature extraction based on bitmap
Bitmap has represented DNA symbol sequence well for clustering, similarly the idea can be transferred to the representation of a long SAX-based symbol string. The SAX technique used for discretization before creation of bitmaps is to display time series in a more compact form or, more importantly, to be used for improving the operation efficiency in the main memory and is an indispensable procedure before bitmap mapping. Next we focus on how to extract feature by creation of bitmaps and the SAX method has been illustrated in Section 2.1.
Having acquired the symbolic sequence after SAX representation, we can construct a square array simply by counting the frequencies of specific subwords of length L. For concreteness, the icons of the string S= cccbcaccccadbcbcccbcbccba is showed in Fig. 3. We count the frequencies of subwords of size 1 (e.g. a, b, c, etc.) when L= 1 and size 2 (e.g. aa, ba, ca, etc.) when L=2. To generalize this procedure, we count the frequencies of specific subwords of length L.
Fig. 3The intelligent icons of the string S= cccbcaccccadbcbcccbcbccba; the frequencies and the subwords for L= 1, L= 2 and L=n
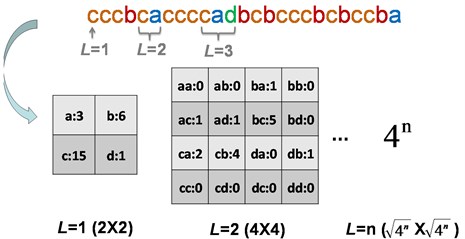
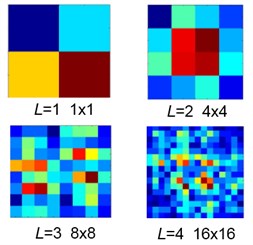
Next, fill in the square array with statistical figures to form a square matrix, normalize the square matrix to intervals 0-1, and map it to color according to the normalized value. Thus, a bitmap representing time sequence information by color is constructed. The bitmaps of the string S at multiple levels (L= 1, 2, 3, and 4) are shown in Fig. 4. Note that the bitmaps display finer as the value L increasing, that is, the larger value of L is, the more information the bitmap represents.
Fig. 4The bitmaps of the string S at multiple levels (L= 1, 2, 3, and 4)
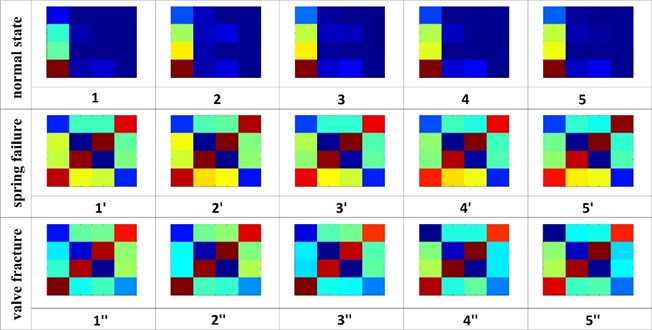
It is clear to tell the difference between bitmaps representation of different original vibration signal. As shown in Fig. 5, there is distinct visual difference between different valve working conditions. However, our work particularly focuses on employing the bitmap representation for the extraction of features rather than for the optical representation of the signal, because we are interested in an automated procedure rather than an alternative visual representation.
Fig. 5The bitmaps for different conditions. Note that the similarity among the bitmaps in one column
There is no convenient way to create a bitmap representation for some combinations of word length w and alphabet size a, because the square array construction is failed. However, we can still count the frequencies of specific subsequences and use them as feature vectors. This is exactly the approach of feature extraction based on bitmap technique as proposed: for each signal after the application of SAX representation, the frequency of occurrences of specific subwords are normalized and stored in a one dimensional vector, which achieves the representation of the original signal into the feature space.
3.2. Parameter selection
There is also other issue to address to use a symbolic representation of time series by SAX. If we wish to approximate a dataset, the parameters w and a have to be chosen in such a way that the approximation represents sequential data as accurately as possible and the difference between datasets is as large as possible. There is a clear tradeoff between the parameter w, controlling the number of approximating elements, and the value a, controlling the granularity of each approximating element. However, it is difficult to determine the best tradeoff, since it is highly data dependent. We can empirically determine the optimal solution with a simple experiment and then analyze the parameters selection based on data theoretically.
We performed a test with four sets of vibration data collected from a valve of a reciprocating compressor under different running state (normal valve, spring failure, spring fracture, and valve wear). Each set of data contains 1,000 samples of length 4,000, in which 500 samples are used to train and the rest of the samples are used for predicting. The prediction classification accuracy obtained by support vector machine classifier is used as index which evaluates the approximation effectiveness. Fig. 6 shows the results.
The larger the value of a, the more alphabets will be used to represent time series. However, if the value of a is too large, the dimension of the eigenvector extracted by bitmaps will be too high, resulting in more memory requirement for the operation and reduced computation efficiency. So the value of a is set in the range of 2 to 12. Similarly, the value of w can be set at any integer theoretically, yet if the value of w is set too large, it leads to low computation efficiency. So we need find a tradeoff between computation efficiency and representation accuracy.
The results suggest that the maximum classification accuracy is 92.41 % with the optimal parameter combination of a= 5 and w= 7. It also indicates that the value of a has little effect on the representation accuracy. In other words, the parameter a is not as critical as expected; an alphabet size in the range of 5 to 8 seems to be a good choice. Since the parameter w is highly data dependent, that is, smaller value of w is more suitable for relatively smooth and slowly varying trajectories of time series; on the contrary, larger value of w is appropriate for fast varying data. So it is necessary to analyze the result based on the test data. Taking above experimental data as an example, the movement frequency of the valve is about 28.67 Hz and the sampling rate is 16 kHz, thus the length of one period of data is about 558. Coincidentally, the vibration data length of 4,000 is segmented into 7 sections, and each section length is about 571. It is very close to the length of one period of the valve data. It suggests that segmenting/determining the parameter w according to the period of time series is a good idea. For further analysis, a period of time series is exactly the smallest unit which contains fault information. If the value of w is too large, that is each segmented section length is shorter than one period of the data, SAX representation is difficult to capture the fault information completely.
To sum up, it is suggested that for the alphabet size parameter a, 5-8 seems reasonable for the task at hand and the word size parameter w is selected in consideration of the period of the test data.
Fig. 6The classification accuracy with a= [2-12] and w= [1-10]
![The classification accuracy with a= [2-12] and w= [1-10]](https://static-01.extrica.com/articles/16903/16903-img7.jpg)
4. Experimental studies
A series of experiments are performed to evaluate the effectiveness of the proposed hybrid approach of SAX and bitmap method. Experimental analysis and results are discussed below.
4.1. Experimental setup
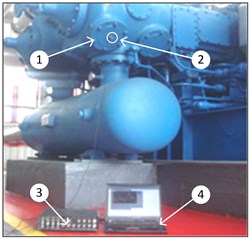
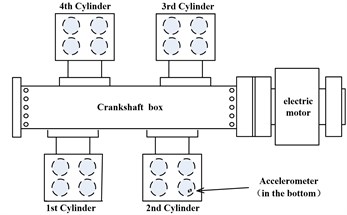
A reciprocating compressor of model WH64 in a petrochemical plant in northwest China is used as the experimental testbed to evaluate the performance of the developed method, as shown in Fig. 7. It is a 4-cylinder natural gas reciprocating compressor driven by an electric motor with rated power of 1,305 kW. The rotating speed of the crankshaft is 993 rpm which drives the plungers to strike 993 times per minute, back and forth. The motion of the plungers changes the volume of the cylinders. When the plunger travels down, the increased volume of cylinder opens the intake valve and closes the exhaust valve. When traveling up, the compression of the cylinder opens the exhaust valve and closes the intake valve. Valve is one of the most frequently moved components and it is susceptible to failure. To diagnose the valve fault, an accelerometer is placed on the exhaust valve lid in the 2nd cylinder. A data acquisition system (model number MDES-5) designed by China University of Petroleum-Beijing as shown in Fig. 7(a) is used for measurements. It consists of a laptop and a data acquisition box configured in a master-slave system. The sampling rate is set as 16 kHz in this study.
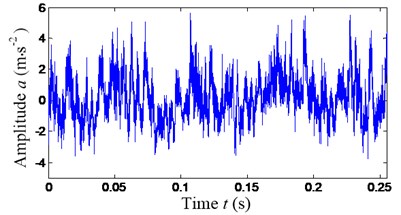
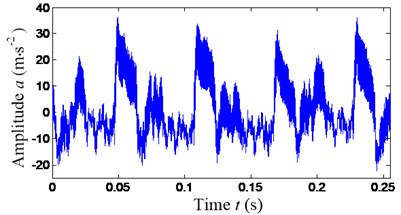
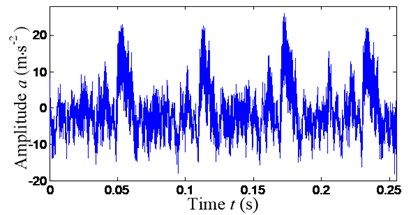
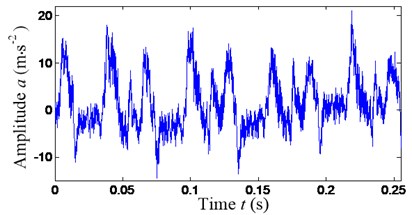
Four data sets of different machinery conditions, including normal state, valve wear, spring fracture and spring failure are acquired respectively and then segmented into samples. Each data set contains 80 samples of length 4,000 in which 40 samples are used to train and the rest of the samples are used for predicting. Some examples of the data are depicted in Fig. 8.
Fig. 7Experimental setup of the reciprocating compressor, a) data acquisition system, (1) exhaust valve, (2) accelerometer on the exhaust valve lid, (3) data acquisition box, (4) control panel, and b) diagram of reciprocating compressor
a)
b)
Fig. 8The time series vibration signal under different machinery conditions: a) normal state, b) valve wear, c) valve fracture, and d) spring failure
a)
b)
c)
d)
4.2. Experimental evaluation
Some examples of the eigenvectors through the proposed method with optimized parameter combination of a= 5, w= 7 and L= 3 are shown in Table 2. To further validate the proposed approach, two other groups of experiments are conducted. As we know, entropy expresses the degree of irregularity of time series and plays a bridging role between signal processing and information theory. Some entropy values are calculated after SAX representation as shown in Table 3. Besides, eigenvectors are extracted by energy-entropy of IMF (Intrinsic Mode Function) based on EMD (Empirical Mode Decomposition) for contrast experiment [35]. Table 4 illustrates some examples of the eigenvectors. The two methods are abbreviated as SAX-entropy and EMD-energy-entropy.
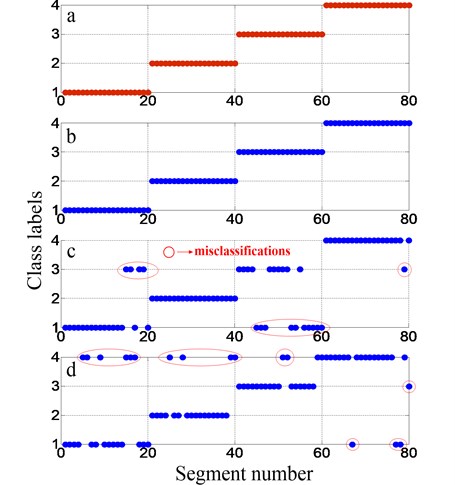
Next, the eigenvectors and eigenvalues are fed into support vector machine for machinery defect classification. The classification results of support vector machine under different running conditions (label 1 for normal state, label 2 for spring failure, label 3for valve fracture, and label 4 for valve wear.) are depicted in Fig. 9. The approach of SAX-bitmaps classifies four running states with a classification accuracy of 100 %, while the accuracies are 81.25 % and 80 % for the SAX-entropy approach and EMD-energy-entropy.
Table 2Eigenvectors of four valve states by SAX-bitmap
Eigenvectors | T1 | T2 | T3 | T4 | T5 | T6 | T7 | T8 | T9 |
Normal state | 1.0000 | 0.2059 | 0.0000 | 0.2043 | 0.7792 | 0.1038 | 0.0000 | 0.1038 | 0.8666 |
1.0000 | 0.2092 | 0.0000 | 0.2092 | 0.7825 | 0.1054 | 0.0000 | 0.1054 | 0.8517 | |
1.0000 | 0.2103 | 0.0000 | 0.2086 | 0.7748 | 0.1026 | 0.0000 | 0.1026 | 0.8808 | |
1.0000 | 0.2132 | 0.0000 | 0.2149 | 0.8223 | 0.1134 | 0.0000 | 0.1151 | 0.8731 | |
1.0000 | 0.2067 | 0.0000 | 0.2067 | 0.7468 | 0.0962 | 0.0000 | 0.0962 | 0.8221 | |
Spring failure | 1.0000 | 0.5599 | 0.0028 | 0.5627 | 0.8301 | 0.3370 | 0.0000 | 0.3370 | 0.7604 |
1.0000 | 0.5738 | 0.0111 | 0.5850 | 0.8524 | 0.3343 | 0.0000 | 0.3454 | 0.7883 | |
1.0000 | 0.6063 | 0.0086 | 0.6178 | 0.8994 | 0.3448 | 0.0000 | 0.3534 | 0.8017 | |
1.0000 | 0.6103 | 0.0029 | 0.6132 | 0.8481 | 0.3381 | 0.0000 | 0.3410 | 0.7880 | |
1.0000 | 0.5618 | 0.0056 | 0.5646 | 0.8511 | 0.3287 | 0.0000 | 0.3315 | 0.7837 | |
Valve fracture | 1.0000 | 0.5589 | 0.0000 | 0.5315 | 0.8274 | 0.3781 | 0.0274 | 0.3479 | 0.6959 |
1.0000 | 0.5695 | 0.0000 | 0.5313 | 0.8338 | 0.4060 | 0.0381 | 0.3706 | 0.6676 | |
1.0000 | 0.5860 | 0.0000 | 0.5306 | 0.8309 | 0.4344 | 0.0554 | 0.3819 | 0.6968 | |
1.0000 | 0.6158 | 0.0000 | 0.5543 | 0.8534 | 0.4340 | 0.0587 | 0.3754 | 0.7038 | |
1.0000 | 0.6195 | 0.0000 | 0.5487 | 0.8643 | 0.4513 | 0.0678 | 0.3835 | 0.7139 | |
Valve wear | 1.0000 | 0.6469 | 0.0000 | 0.6344 | 0.9000 | 0.3594 | 0.0094 | 0.3500 | 0.7719 |
1.0000 | 0.6304 | 0.0000 | 0.6180 | 0.8727 | 0.3665 | 0.0093 | 0.3571 | 0.7609 | |
1.0000 | 0.6056 | 0.0000 | 0.5963 | 0.8416 | 0.3509 | 0.0124 | 0.3385 | 0.7578 | |
1.0000 | 0.6188 | 0.0000 | 0.6031 | 0.8344 | 0.3594 | 0.0188 | 0.3406 | 0.7844 | |
1.0000 | 0.6207 | 0.0000 | 0.6050 | 0.8464 | 0.3824 | 0.0188 | 0.3636 | 0.7649 |
Fig. 9The results of the three experiments: a) actual labels, b) the classification result of SAX-bitmaps approach, c) the classification result of SAX-entropy approach and d) the classification result of EMD-energy-entropy approach
4.3. Discussion
From the above experimental conclusions, it is noted that the classification accuracy of the proposed approach reaches the maximum of 100 %. It is so effective that even simple classifier can achieve remarkable classification accuracy. It is also competitive to both diagnostic approaches of feature extraction based on entropy after SAX representation and the one based on energy-entropy after EMD decompose.
Table 3Eigenvalues of four valve states by SAX-entropy
Normal state | spring failure | valve fracture | Valve wear |
0.1465 | 0.1806 | 0.1483 | 0.1604 |
0.1476 | 0.1770 | 0.1444 | 0.1570 |
0.1431 | 0.1814 | 0.1486 | 0.1630 |
0.1461 | 0.1792 | 0.1425 | 0.1548 |
0.1487 | 0.1811 | 0.1468 | 0.1605 |
0.1476 | 0.1809 | 0.1430 | 0.1546 |
0.1513 | 0.1813 | 0.1404 | 0.1584 |
0.1531 | 0.1805 | 0.1415 | 0.1542 |
0.1508 | 0.1816 | 0.1420 | 0.1569 |
0.1499 | 0.1798 | 0.1401 | 0.1546 |
Table 4Eigenvectors of four valve states by EMD-energy-entropy
Eigenvectors | T1 | T2 | T3 | T4 | T5 | T6 | T7 | T8 |
Normal state | 0.2850 | 0.1260 | 0.1540 | 0.0692 | 0.2460 | 0.4630 | 0.1290 | 0.5640 |
0.4330 | 0.0900 | 0.0514 | 0.0965 | 0.0867 | 0.3780 | 0.3840 | 0.2350 | |
0.2740 | 0.0814 | 0.0413 | 0.0651 | 0.1540 | 0.3290 | 0.4890 | 0.4720 | |
0.3990 | 0.1000 | 0.0836 | 0.1600 | 0.3240 | 0.5380 | 0.339 | 0.4320 | |
0.4440 | 0.1170 | 0.0639 | 0.1710 | 0.5620 | 0.2630 | 0.3180 | 0.1670 | |
Spring failure | 0.0201 | 0.0078 | 0.0089 | 0.0342 | 0.1300 | 0.1020 | 0.8920 | 0.6180 |
0.0371 | 0.0119 | 0.0128 | 0.0241 | 0.0634 | 0.2880 | 0.7670 | 0.7650 | |
0.036 | 0.0104 | 0.0107 | 0.0557 | 0.2110 | 0.2090 | 0.9130 | 0.6600 | |
0.0677 | 0.0221 | 0.0122 | 0.0788 | 0.1920 | 0.5740 | 0.7120 | 0.7380 | |
0.0473 | 0.0328 | 0.0209 | 0.0384 | 0.1070 | 0.6230 | 0.3540 | 0.6240 | |
Valve fracture | 0.9710 | 0.0410 | 0.0727 | 0.1460 | 0.1240 | 0.1090 | 0.0221 | 0.0125 |
0.9230 | 0.0267 | 0.0316 | 0.1380 | 0.0854 | 0.2310 | 0.2340 | 0.1150 | |
0.9630 | 0.0294 | 0.1660 | 0.0934 | 0.1080 | 0.0589 | 0.0913 | 0.1100 | |
0.9500 | 0.0102 | 0.0216 | 0.0426 | 0.1380 | 0.1990 | 0.1300 | 0.1260 | |
0.9710 | 0.0514 | 0.0532 | 0.1430 | 0.1360 | 0.0942 | 0.0668 | 0.0188 | |
Valve wear | 0.6730 | 0.0132 | 0.0200 | 0.0604 | 0.2140 | 0.3710 | 0.7490 | 0.6440 |
0.6440 | 0.0664 | 0.0432 | 0.1180 | 0.1150 | 0.3550 | 0.2190 | 0.7640 | |
0.7560 | 0.0161 | 0.0508 | 0.0707 | 0.5690 | 0.3800 | 0.2050 | 0.7310 | |
0.8280 | 0.0113 | 0.0113 | 0.0704 | 0.2870 | 0.3980 | 0.2440 | 0.6560 | |
0.6290 | 0.0090 | 0.0106 | 0.0794 | 0.1520 | 0.4310 | 0.3780 | 0.8180 |
As the mentioned methods show, the SAX-entropy and EMD-energy-entropy methods focus on information entropy factor and energy entropy factor respectively, they only propose a signal index to reflect the fault information resumptively based on the whole data, without analyzing signal sequential characteristic contained in the time series which is important information reflecting machinery running status, especially for fast fluctuating data. To address the above issues, a hybrid approach of SAX and bitmap is proposed and investigated. In the process of extracting features, signal sequential characteristic which can reflect fault information is taken a full consideration. The information extracted by bitmap technique constitutes an eigenvector which contains abundant information about the raw data. Therefore, it is more effective to apply the proposed method into feature extraction for fault diagnosis.
It is recognized that the data measurements in field already contains much noise. Such dataset is directly used for feature extraction without noise reduction process in this study, and the results illustrate that the proposition is robust to noisy signal compared with other methods. To further investigate the performance of the proposed algorithm with respect to various intense noise, quantitative analysis of presented method under different noise intensities is undertaken. Firstly, random noise with different signal to noise ratio (SNR) of –5 dB- –25 dB is added to the original valve vibration signal as shown in Fig. 10. It is easily seen that time-domain waveform of vibration signal becomes more and more noisy and irregular as the SNR value decreases. When the noise becoming intense, the original valve signal is submerged in the background noise as shown in Fig. 10(c-f).
Fig. 10The time-domain waveform of vibration signal under various noise conditions, a) the original valve signal without adding noise, and b)-f) the signal containing random noise with SNRs of –5 dB- –25 dB respectively
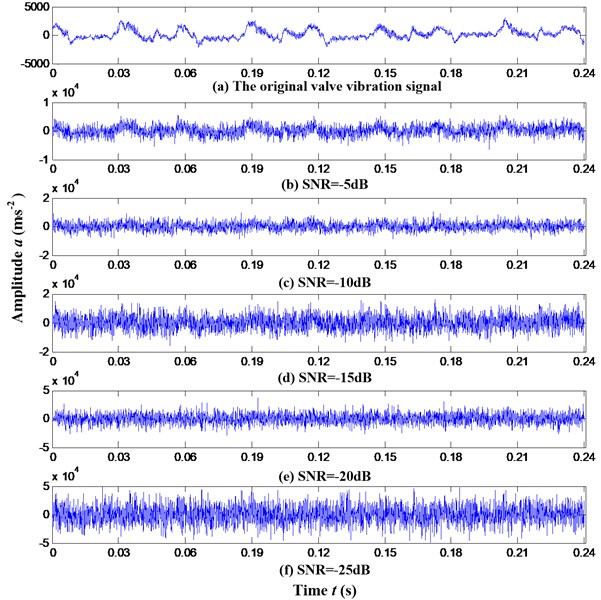
Fig. 11The performance of SAX-bitmap method under different noise intensities
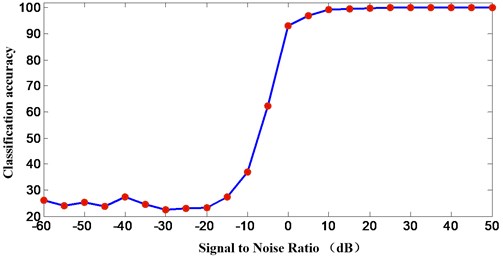
Next, the proposed algorithm is then used to process the synthetic noisy signals, and the relations of the performance of proposed algorithm with respect to the different noise intensities are illustrated in Fig. 11. The classification accuracy curve rises sharply with SNR range bound –15-0 dB. When the SNR is smaller than –20 dB, the classification performance is such poor that the proposed method is nearly noneffective. When the SNR value is larger than 0 dB, the classification accuracy of the presented algorithm approaches 100 %. Also it can be seen that in above two intervals, the curve changes gently, that is to say the classification performance is more sensitive to SNR of –20-0 dB. When signal energy is equal to or larger than noise energy (SNR>= 0), the presented method could achieve impressive performance, which is evidently superior to traditional methods. Given an intense noisy signal, signal preprocessing to reduce the noise is needed to improve the performance of presented algorithm.
5. Conclusions
In this study, a hybrid approach of SAX framework and bitmap technology is proposed for machinery fault diagnosis. More specifically, SAX is employed for the transformation of a real valued vibration signal into a sequence of symbols. The sequence of the symbols is condensed into a much lower representation based on bitmap rationale by counting the frequency of appearances of all potential words given a specified word-length. This representation comprises the feature vector used for representing the original signal and subsequently for classification using standard pattern recognition approaches. Experimental studies on a reciprocating compressor as a testbed have been performed to demonstrate the effectiveness of the presented method. The conclusions can be drawn as follows.
1) A representation using bitmap is presented, which provides a competitive alternative for feature extraction. It is effective to transform symbolic sequence to optical representation, further, successfully extract feature vectors into the feature space.
2) This study presents a criterion based on classification accuracy to guide parameter selection in the process of SAX. The influence of parameters is analysed theoretically and the parameter optimization process is investigated by traversing parameter combinations of a and w with valve lid vibration signal.
3) A hybrid approach of SAX framework and bitmap technology is proposed to compress data into symbolic sequence and then extract features using bitmap based on symbolic sequence for classification/detection purposes. It is effective even with simple classifier which can achieve remarkable classification accuracy of 100 %, comparing with the SAX-entropy approach of 81.25 % and the EMD-energy-entropy approach of 80 %. The presented method established the connection between different running states and their “icon-like” representation used for feature extraction for fault diagnosis.
References
-
Byrne G., Dornfeld D., Inasaki I., Ketteler G., Konig W., Teti R. Tool condition monitoring (TCM) – the status of research and industrial application. CIRP Annals-Manufacturing Technology, Vol. 44, Issue 2, 1995, p. 541-567.
-
Teti R., Jemielniak K., O’Donnell G., Dornfeld D. Advanced monitoring of machining operations. CIRP Annals-Manufacturing Technology, Vol. 59, Issue 2, 2010, p. 717-739.
-
Wiendahl H. P., Elmaraghy H. A., Nyhuis P., Zah M. F., Wiendahl H. H., Duffie N., Brieke M. Changeable manufacturing-classification, design, and operation. CIRP Annals-Manufacturing Technology, Vol. 56, Issue 2, 2012, p. 783-809.
-
Zhou Z. D., Chen Y. P., Fuh J. Y. H., Nee A. Y. C. Integrated condition monitoring and fault diagnosis for modern manufacturing systems. CIRP Annals-Manufacturing Technology, Vol. 49, Issue 1, 2000, p. 387-390.
-
Ma D., Liang Y., Zhao X., Guan R., Shi X. Multi-BP expert system for fault diagnosis of power system. Engineering Applications of Artificial Intelligence, Vol. 26, Issue 3, 2013, p. 937-944.
-
Jayaswal P., Verma S. N., Wadhwani A. K. Development of EBP-artificial neural network expert system for rolling element bearing fault diagnosis. Journal of Vibration and Control, Vol. 17, Issue 17, 2011, p. 1131-1148.
-
Gao X., Hou J. An improved SVM integrated GS-PCA fault diagnosis approach of Tennessee Eastman process. Neurocomputing, Vol. 174, 2016, p. 906-911.
-
Huang C. H., Chung F. L., Wang S. T. Multi-view L2-SVM and its multi-view core vector machine. Neural Networks, Vol. 75, 2016, p. 110-125.
-
Shatnawi Y., Al-khassaweneh M. Fault diagnosis in internal combustion engines using extension neural network. IEEE Transactions on Industrial Electronics, Vol. 61, Issue 3, 2014, p. 1434-1443.
-
Tayarani-Bathaie S. S., Vanini Z. N. S., Khorasani K. Dynamic neural networkbased fault diagnosis of gas turbine engines. Neurocomputing, Vol. 125, Issue 11, 2014, p. 153-165.
-
Zhang X., Xiao L., Kang J. Application of an improved Levenberg-Marquardt back propagation neural network to gear fault level identification. Journal of Vibroengineering, Vol. 16, Issue 2, 2014, p. 855-868.
-
Wu J. D., Hsu C. C. Fault gear identification using vibration signal with discrete wavelet transform technique and fuzzy-logic inference. Expert Systems with Applications, Vol. 36, Issue 2, 2009, p. 3785-3794.
-
Winston D. P., Saravanan M. Single parameter fault identification technique for DC motor through wavelet analysis and fuzzy logic. Journal of Electrical Engineering and Technology, Vol. 8, Issue 5, 2013, p. 1049-1055.
-
Muralidharan V., Sugumaran V. Rough set based rule learning and fuzzy classification of wavelet features for fault diagnosis of monoblock centrifugal pump. Measurement, Vol. 46, Issue 9, 2013, p. 3057-3063.
-
Sakthivel N. R., Sugumaran V. Nair B. B. Comparison of decision tree-fuzzy and rough set-fuzzy methods for fault categorization of mono-block centrifugal pump. Mechanical Systems and Signal Processing, Vol. 24, Issue 6, 2010, p. 1887-1906.
-
Liao Q., Li X., Huang B. Hybrid fault-feature extraction of rolling element bearing via customized-lifting multi-wavelet packet transform. Proceedings of the Institution of Mechanical Engineers, Part C: Journal of Mechanical Engineering Science, Vol. 228, Issue 12, 2014, p. 2204-2216.
-
Seera M., Lim C. P. Online motor fault detection and diagnosis using a hybrid FMM-CART model. IEEE Transactions on Neural Networks and Learning Systems, Vol. 25, Issue 4, 2014, p. 806-812.
-
Liu H., Liu C., Huang Y. Adaptive feature extraction using sparse coding for machinery fault diagnosis. Mechanical Systems and Signal Processing, Vol. 25, Issue 2, 2011, p. 558-574.
-
Martin H. R. Statistical moment analysis as a means of surface damage detection. Proceedings of the International Modal Analysis Conference, 1989, p. 1016-1021.
-
Peter W., Tse Y. H., Peng R. Y. Wavelet analysis and envelope detection for rolling element bearing for rolling element bearing fault diagnosis-their affectivities and flexibilities. Journal of Vibration and Acoustics, Vol. 123, Issue 3, 2001, p. 303-310.
-
Walker R. B., Vayanat R., Perinpanayagam S., Jennions I. K. Unbalance location through machine nonlinearities using an artificial neural network approach. Mechanism and Machine Theory, Vol. 75, Issue 5, 2014, p. 54-66.
-
Xie H., Lin J., Lei Y. G., Liao Y. Fast-varying AM-FM components extraction based on an adaptive STFT. Digital Signal Processing, Vol. 22, Issue 4, 2012, p. 664-670.
-
Chen B. H., Wang X. Z., Yang S. H., McGreavy C. Application of wavelets and neural networks to diagnostic system development, 1, feature extraction. Computers and Chemical Engineering, Vol. 23, Issue 7, 1999, p. 899-906.
-
Yen G. G., Lin K. C. Wavelet packet feature extraction for vibration monitoring. IEEE Transactions on Industrial Electronics, Vol. 47, Issue 3, 2000, p. 650-667.
-
Kim H., Melhem H. Damage detection of structures by wavelet analysis. Engineering Structures, Vol. 26, Issue 3, 2004, p. 347-362.
-
Zhang P. Z., Shu H. Z. A neural network and wavelet based face detection method. Journal of Circuits and Systems, Vol. 12, Issue 1, 2007, p. 55-61.
-
Ricci R., Pennacchi P. Diagnostics of gear faults based on EMD and automatic selection of intrinsic mode functions. Mechanical Systems and Signal Processing, Vol. 25, Issue 3, 2011, p. 821-838.
-
Georgoulas G., Loutas T., Stylios C. D., Kostopoulos V. Bearing fault detection based on hybrid ensemble detector and empirical mode decomposition. Mechanical Systems and Signal Processing, Vol. 41, Issue 1, 2013, p. 510-525.
-
Cheng J., Yu D., Yang Y. A fault diagnosis approach for roller bearings based on EMD method and AR model. Mechanical Systems and Signal Processing, Vol. 20, Issue 2, 2006, p. 350-362.
-
Lin J., Keogh E., Wei L., Lonardi S. Experiencing SAX: a novel symbolic representation of time series. Data Mining and Knowledge Discovery, Vol. 15, Issue 2, 2007, p. 107-144.
-
Lin J., Keogh E., Lonardi S., Chiu B. A symbolic representation of time series, with implications for streaming algorithms. Proceedings of the 8th ACM SIGMOD Workshop on Research Issues in Data Mining and Knowledge Discovery, 2003, p. 2-11.
-
Kumar N., Lolla V. N., Keogh E. J., Lonardi S., Ratanamahatana Time C. A. Time-series bitmaps: a practical visualization tool for working with large time series databases. Proceedings of the SDM, 2005, p. 531-535.
-
Shieh J., Keogh E. iSAX: indexing and mining terabyte sized time series. Proceedings of the 14th ACM SIGKDD International Conference on Knowledge Discovery and Data Mining, 2008, p. 623-631.
-
SAX Homepage. http://www.cs.ucr.edu/~eamonn/SAX.htm, 2016.
-
Zhang C., Chen J. J., Guo X. A gear fault diagnosis method based on EMD energy entropy and SVM. Journal of Vibration and Shock, Vol. 29, Issue 10, 2010, p. 216-220.
About this article
This research acknowledges the financial support provided by National Science Foundation of China (No. 51504274), and Science Foundation of China University of Petroleum, Beijing (Nos. 2462014YJRC039 and 2462015YQ0403).

