Abstract
The numerical simulation model of pump pressure is important to simulation and optimal design of sucker rod pumping system (SRPS). For now, the pump pressure is solved with the finite difference method, which is too excruciatingly slow to meet simulation and optimization of SRPS. Therefore, an effective differential quadrature method (DQM) is proposed to solve pump pressure in this paper. In the detail, considering oil-gas-water three-phase flow, the differential equation of pressure gradient is built, which matches solving pump pressure with DQM. Considering hydraulic loss and Newtonian fluid leakage, an improved numerical simulation model of pump pressure is established with the first order ordinary differential equation. The new numerical model is verified by comparing it with the available results, and good agreement is found. The results show that the plunger velocity is a key factor affecting hydraulic loss. With plunger velocity increasing, the pump pressure of upstroke is decreasing and the pump pressure of down-stroke is increasing. With the pump clearance increasing, the delay time of standing valve is increasing on plunger upstroke, and the lead time of traveling valve is increasing on plunger down-stroke. In conclusion, the method that pump pressure is solved with DQM can solve practical engineering problem rightly and efficiently.
1. Introduction
Sucker rod pumping system (SRPS) is the most popular tool for the artificial lift in the world. The pump is an important part of work of SRPS. Some materials indicate that the lower efficiency of underground system is an important cause of the lower efficiency of SRPS, and the pump efficiency is a key factor that leads to a lower efficiency in SRPS [1-3]. So that means the performance and efficiency of pump will directly affect the economic benefits of the oil field. On the other hand, with pump system equipment, the downhole operational data can’t be directly achieved by measurement. That is because the depth and in principle the underground well conditions prohibit the placement of sensory equipment at the well bottom. Therefore, the pump cannot be calibrated directly. As a result, a successful simulation model of plunger pump is very important to estimate the downhole dynamometer and pump efficiency, which is increasingly attracting attention in the world.
The dynamic simulation of pump is very complicated. The plunger load relates not only to pump pressure and Newtonian fluid density (oil-gas-water), but to inflow characteristic, outflow characteristic and wellbore line characteristic. In the early years of the century, the plunger load was usually ignored. After the wave equation is built by Gibbs [4], the simulation model of plunger pump was developed. The earlier model of plunger pump was built with the neglect of the change of pump pressure, and the mathematical model was described as follows [5, 6]:
where, ApL is cross-sectional area of plunger (L2, m2). ps is pressure in the suction chamber (m/Lt2, Pa). pd is pump discharge pressure (m/Lt2, Pa). FpL is load of pump plunger (mL/t2, N).
We all know, considering the work theory of plunger pump, the plunger load is not constant, which is greatly affected by pump pressure. Therefore, the simulation model is not a true reflection of working load of plunger pump. And then, the simulation model of pump has been improved. The simulation model of pump is derived based on the change of pump pressure [7, 8]. The equation is given as follows:
where, Abr is cross-sectional area of the bottom of rod (L2, m2). P is pump pressure (m/Lt2, Pa).
Subsequently, the mathematical model of pump pressure has been continuously improved. Some major factors, such as friction between pump plunger and barrel, hydraulic loss and Newtonian fluid leakage are considered by Zhao, Jeong and Wang et al. [9-13]:
where, LpL is length of plunger (L, m). dpL is plunger outside diameter (L, m). Δp is instantaneous pressure difference of pump inside and outside (m/Lt2, Pa). hc is eccentric distance (L, m). μL is fluid viscosity (L/mt, N∙s/m2). vpL is plunger velocity (L/t, m/s). hp is radial clearance (L, m). Δpj is hydraulic loss of pump valve (m/Lt2, Pa). nv is travelling valve number. ρL is liquid density, production (m/L3, kg/m3). Av is cross-sectional area of pump valve (L2, m2). kc is coefficient. g is acceleration of gravity (L/t2, m/s2). Bl is fluid leakage (L3/t, m3/s).
Much work has been done on the simulation model of pump load, but there are some problems. When the pump pressure is simulated, the plunger velocity in Eq. (3) and Eq. (4) is simplified as a constant which is relevant to stroke frequency and stroke length of oil well. Besides, the fluid density and pump pressure difference in above equations are simplified as oil-water two-phase mixture. When discharge pressure and suction pressure are computed, the change of Newtonian fluid alone oil well as well as Newtonian fluid friction of tube are ignored. And then, both the analytical solution and numerical solution mentioned earlier are based on the assumption that the pump velocity is constant. However, the speed or acceleration of pump plunger may change in any time either due to the longitudinal vibration of SRS or supply-production coordination condition of oil well. Therefore, the opening and closing time of pump valve is still highly uncertain. Then the periodic assumption does not hold in practice.
The choice of dynamic simulation algorithm of pump is of crucial importance. At the moment, the simulation model of pump is solved with some different algorithms, such as Fourier series in expanding calculus [14] and numerical difference methods [15, 16]. However, the sucker rod system is taken as SRPS, the instantaneous work of pump is closely related to the polished rod and surface transmission device. When the mathematical model of pump is solved, the instantaneous simulated results of SRS longitudinal vibration and torsional vibration of surface system will be considered as the known variables. Also at present, the numerical model of torsional vibration of surface system needs to be solved with the numerical integral method, and the simulation model of down-hole system is solved with finite-difference method. Then the iteration method between integral and difference method is used to solve the whole system. The disadvantage of current simulation algorithm of whole systems is that solving whole equations will take quite a long time. Due to the requirement to maximize the production and minimize the electric energy [17], the current simulation algorithm is not a good method to carry on the optimum design of SRPS. Thus, the new simulation algorithm of pump is very important to the whole simulation of SRPS.
In this paper, the numerical simulation models of inflow and outflow performance relationship are built in Section 2. Considering the influence of oil-gas-water multi-phase flow on the liquid pressure gradient of wellbore, the numerical simulation models of discharge pressure and suction pressure are built in the Section 3. In Section 4, based on the mathematical models of hydraulic loss, fluid leakage, an improved numerical simulation model of pump pressure is derived, which is solved with DQM. In Section 5, experimental results illustrate the efficiency of the simulation system. Next, the inflow and outflow characteristic, pump pressure characteristic are analyzed. In Section 6, the signification of simulation research and the conclusions are summarized.
2. Numerical simulation models of inflow and outflow performance relationship
The inflow performance relationship (IPR) is one common methodology for forecasting the production output in oil reservoirs [17]. Based on the Vogel’s equation, the numerical simulation model of relationship of flowing pressure and production is derived as follows:
+u(pr-pb)sgn(pr-pb){u(pf-pb)qlpr-pf(pr-px)+u(pb-pf)ql{pr-pb+pb1.8
×(1-0.2pfpr-0.8(pfpr)2)-1(pr-pb)+u(pb-pf)pb1.8[1-0.2pfpr-0.8(pfpr)2]
×[1-0.2pxpr-0.8(pxpr)2]},
where:
where, Q is production rate of different flow rate (L3/t, t/d). pr is static pressure (m/Lt2, Pa). pb is saturation pressure (m/Lt2, Pa). ql is production rate (L3/t, t/d). pf is flow pressure (m/Lt2, Pa). pb is saturation pressure (m/Lt2, Pa). px is different flow pressure (m/Lt2, Pa). u(t) is the step function, sgn(t) is the symbolic function.
The outflow performance curve is the relationship of pump actual production and flow pressure. Therefore, the outflow performance relationship is very important. Based on correlations for formation volume factors [17], the numerical simulation model of outflow performance curve is built as follow:
×{[∫Ty0-πdpLΔphc12μLLpL(1+32h2p)dt+ApLLpd]11+Rsgl(ApLLpd)-1}
×[(1-Nwl)Cvo+NwlCvw+(1-Nwl)(Rpgl-Rsgl)pspTstTpbZps]-1,
where:
×(0.5353-0.6213TcTpb-0.6816Tc3Tpb)(0.27TcpgcTpb)2,
×[10-3(px-Δpsb)]u(ρsco-0.8762)×1.0937[10-3(px-Δpsb)]u(ρsco-0.8762)×1.1870ρgpρgaZgaZ
×exp{141.5-131.5ρscoρsco(1.8Tpb+492)u(ρsco-0.8762)×25.724+u(ρsco-0.8762)
×23.931141.5-131.5ρscoρsco(1.8Tpb+492)}+ρgpρgaZgaZlog[1.265×10⁻⁶(px-Δpsb)]
×5.192×10-5×141.5-131.5ρscoρsco(1.8Tpb+32),
×10-6R2sgl+0.02408ρgrd-9.2602×10-8×(1.8Tpb+492)2]
×log[pb-1×(px-Δpsb)]+u[(px-Δpsb)-pb][1+9.9571×10⁻⁴Rsgl
+0.0012361Rsgl(ρgrdρlrd)+2.4101×10⁻⁵Rsgl(1.8Tpb-28)(1-ρsco)
+5.2871×10⁻⁴(1.8Tpb-28)],
where, nsn is stroke number (1/t, min-1). Lpd is plunger displacement (L, m). Las is anti-impact stroke (L, m). Rsgl is gas/liquid ratio, pump suction. ps is pressure in the suction chamber (m/Lt2, Pa). n is gas polytropic exponent. Ty is temperature in y-meter deep well (T, °C). Nwl is water/liquid ratio, production. Cvo is oil volume factors of pump suction. Cvw is water volume factors of pump suction. Rpgl is gas/liquid ratio, production. psp is standard atmospheric pressure (m/Lt2, Pa). Tc is gas separator temperature (T, °C). Tpb is temperature of pump barrel (T, °C). Tst is temperature of standard atmospheric pressure (T, °C). Z is gas compressibility factor. Δpsb is pressure difference of oil level and pump suction (m/Lt2, Pa). pgc is gas separator pressure (m/Lt2, Pa). ρsco is relative density of crude oils under standard condition (m/L3, kg/m3). ρga is gas density of air under standard condition (m/L3, kg/m3). ρgp is gas density of pump suction (m/L3, kg/m3). Zga is air compressibility factor. ρgrd is gas relative density (air = 1) (m/L3, kg/m3). ρlrd is liquid relative density (m/L3, kg/m3).
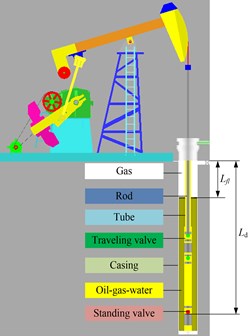
Fig. 1The structure schematic map of SRPS
3. Numerical simulation models of discharge pressure and suction pressure
The discharge pressure and suction pressure are important parameters to compute the plunger load. Fig. 1 shows the structure schematic map of SRPS.
Based on the work environment map of pump, the mathematical models of discharge pressure and suction pressure are given as follows:
×{[(1.2+0.371dtydry)(vlsv+vgsv)+vblv]-1vgsv(ρgy-ρLy)+ρLy}
×[g+2Cfm(vlsv+vgsv)2dtr]
+u(vgsv-0.429vlsv+0.357vblv)u[25.4lg(ρLyv2lsv)-38.9-ρgyv2gsv]
×{[(1.2+0.9dtydry)(vlsv+vgsv)+0.35√gdtr(ρLy-ρgy)ρLy]-1vgsv(ρgy-ρLy)+ρLy}
×{g+2Cfm(vlsv+vgsv)2dtr-2Cfm(vlsv+vgsv)2vgsvdtr[(1.2+0.9dtydry)(vlsv+vgsv)
+0.35√gdtr(ρLy-ρgy)ρLy]-1}+u{3.1[σg(ρLy-ρgy)ρgy2]0.25-vgsv}u
×[ρgyv2lsv+38.9-25.4lg(ρLyv2lsv)]{[(vlsv+vgsv)+0.35[ρ-1Ly[gdtr(ρLy-ρgy)]12]-1
×vgsv(ρgy-ρLy)+ρLy}{g+2Cfm(vlsv+vgsv)2dtr-2Cfm(vlsv+vgsv)2vgsvdtr
×[(vlsv+vgsv)+0.35√gdtr(ρLy-ρgy)ρLy]-1},
where:
where, vlsv is liquid superficial velocity (L/t, m/s). vblv is bubble limiting velocity (L/t, m/s). vgsv is gas superficial velocity (L/t, m/s). dty is tubing diameter in y-meter deep well (L, m). ρgy is gas density in y-meter deep well (m/L3, kg/m3). ρLy is liquid density in y-meter deep well (m/L3, kg/m3). dry is rod diameter in y-meter deep well (L, m). dtr is equivalent diameter of annular space between rod and tue (L, m). Ld is pump depth (L, m). Lfl is work fluid level depth (L, m). Zy is gas compressibility factor in y-meter deep well. py is pressure in y-meter deep well (m/Lt2, Pa). Atr is equivalent area of annular space between rod and tube (L2, m2). ql is production rate (L3/t, t/d). Rsgly is gas/liquid ratio in y-meter deep well. Cwy is water volume factors of y-meter deep well. Cvoy is oil volume factors of y-meter deep well. σ is surface tension (m/t2, N/m). pc is capillary pressure (m/Lt2, Pa).
With the numerical integral method, the discharge pressure of pump is solved. When above equations is solving, the bounds of integration are zero and pump depth, also the initial condition is y=0, py=po.
4. Numerical simulation model of pump pressure
Fig. 2 shows the dynamic simulation image of pump. As shown in Fig. 2, there are four stages, such as gas expanding stage, liquid suction stage, gas compression stage and liquid discharge stage.
The direction from bottom to up is described as positive. Considering the influence of hydraulic loss and fluid leakage on the pump pressure, the numerical simulation model of pump pressure is built based on the work stages of pump:
×{[pd+Δpdx(1)]1n-1-pd-Δpd[x(1)]2n+(πdpLh3c)2[pd-x(1)]144μl2LpL2Vog}-1
-u(vpL)u[ps-Δps-x(1)]×2μ2l(ApLApv)2ρL2gvpLgp+u[pd+Δpd-x(1)]u(-vpL)
×{vpLApLVg+[ps-Δpsx(1)]1n-12nx(1)μl2(ApLApv)2ρL2gvpLgp}
×{[ps-Δpsx(1)]1n-1-ps+Δps[x(1)]2n+(πdpLh3c)2[pd-x(1)]144μ2lL2pLVg}-1
-u[x(1)-pd-Δpd]u(-vpL)4μl2(ApLApv)2ρL2gvpLgp,
where:
where, Vog is gas volume of clearance volume (L3, m3). vpL is plunger velocity (L/t, m/s). Vg is free gas volume of pump (L3, m3). gp is acceleration of plunger (L/t2, m/s2). ρL is liquid density, production (m/L3, kg/m3).
Form Eq. (15), the plunger velocity is instantaneous velocity, therefore, the pump pressure reflects the instantaneous variation of pump pressure. With the fourth order Ronge-Kutta method, the instantaneous pressure of pump is solved. In a detail, the initial condition is t=0, x(1)=pd+Δpd.
Fig. 2The dynamic simulation image of pump
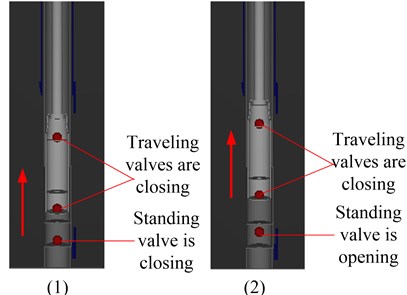
a) Upstroke of the plunger
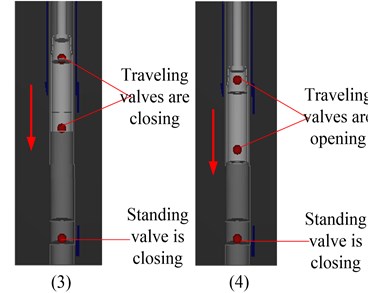
b) Down-stroke of the plunger
5. Experiment and application
Based on the simulation model of beam pump system proposed by Xing [3], and with the improved simulation model of pump plunger load, the stable response of SRPS is solved with the basic parameters provided in Table 1.
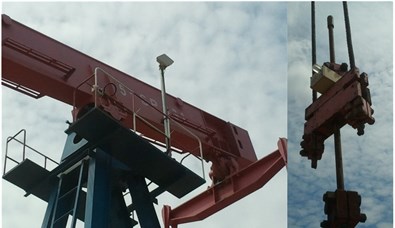
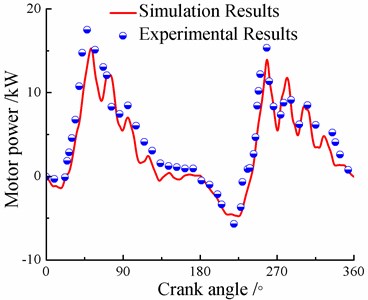
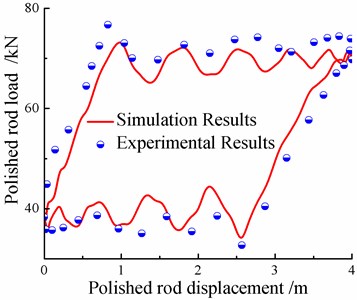
With the testing equipment of oil well and the improved simulation model, the simulating and experimental curves of motor power and dynamometer card are obtained. Fig. 3 gives the electric parameter detector and dynamometer sensor, and Fig. 4 gives the comparison between experimental results and simulating results.
Table 1Basic parameter of oil well
Item | Value | Item | Value |
Well | 15-87 | Stroke frequency, min-1 | 3.18 |
Ambient temperature, °C | 23 | Pump diameter, m | 0.056 |
Pumping unit | CYJ14-6-73HB | Pump depth, m | 1700 |
Motor type | Y250M-8 | Oil pressure, MPa | 0.6 |
Depth of oil layer, m | 3110 | Casing pressure, MPa | 0.3 |
Static pressure, MPa | 21.68 | Dynamic liquid level, m | 1400 |
Saturation pressure, MPa | 8.0 | Inner diameter of tube, m | 0.062 |
Fluid viscosity, MPa∙s | 30 | Temperature gradient, °C/100 m | 2.5 |
Water content, % | 60 | Liquid production, m | 33.31 |
Gas/oil ratio, m3/m3 | 20 | Sucker rod string, mm × m | 22×800+19×900 |
Oil density, kg/m3 | 890 | Rod Young’s modulus, Pa | 2.1×10¹¹ |
Stroke length, m | 4.0 | Rod density, kg/m3 | 7850 |
Fig. 3Testing equipment of oil well
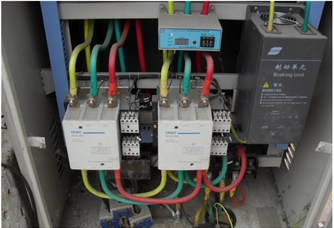
a) Electric parameter detector
b) Dynamometer sensor
Fig. 4Comparison between experimental and/simulating results
a) Motor power
b) Dynamometer card
According to Fig. 4, the maximum input powers of experimental and simulating results are 17.49 kW, 15.60 kW, the error of both powers is 1.89 kW. The maximum polished rod loads of experimental and simulating results are 76.69 kN, 73.18 kN, the error of both polished rod loads is 3.51 kN. There is a good agreement with the experimental curves. Therefore, the improved model presented in this paper is accurate enough to be used for engineering practice.
Based on the numerical simulation model of inflow and outflow performance relationship, the relationship curve is got. When some parameters are changed, such as the stroke frequency is 6 min-1, and the pump depth is 1982 m, the new outflow performance relationship curve is got. The curves are shown in Fig. 5.
Fig. 5Inflow and outflow performance relationship/ curve
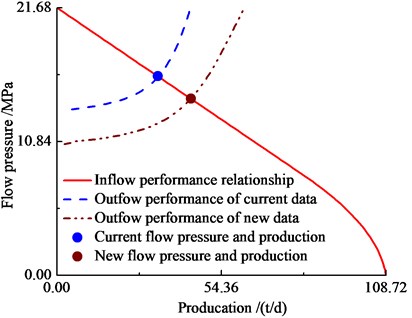
Fig. 6Comparison of old and new model
According to the Fig. 5, the conclusions are obtained as follows. The point of supply-production coordination in condition of current sucker data is obtained. That is, the current production and flow pressure of oil well is got with Fig. 5. The liquid production and flow pressure of any sucker parameters are obtained. That is, the liquid production and working fluid level of any sucker parameters are given in Fig. 5.
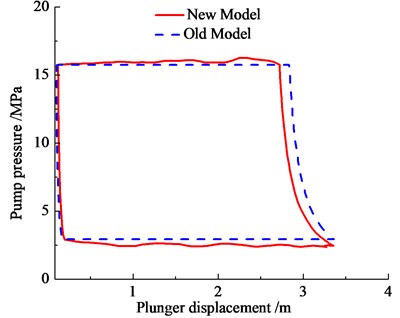
For demonstration purposes, the current simulation model of pump [16] is defined as old model, and the improved simulation model of pump is defined as new model. Fig. 6 shows the instantaneous pressure of down-hole pump.
As seen in Fig. 6, comparing with the results of old model, the pump pressure of new model is smaller on upstroke of plunger, also the pump pressure of new model is bigger on down-stroke of plunger. That’s because the both of hydraulic loss and Newtonian fluid leakage are considered in the new model. When the hydraulic loss is increasing, the minimum pressure of upstroke is decreasing and the maximum pressure of down-stroke is increasing. Therefore, the influence of hydraulic loss on pump pressure will be shown in new model.
In order to analyze the influence of hydraulic loss on pump pressure, the pump pressure curves with ignoring or considering hydraulic loss are shown in Fig. 7(a). And the pressure curves with different stroke number is given in Fig. 7(b).
Fig. 7Influence of hydraulic loss on pump pressure
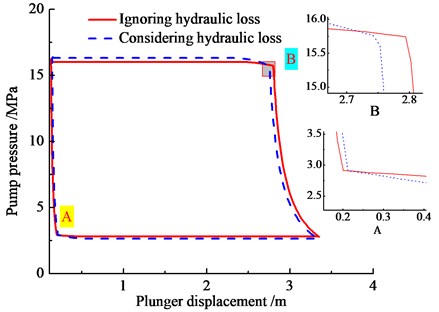
a) Hydraulic loss
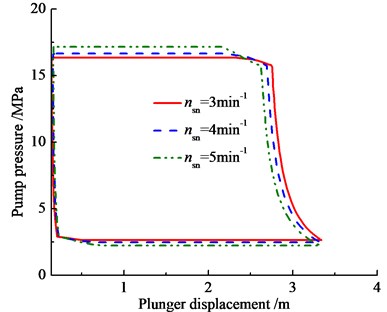
b) Stroke number
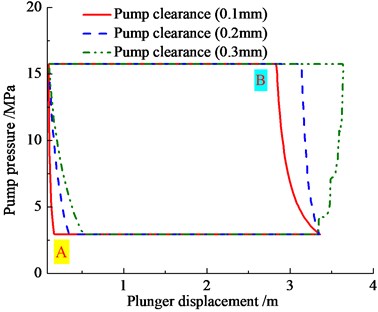
In order to analyze the influence of Newtonian fluid leakage on pump pressure, the pump pressure curves with ignoring or considering Newtonian fluid leakage are shown in Fig. 8(a), and the pump pressure curves with different clearance stages are given in Fig. 8(b).
Fig. 8Influence of Newtonian fluid leakage on pump/ pressure
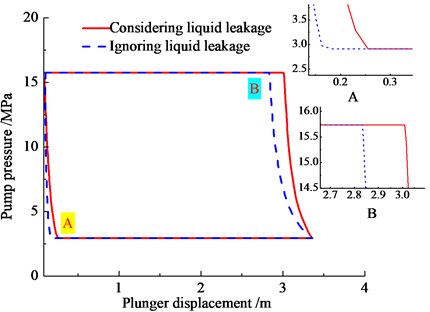
a) Newtonian fluid leakage
b) Clearance stage
As see in Fig. 7, when the hydraulic loss is considered, the delay time of traveling valve opening will increase during upstroke, and the pump pressure will decrease. In the same time, the delay time of standing valve opening will increase during down stroke and the pump pressure will increase. When the stroke number is increasing, the pump pressure of upstroke will decrease and the pump pressure of down-stroke will increase. Among the reasons, when the plunger velocity is increasing, the hydraulic loss will increase. Therefore, the plunger velocity is important factor affecting pump pressure.
As seen in Fig. 8, the minimum and maximum pressure of pump is not influenced by liquid leakage, and the liquid leakage only affects the time of pump valve opening or closing. When the liquid leakage is considered, the standing valve opens late on upstroke of plunger and the traveling valve open in advance. With the pump clearance increasing, the delay time of standing valve is increasing, and the lead time of traveling valve is increasing.
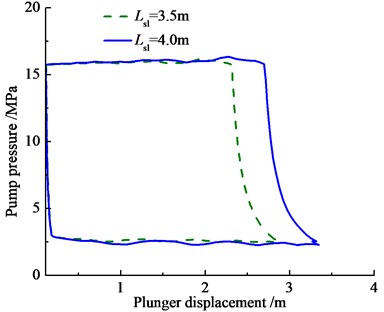
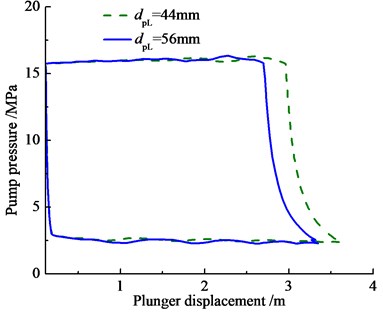
The stroke length and plunger diameter are important factors which affecting pump pressure. So the pump pressure curves with different sucker parameters are given in Fig. 9.
As you can see in the Fig. 9, when the stroke length and plunger diameter increase, the pump pressure of upstroke will decrease, the pump pressure of down-stroke will increase. Besides, the pump pressure is fluctuant in liquid suction and liquid discharge stage, which is influenced by hydraulic loss. Above conclusions are better to the design and optimization of SRPS by Practice.
Fig. 9Pump pressure curve with different sucker/ parameters
a) Stroke length
b) Plunger diameter
6. Conclusions
An improved numerical simulation research of plunger pump in the condition of Newtonian fluid is researched, the conclusions are as follows.
1. The differential equation of pressure gradient is built in condition of oil-gas-water multi-phase fluid. Considering hydraulic loss and Newtonian fluid leakage, an improved numerical simulation model of pump pressure is established with the first order ordinary differential equation, which is solved with an effective differential quadrature method (DQM).
2. The new curves of inflow and outflow performance relationship are given, which is the foundation of optimizing production and improving efficiency in engineering practice.
3. The influence factors of pump pressure are analyzed. With plunger velocity increasing, the pump pressure of upstroke is decreasing and the pump pressure of down-stroke is increasing. With the pump clearance increasing, the delay time of standing valve is increasing on plunger upstroke, and the lead time of traveling valve is increasing on plunger down-stroke. When the stroke length and plunger diameter increase, the pump pressure of upstroke will decrease and the pump pressure of down-stroke will increase. Above results will benefit computing liquid production and be better to the design and optimization of SRPS in oil well production.
References
-
Takacs G., Belhaj H. Latest technological advances in rod pumping allow achieving efficiencies higher than with ESP system. Journal of Canadian Petroleum Technology, Vol. 50, Issue 4, 2011, p. 53-58.
-
Wang S., Long Y., Zhou T., et al. Analysis and countermeasures on the efficiency of the pumping wells system in the old oil-field. SPE Asia Pacific Oil and Gas Conference and Exhibition Held in Jakarta, Indonesia, 2013.
-
Xing M. M., Dong S. M. A new simulation model for a beam-pumping system applied in energy saving and resource-consumption reduction. SPE Production and Operations, Vol. 30, Issue 2, 2015, p. 130-140.
-
Gibbs S. G. Predicting the behavior of sucker rod pumping systems. Journal of Petroleum Technology, Vol. 15, Issue 7, 1963, p. 769-778.
-
Gibbs S. G., Neely A. B. Computer diagnosis of down-hole conditions in sucker rod pumping wells. Journal of Petroleum Technology, Vol. 18, Issue 1, 1966, p. 91-98.
-
Juch A. H., Watson R. J. New concepts in sucker rod pump design. Journal of Petroleum Technology, Vol. 21, Issue 3, 1969, p. 342-354.
-
Lu J. H. A New Method of Calculating Plunger Barrel Slippage. Society of Petroleum Engineers. 1989.
-
Lea J. F., Cox J. C., Nickens H. V., et al. Wave equation simulation of fluid pound and gas interference. SPE Production Operations Symposium, Oklahoma City, Oklahoma, 2005.
-
Zhao H. J. A discussion of the friction between pump plunger and barrel. China Petroleum Machinery, Vol. 21, Issue 2, 1993, p. 34-37.
-
Jeong Y. T., Shah S. N. Analysis of tool joint effects for accurate friction pressure loss calculations. IADC/SPE Conference, Dallas, 2004.
-
Benavides Diaz L. C., Ortiz J. A., Gil A. The effect of temperature on the mechanical pump slippage in heavy oil wells with steam injection. SPE Artificial Lift Conference – Americas, Cartagena, Colombia, 2013.
-
Wang Z. B., Yingchuan L., et al. A simple numerical model for the prediction of multiphase mass flow rate through chokes. Petroleum Science and Technology, Vol. 29, 2011, p. 2545-2553.
-
Enfis M. S., Ahmed R. M. The hydraulic effect of tool-joint on annular pressure loss. SPE Production Operations Symposium, Oklahoma City, 2011.
-
Yang Y., Watson J., Dubljevic S. Modeling and dynamic analysis of the wave equation of sucker-rod pumping system. SPE Annual Technical Conference and Exhibition. San Antonio Texas, 2012.
-
Luan G. H., He Sh L., Zhao H., et al. A prediction model for a new deep rod pumping system. Journal of Petroleum Science and Engineering, Vol. 80, 2011, p. 75-80.
-
Pons V. Optimal stress calculations for sucker-rod pumping systems. SPE Artificial Lift Conference and Exhibition-North America, Houston, USA, 2014.
-
Vogel J. V. Inflow performance relationships for solution-gas drive wells. Journal of Petroleum Technology, Vol. 20, Issue 1, 1968, p. 83-92.
About this article
The author express their great thanks to Z. Y. Zhang, Y. Pan, et al. of PetroChina Daqing Oilfield Company for their support.
