Abstract
Cavitation is utilized in a wide range of applications. As examples ultrasonic cleaning baths and emulsification in sonochemistry may be mentioned. For a high temperature ultrasonic assisted casting process, the authors’ aim is to detect cavitation in the ongoing process using cavitation noise spectra without additional sensors like hydrophones, which disturb the sound field. The authors’ aim is to detect cavitation from the ultrasonic transducers’ current signal. Two different horn geometries are tested for their cavitation detection capability. To investigate the frequency components in the transducers’ current signal without the influence of the horns’ individual transfer functions, the measured data are processed to obtain the uninfluenced signals. Different frequency components are found in the measurements, which can be used as indicators for cavitation.
1. Introduction
Cavitation is utilized in a wide range of applications. As examples ultrasonic cleaning baths and emulsification in sonochemistry may be mentioned. For a high temperature ultrasonic assisted casting process, the authors’ aim is to detect cavitation in the ongoing process by analysing cavitation noise spectra without additional sensors like hydrophones, which disturb the sound field. The onset of broad band noise, subharmonics and ultraharmonics of the excitation frequency are indicators for the onset of cavitation, which is the basis for the target casting process.
The authors’ aim is to detect cavitation by the mentioned indicators from the ultrasonic transducers’ current signals. The sensitivity of the transducers, used for excitation, towards these indicators is investigated. Therefore, frequency spectra from the transducers’ current signal are computed, processed and evaluated and analyzed.
1.1. Cavitation
Cavitation is the formation of bubbles by pressure changes in a liquid. These pressure changes can be generated by different sources. If an acoustic wave is the source of the pressure changes, this type of cavitation generation is referred to as acoustic cavitation [1]. This is the case when ultrasound is applied to a liquid. The liquid is exposed to both expansion, and contraction phases, caused by the sound field, which adds to the ambient pressure of the liquid. Bubbles form from gas inclusions already present in the liquid, or by smallest impurities, which serve as cavitation sources [2].
Two stages of cavitation can be distinguished, stable and transient cavitation. Stable cavitation means the formation of bubbles, whose radii change periodically with the sound field. These bubbles oscillate around their equilibrium radius and exist for many periods. They may grow by rectified diffusion [3] and eventually rise to the surface by buoyancy forces. Transient cavitation means the formation of bubbles that exist for less than one period of oscillation. These bubbles grow rapidly and collapse generating high local pressures and temperatures. This collapse is the reason for the destructive effects associated with cavitation.
It should be mentioned, that besides their variation in size, cavitation bubbles also oscillate spatially inside the liquid.
The two stages of cavitation - stable and transient cavitation - depend on the pressure amplitude applied to the liquid by the acoustic field. For both stages different thresholds exist [4]. For the onset of cavitation, a relatively low pressure amplitude is needed, which depends on the properties of the liquid. The perhaps better known threshold is the Blake threshold [5]. This threshold is the needed acoustic pressure amplitude that causes a bubble to expand rapidly, which is the case for transient cavitation. The Blake threshold always has a higher value than the threshold for the onset of cavitation.
1.2. Cavitation detection using frequency spectra
The two different stages of cavitation described above can be detected by differences in the frequency spectrum produced by the oscillating bubbles. Which different components appear in the spectrum of a cavitating liquid and how they arise will be explained in the following.
There are three main components in the frequency spectrum which are caused by different events. The distinguishing features are connected to the excitation frequency f0. Harmonics in the spectrum (nf0, n= 2, 3,…) can be explained by forced nonlinear oscillations of the bubbles [6]. Broad band noise is generated by shock waves of bubble collapses. Subharmonics (f0/m, m= 2, 3,…) and ultraharmonics (1.5f0, 2.5f0, …) are emitted due to non-linear bubble motion [7]. Bubbles, driven above their natural frequency, emit subharmonics, if the excitation frequency is an integral multiple of the natural frequency [8]. This statement is also encouraged in [9], where subharmonics of the driving frequency are created at low ultrasonic intensities by bubbles having twice the resonance size.
A distinction between stable and transient cavitation is possible as follows: The appearance of subharmonics at low excitation intensities and ultraharmonics at higher intensities are indicators for stable cavitation. The generation of broad band noise is an indicator for transient cavitation [7].
Measurements of the frequency spectrum in cavitating liquids are usually performed with hydrophones [7, 9], additional transducers [10] or microphones inside [11] or outside the liquid [6].
For the target application, an ultrasonic assisted high temperature casting process, measuring devices inside the liquid are not suitable, because they disturb the sound filed and commonly are not designed for high temperatures. A measurement with microphones is also not possible, because the sonicated liquid (melt) is acoustically shielded by the thermal insulation of the furnace or the casting mold. An alternative method for the measurement of the cavitation frequency spectra is monitoring the electrical signals of the ultrasonic transducers used for excitation. In [12] a feasibility study for this technique has already been conducted. Here the signals of an external microphone, a hydrophone and the transducer’s current signal are compared. In the transducer’s current Signal mainly subharmonics at 3/2f0, 5/2f0 and 7/2f0 are found as indicators for cavitation.
2. Experimental setup
In order to detect cavitation in melt by the indicators mentioned above during an ultrasonic assisted high temperature casting process, the self-sensing measurement technique is tested with the transducers in water before it is applied to the casting process. Two transducers with different horn geometries are used for the experiments. For both transducers the piezoelectric converter – the part which converts an electrical ac signal into a mechanical vibration – is identical. The first horn geometry is a cylindrical horn with 30 mm diameter and a step with a larger diameter at the center of the transducer, which is used for bearing. The second geometry is a so called Barbell horn [13], which allows high amplitude amplification, while keeping a large horn diameter. The Barbell horn’s diameter also is 30 mm and it also has a step with a larger diameter for bearing at the center of the transducer. Both transducers are Langevin type transducers driven at their third longitudinal resonance frequency. The transducers’ geometries are shown in Fig. 1.
For the results presented here the transducers were used after each other and the same measurements were conducted. For each transducer the horn’s tip was immersed into water, which was filled into a beaker. A linear stage was used to adjust the distance between the front face of the horns and the bottom of the beaker. Four different distances – 65 mm to 80 mm in 5 mm steps – between the horns’ faces and the bottom of the water filled beaker were adjusted. These distances lead to different attenuation levels of the horns and also lie in the range of a resonant distance for the driving frequency.
Fig. 1Transducers for high temperature application used for experiments

a) Cylindrical horn

b) Barbell horn
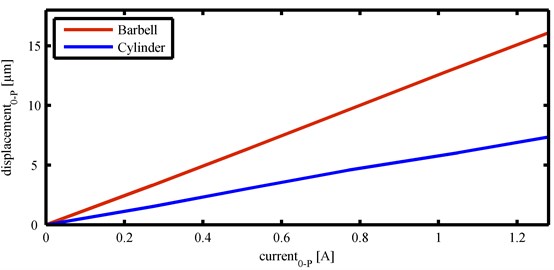
Both horn geometries were driven with different current amplitudes corresponding to different displacement amplitudes. The current amplitude was increased from 100 mA to 1000 mA in 100 mA steps. While the amount of water was kept constant at approximately 480 ml, the variation in current amplitude was performed for the four distances mentioned above. For both transducers the displacement amplitude-current characteristic was measured before driving them in water using a fiber-optic laser vibrometer (Polytec OFV-552 and vibrometer controller OFV-5000). As a result, a conversion factor of approximately 5 µm/A for the cylindrical horn and approximately 12 µm/A for the Barbell horn was determined. The results of these measurements are shown in Fig. 2.
Fig. 2Displacement amplitude-current characteristics for both transducers used in experiments
To drive the transducers a digital frequency and current controller (DPC 500/100k) [14] and a power amplifier (QSC-Audio RMX-4050) were used. Voltage and current signals were measured at the transducers’ terminals with a voltage-probe (Testec) and current-probe (Tektronix P6021) respectively. The voltage and current signals were recorded with a digital oscilloscope (Picoscope 5203), which was connected to a PC. Data were acquired in 20 kSample blocks with 1 MSample samplingrate. For each measured data block amplitude and frequency for the current and voltage signal were determined as well as the phase between current and voltage. Data were recorded for a period of 30 seconds for every excitation level.
In order to drive the transducers in resonance while a changing load is applied (submerging the horns into water and impedance changes caused by cavitation), the control hardware compensates the phase difference to zero caused by the load by computing the mechanical phase arg(Ymech) by compensating the parallel capacitance cp of the transducer. The measured values show the electrical phase arg(Yel) between current and voltage at the transducers terminals and are therefore different to zero, which would be the phase value in resonance for an unloaded transducer.
3. Results
The two horns described above were immersed in a water-filled beaker and for four different immersion depths measurements with 10 current amplitudes were performed. In this section the data obtained are analyzed.
3.1. Amplitude, frequency and phase
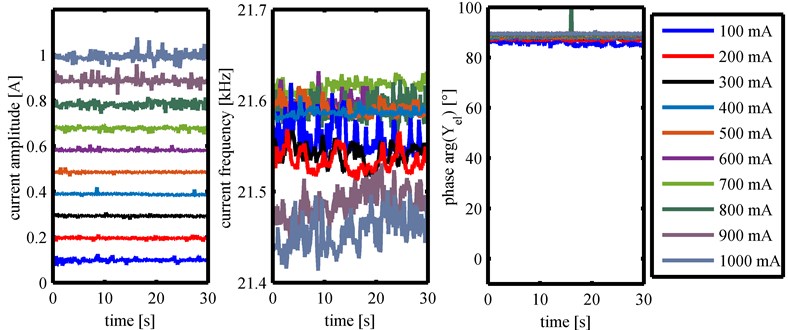
For the analysis of the recorded data first amplitude and frequency of each transducer’s current signal and electrical phase arg(Yel) are considered. As an example the above mentioned data are shown for a distance of 65 mm between the front face of the horns and the bottom of the beaker for all excitation levels for the cylindrical horn and the Barbell horn in Fig. 3 and Fig. 4 respectively. This distance represents the highest immersion depth for both horns which also means the highest attenuation.
Fig. 3Amplitude and frequency of transducer’s current signal and electrical phase for measurements with cylindrical horn at 65 mm distance
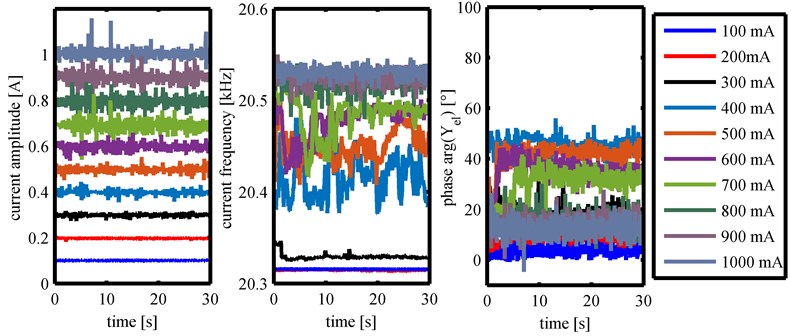
For both horn geometries, the set current amplitude is maintained with variations around the setpoint over the measuring time by the controller. These variations increase with increasing current amplitude. The frequency of the current signal also shows variations over time for both horn geometries. For the cylindrical horn the frequency is kept constant at similar values without major variation for 100 mA and 200 mA. A further increase in amplitude also causes an increase in frequency. The frequency variation is strongest for amplitudes between 400 mA and 700 mA. For the Barbell horn the frequency variations exist for all current amplitudes. Up to 300 mA an increase in amplitude results in a drop in frequency. For higher current values up to 700 mA, the frequency increases. Currents above this value then lead to a decrease in frequency below the frequency of the lowest current level.
The third quantity shown is the phase between the transducers’ current and voltage arg(Yel). For the cylindrical horn the phase value is close to zero for 100 mA and increases to a maximum value of approximately 50° for 400 mA. A further increase in amplitude leads to a decrease in phase. For the Barbell horn the phase value is close to 90° for each current level. For the three remaining immersion depths the amplitude values for the transducer with the cylindrical horn show the same behavior as for 65 mm distance.
The current’s frequency shows different behavior for each immersion depth. For a distance of 70 mm the frequency for 100 mA is reduced by almost 700 Hz to approximately 20.1 kHz by increasing the amplitude to 200 mA. For 300 mA no significant change to the frequency’s value occurs. For these three current intensities no major variations to the setpoint value are made by the control hardware. Increasing the amplitude level up to 1000 mA increases the frequency again up to approximately 20.5 kHz. At an amplitude level of 400 mA the most significant variations up to 300 Hz occur. At a distance of 75 mm the frequency of the 100 mA and 200 mA measurement show no major variations of the setpoint value, which has a similar value of approximately 20.74 kHz for both intensities. The 300 mA measurement shows a drop of approximately 20 Hz and variations by the control hardware. A further amplitude increases up to 500 mA decreases the frequency. Higher current intensities cause further significant changes. At the fourth distance of 80 mm the current signal‘s frequency at 100 mA shows slight variations around approximately 20.67 kHz. The 200 mA measurement shows similar behaviour, but the frequency value is approximately 10 Hz higher. Increasing the amplitude level causes the frequency to decrease, reaching its minimum of approximately 20.5 kHz at 700 mA. For 800 mA strong variations between 20.5 kHz and 20.64 kHz occur. The highest intensities of 900 and 1000 mA show little variations around 20.53 kHz.
For the Barbell horn the characteristics of the current amplitudes for the remaining three distances show no significant difference to Fig. 4. The setpoint values are reached and variations around this value increase with increasing amplitude. The frequencies of the current signals show the general tendency to decrease with decreasing load (increasing distance). At a distance of 70 mm the frequencies for the different amplitudes have values between 21.5 kHz and 21.37 kHz while decreasing with increasing intensity. The 100 mA curve shows variations in a range of 50 Hz. These variations are reduced with higher current amplitude to less than 10 Hz for the 400 mA curve and increase again from 700 mA to a maximum value of approximately 120 Hz for the 900 mA curve. For a distance of 75 mm the frequencies for the different amplitude values lie in a range between 21.33 kHz and 21.16 kHz. The frequencies of the three lowest amplitude levels show variations of approximately 40 Hz. For the 400, 500 and 600 mA curve the variations are reduced to approximately 20 Hz. A further increase in amplitude causes an increase of the variation having a maximum difference of approximately 120 Hz for 900mA. For a distance of 80 mm, which means the lowest load, the frequencies for the different intensities lie in a range between 21.23 kHz and 21.09 kHz. From 100 Hz to 600 kHz the frequency values reduce from approximately 21.19 kHz to 21.14 kHz each with a variation of approximately 10 Hz. A higher amplitude – 700 mA to 900 mA – lead to an increase in frequency and variation with values between approximately 21.23 kHz and 21.11 kHz. The frequency curve for an amplitude of 1000 mA has the lowest values varying between approximately 21.14 kHz and 21.09 kHz.
The phase curves for the distances 70 mm to 80 mm show no significant deviation from the ones shown in Fig. 4.
Fig. 4Amplitude and frequency of transducer’s current signal and electrical phase for measurements with Barbell horn at 65 mm distance
3.2. Frequency spectra
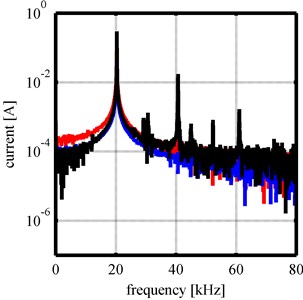
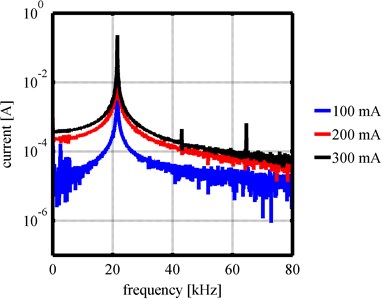
In order to find the already explained cavitation indicators related to the excitation frequency, the recorded data have to be transferred to the frequency domain. Therefore, a FFT was computed for every recorded data block. The analysis of the frequency spectra showed that an increase in amplitude lead to a higher amount of different frequency portions with pronounced amplitudes indicating cavitation events. For the two different horn geometries the frequency portions that showed elevated values in the frequency spectrum were different. A comparison between the computed frequency spectra for both horn geometries at a distance of 65 mm and current amplitudes of 100 mA, 200 mA and 300 mA is shown in Fig. 5.
Fig. 5Comparison between frequency spectra for cylindrical horn and Barbell horn at a distance of 65 mm for 100 mA – 300 mA
a) Cylindrical horn
b) Barbell horn
In Fig. 5(a) frequency spectra for the cylindrical horn are shown. The 300 mA curve shows pronounced peaks at the driving frequency (approximately 20 kHz), the first and second harmonic, ultraharmonics (approximately 30 kHz and 50 kHz) and a multiple of a subharmonic at approximately 45 kHz. Fig. 5(b) shows frequency spectra for the Barbell horn. Here the 300 mA curve shows pronounced peaks only at the driving frequency (approximately 21 kHz) and the first and second harmonic. Although the Barbell horn has a higher amplitude amplification, which leads to higher amplitudes for the same current amplitude compared to the cylindrical horn, and therefore generates higher pressures, fewer pronounced frequency portions can be found in the frequency spectra as indicators for cavitation activity.
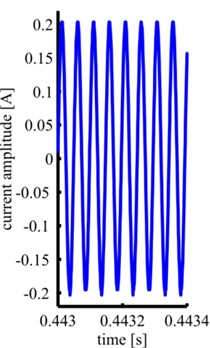
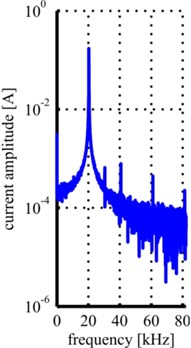
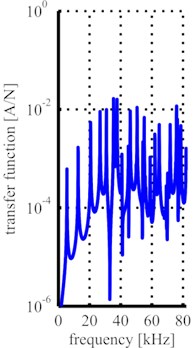
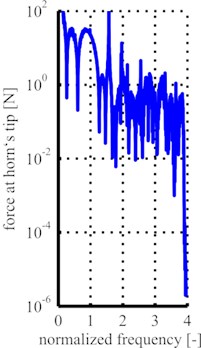
As both transducers were designed to work in resonance, their sensitivity towards events at their tips is high at their resonance frequencies e.g. the driving frequencies and multiples of the driving frequencies. This sensitivity affects the measurements at the transducers terminals, because the recorded data have been influenced by the transducers transfer function. In order to obtain the actual uninfluenced signal at the tip of the horns, the measured data are processed in the frequency domain. Therefore, the FFTs are evaluated with the transducers transfer functions. The transfer functions are calculated using a finite element program. For these calculations a harmonic load with normalized force amplitude of 1N is applied to the front face of the horn and the current at the transducers’ terminals is calculated. In this manner the transfer function from the tip of the horns to the electrical terminals is acquired. The evaluation process to acquire the uninfluenced signal spectrum at the tip of the transducers’ horns is shown in Fig. 6. From the recorded current signal (Fig. 6(a) shows an excerpt of a measurement with the cylindrical horn at 65 mm distance and 200 mA current amplitude) a FFT is calculated (Fig. 6(b)) and the resulting frequency spectrum is evaluated with the transducer’s transfer function (Fig. 6(c)). The resulting frequency spectrum (Fig. 6(d)) is used for further evaluation.
Fig. 6Process of signal evaluation (example: 200 mA at 65 mm distance): a) excerpt of recorded current signal, b) FFT of recorded current signal, c) transducer’s transfer function, d) evaluated frequency spectrum
a)
b)
c)
d)
The analysis of the current frequency showed that the driving frequency and thus also the cavitation indicators related to the driving frequency vary during cavitation generation. Therefore, the evaluation using the transfer function needs to be adapted for every recorded data block. Both frequency spectra used for evaluation – the FFT of the measurement and the calculated transfer function – are normalized to the frequency of the third longitudinal resonance. In the FFT of the measurement this is the actual driving frequency and in the transfer function this is the calculated frequency which corresponds to the eigenfrequency used for driving. For further processing it is assumed that the system behavior is only shifted in the frequency domain by the changing load. The normalized transfer function is fitted to the frequency axis of the normalized FFT. After this step both normalized curves have the peak of the driving frequency at position “1” and frequency steps are consistent. The final evaluation is the division of the FFT data by the transfer function. This leads to the uninfluenced signal, which represents the force at the tip of the horns.
For low frequencies the transducers’ transfer functions show values close to zero. A force at the tip of the horns with low frequencies corresponds to rigid body motion and therefore generates a low current. By dividing the FFT data of this low frequency range by the transfer functions values, which are close to zero, the values in the evaluated frequency spectra become close to infinity. For this reason and because low frequencies below one fourth of the driving frequency are not considered important for cavitation detection, this frequency region is not considered for further analysis.
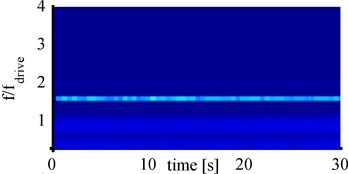
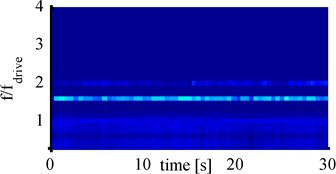
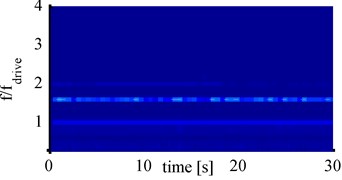
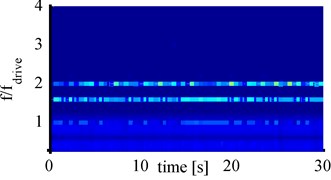
The analysis of amplitude, frequency and phase data has shown that the process of cavitation generation fluctuates over time. Visual observations of cavitation events during the experiments also showed spatial and temporally variations. For this reason, spectrograms showing the frequency content during each measurement are computed. The frequencies computed from the measured data for all four distances for 100 mA amplitude are shown over the measurement time in Fig. 7. For all spectrograms shown in the following the frequencies are normalized to the driving frequency (f/fdrive) and values exceeding 200 N are cut and shown in dark red.
In Fig. 7 for all four distances a component at 1.6fdrive is present and shows the highest intensity over the measurement time. Also the first harmonic stands out of the surrounding frequencies over the entire time for all four distances. For 80 mm distance the first harmonic has a varying intensity which reaches a similar intensity as the ultraharmonic at 1.6fdrive. While the 75 mm curve shows an elevated frequency band around the driving frequency, the other three spectrograms show a wider elevated frequency band around the driving frequency and an additional elevated frequency band around the 0.5fdrive subharmonic, which has the same intensity as the band around the driving frequency.
Fig. 7Spectrograms for 100 mA with cylindrical horn at: a) 65 mm, b) 70 mm, c) 75 mm, d) 80 mm
a)
b)

c)
d)
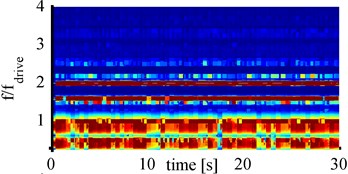
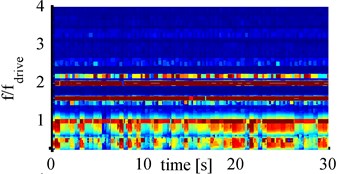
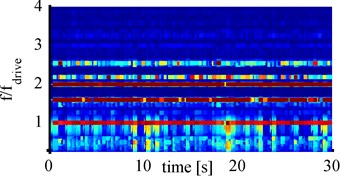
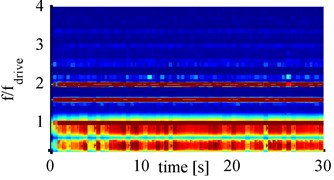
Fig. 8Spectrograms for 1000 mA with cylindrical horn at: a) 65 mm, b) 70 mm, c) 75 mm, d) 80 mm
a)
b)

c)
d)
To find out which frequency components are present at high cavitation activity in the evaluated transducer signal, the spectrograms of the cylindrical horn at 1000 mA amplitude are analyzed and shown in Fig. 8. Compared to the 100 mA spectrograms the 1000 mA spectrograms show many different frequency components with different intensities. For all four distances the driving frequency, 1.6fdrive and the first harmonic are pronounced over the entire measurement period and show the highest intensities. All spectrograms show further pronounced frequency component at 2.2fdriveand 2.5fdrive, which have varying intensity over the measurement time. These components have the least intensity for 85 mm distance and the highest intensities for 75 mm. The distinct frequency bands around fdrive and 0.5fdrive also show high intensities, varying over the measurement time. At 75 mm distance these frequency bands show the least intensities. These two frequency bands can be considered as broadband noise and therefore as indicator for transient cavitation. In the 1000 mA spectrograms also less pronounced frequency components below 3fdrive, and around 3.2fdrive are present. The numerous added frequency components – compared to the 100 mA measurements – suggest strong bubble movements.
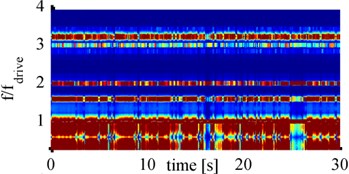
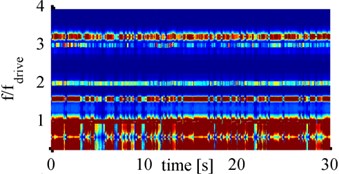
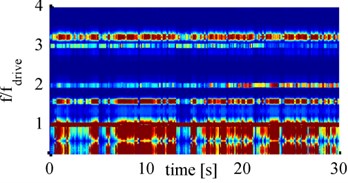
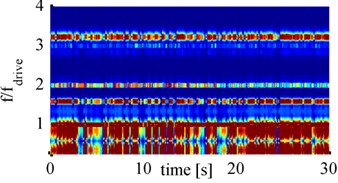
So far, only spectrograms for the cylindrical horn were considered. For comparison, now spectrograms that have been computed from measurements with the Barbell horn are considered. To analyze which frequency components are present for strong cavitation activity the spectrograms for all four distances and 900 mA amplitude are shown in Fig. 9.
All four spectrograms show the same frequency components but with partially different intensities and variations over time. Besides fdrive and the first and second harmonic (2fdrive and 3fdrive) also 1.6fdrive and 3.2fdrive components are present. In addition, the frequency band around fdrive and 0.5fdrive, corresponding to broad band noise, stand out clearly. These two frequency bands seem to be wider than for the cylindrical horn, as the boundary between them is smaller or even completely disappears. This is due to the higher displacement amplitudes of the Barbell horn and therefore higher pressures levels in the fluid.
Fig. 9Spectrograms for 900 mA with Barbell horn at: a) 65 mm, b) 70 mm, c) 75 mm, d) 80 mm
a)
b)

c)
d)
4. Conclusions
With two ultrasound transducers, which differ only in the geometry of their horns, cavitation was generated and the same measurements were carried out under otherwise identical conditions and the results were evaluated. The amplitude, frequency and phase data show, that it was possible to drive the transducers under different load conditions. Different immersion depths of the horns and impedance changes inside the sonicated fluid, which becomes a two-phase fluid when cavitation is generated, were the reasons for the different load conditions.
The recorded data were further analyzed in the frequency domain, normalized to the driving frequency and evaluated with the transducers’ transfer functions. Spectrograms were computed to identify the frequency components, which are present over the measurement time in the measured signals. Although the evaluation with the transfer functions should eliminate transducer specific sensitivities, for strong cavitation the spectrograms for both transducers show differences. While for the cylindrical horn only the first harmonic can be found in the spectrograms, also the second harmonic is present for the Barbell horn. Ultraharmonics are not present for both horns but a frequency component with 1.6fdrive is found, which is supplemented by a 3.2fdrive component for the Barbell horn. For both geometries the spectrograms show two wide frequency bands below the driving frequency with high intensities, which are known to be indicators for transient cavitation.
For further investigations video or photo studies have to be conducted to connect the different frequency components and the variations of the intensities of the frequency components over time with cavitation events. With the knowledge about the cavitation events, which are linked to the frequency components, the self-sensing technique can be applied to the casting process.
References
-
Neppiras E. A. Acoustic Cavitation. Physics Reports, Vol. 61, Issue 3, 1980, p. 159-251.
-
Apfel R. E. Acoustic cavitation inception. Ultrasonics, Vol. 22, Issue 4, 1984, p. 167-173.
-
Hsieh D.-Y., Plesset M. S. Theory of rectified diffusion of mass into gas bubbles. The Journal of the Acoustic Society of America, Vol. 33, Issue 206, 1961.
-
Neppiras E. A. Acoustic cavitation thresholds and cyclic processes. Ultrasonics, Vol. 18, Issue 5, 1980, p. 201-209.
-
Atchley A. A. The Blake threshold of a cavitation nucleus having a radius-dependent surface tension. The Journal of the Acoustic Society of America, Vol. 85, Issue 1, 1989.
-
Cramer E., Lauterborn W. Acoustic cavitation noise spectra. Applied Science Research Vol. 38, 1982, p. 209-214.
-
Ashokkumar M., Hodnett M., Zeqiri B., et al. Acoustic emission spectra from 515 kHz cavitation in aquenous solutions containing surface-active solutes. Journal of the American Chemical Society, Vol. 129, 2007, p. 2250-2258.
-
Neppiras E. A. Measuring in liquids at medium and high ultrasonic intensities. Ultrasonics, Vol. 3, Issue 1, 1965, p. 9-17.
-
Frohly J., Labouret S., Bruneel C., et al. Ultrasonic cavitation monitoring by acoustic noise power measurement. The Journal of the Acoustic Society of America, Vol. 108, Issue 5, 2000.
-
Vaughn P. W. Investigation of acoustic cavitation thresholds by observation of the first subhamonic. Journal of Sound and Vibration, Vol. 7, Issue 2, 1968, p. 236-246.
-
De Santis P., Sette D., Wanderlingh F. Cavitation detection: the use of the subharmonics. The Journal of the Acoustic Society of America, Vol. 42, Issue 2, 1967.
-
Bornmann P., Hemsel T., Sextro W., et al. Non-perturbing cavitation detection / monitoring in sonochemical reactors. Proceedings IEEE IUS, 2012, p. 1141-1144.
-
Peshkovsky S., Peshkovsky A. Matching a transducer to water at cavitation – acoustic horn design principles. Ultrasonics Sonochemistry, Vol. 14, Issue 3, 2007, p. 314-322.
-
Ille I., Twiefel J. Model-based feedback control of an ultrasonic transducer for ultrasonic assisted turning using a novel digital controller. Physics Procedia, Vol. 70, 2015, p. 63-67.

