Abstract
A new algorithm to simulate shoreline movement at general planar coastal morphology is proposed here. Two limiting slopes and a reference level are involved in this algorithm. If beach slope exceeds a certain value during numerical morphological modelling, the beach profile undergoes correction by moving some sediment volume to underwater zone. If beach slope becomes smaller than the other slope, the beach profile is corrected by moving some sediment volume to onshore zone. Final adjustment is carried out to sort out three-dimensionality. The algorithm is applied to a laboratory experiment showing tombolo generation behind a detached breakwater, and demonstrates its usefulness with reasonable accuracy.
1. Introduction
Most existing wave-period-average area models lack the function of shoreline movement. First, landside grid points above mean-sea level do not experience sediment transport in the models, because they are numerically dry. Second, even if sediment transport happens on those grid points by some reasons, e.g. due to long-period oscillation or tidal motion, the beach slope is not properly controlled due to lack of adequate algorithm. Inter-wave-phase models have better capability to simulate sediment at swash zone, but requires long CPU.
There have been a few trials to incorporate shoreline movement induced by alongshore transport in wave-period-average area models. These trials could further be classified into two types: methods for shoreline retreat only (Group I in Fig. 1), and for both retreat and advance (Group II in Fig. 1.). The type for shoreline retreat includes the “dry-wet cell method” [1], the “cut-cell method” [1], the “avalanching method” [2], and the “diffusion method” [3].
The diffusion method is useful to mitigate bed slope field. However, choosing proper diffusion coefficient is another heavy task of this method [3].
Fig. 1Classification of shoreline treatment methods in area model
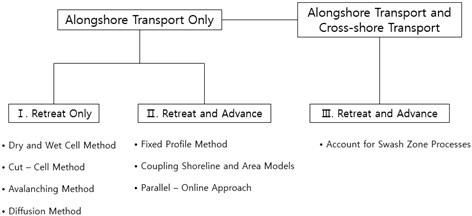
The shoreline retreat due to excessive erosion has been modelled by the above methods, while shoreline advance has been tried using other methods instead of expanding the above methods valid for retreat only. Recently, shoreline approach and area models coupling approach and parallel-online approach [4-6] have been tried, basically to improve accuracy of the shoreline model by making use of area model results through some interfaces or many online models, so that more refined long term morphological change around complex structures has become possible. However, if a short-term of medium-term area model includes a general shoreline-moving function, the computation process may be that information from the area model is supplied into the line model, and the reverse seems not much helpful.
Jorissen [7] proposed an algorithm called “fixed profile approach” for morphological change around a groin, where both shoreline retreat and advance are involved. The method proposed by Jorrisen has been applied to parallel contoured morphology so far. Jorissen tried to predict shoreline movement while running Delft3D-RAM area model. His approach is more of less one-dimensional adjustment of each cross-shore line perpendicular to the originally straight shoreline. Their methods need further extension for general two-dimensional morphology. The fixed profile approach needs further refinement in two aspects. First, the profile control should be done along steepest cross-sections for arbitrary coastal morphology. Second, some allowance may be given to the beach slope to vary within a range, instead of preserving initial profile for the whole period of simulation.
2. Reconstruction of beachface profile in one-dimensional way
Here a new algorithm is proposed for general morphology with flexible beachface slope by modifying Jorissen’s method.
Typical beach profile could be represented by a few straight lines, see Fig. 2. A beach profile is composed of a berm, beachface, terrace, and offshore slope. We assume that the beachface slope varies within a range between that one for eroding stage and the other for deposition stage.
If the beachface slope tends to become steeper than the upper limit, we need to correct the beachface slope and vice versa. Let’s look at the one-dimensional aspect of the new algorithm first, and move on to its expansion for general areas.
Fig. 2Typical beach profile on Korean eastern coasts
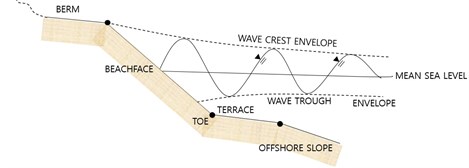
Fig. 3Reconstruction of beach profile for deposition and erosion phases
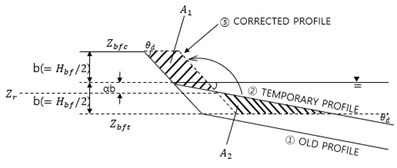
a) Deposition phase
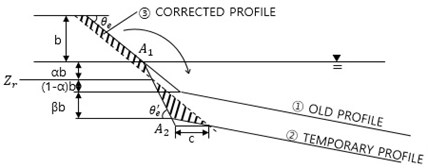
b) Erosion phase
We start from a one-dimensional problem. There are three possible developments on the beach profile: more or less neutral, depositing, and eroding phases. If neutral, it is not of concern. If it is in depositing phase, deposition happens below mean water level. Because nonlinear wave action above the mean sea level is not properly treated in wave-period-average equations, sediment transport and morphological change happen only below the mean sea level, see Fig. 3(a). In Fig. 3(a), we get newly-developed beach profile (②) after some model execution with the old profile (①). The frequency of reconstructing process need not be every time step for sediment transport.
Assume beachface slope does not decrease below a certain limit due to wave cross-shore action. Then, we intentionally move some sediment volume from underwater zone to a high dry zone. Sediment volumes of both sides should be identical. Then:
where is half of the beachface height, is the lower limit slope, is the temporary slope milder than the limit slope, and is the portion of the height of neutral position where both volumes become identical relative to the beachface height. As , we get 0.25.
When sea bed gets eroded during numerical simulation, the beachface slope below the mean water level cannot be sustained due to excessive erosion. Then, similar correction algorithm to the deposition case is needed. In Fig. 3(b), some sediment volume at dry zone is intentionally moved to the underwater zone, so that the beachface slope is maintained not steeper than the upper limit slope, . Differently from the deposition case, the bed level for imported sediment is not fixed but dependent on the newly formed surrounding bed level, which means we need another parameter for correction. The cutting section area and the dumping section area are:
where is a proportion of the ambient depth under erosion relative to the beachface height. and should be identical for sediment mass conservation, which leads:
becomes 0.25 for 0, when the average erosion depth at surrounding bed is zero.
For both deposition and erosion phases, the assumptions adopted are valid, if the cross-sections are parallel. However cannot simply be guessed, considering complex profile shape, and three-dimensionality of the problem.
Fig. 4Checking up bed slope at a grid cell above the reference level
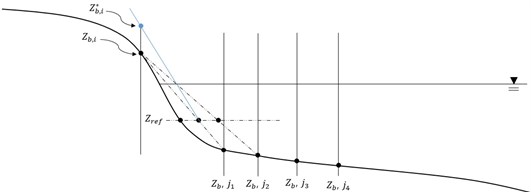
We assume that and the underwater level of reference is given as constant as a priori. Then, we need to examine the bed level at a grid cell. We have a grid cell the height of which is higher than the reference level, but is lower than the berm. We want to know whether overall slope between the cell and the position with the reference level. Because only depths at grid cells are available, we examine many grid cells below the reference level, but higher than the beachface toe, based on an assumption that the bed slope is more or less straight, especially around the reference level, see Fig. 4.
By using linear interpolation. The distance from the point of interest to the reference level is found as:
We get many positions of the reference level from many interpolations, and choose the shortest distance. If the bed profile is convex, the shortest distance may be found from the nearest grid cell below the reference level, which is common case. Then, we compare the bed slope with the minimum slope. If the newly-found bed slope is smaller than the minimum slope, we need to correct the bed level at the grid cell by expanding the minimum bed slope along the distance. This correction method repeats for the grid cells of interest below the reference level and the beachface toe.
Second correction of morphology to check the maximum slope is needed after the first correction for minimum slope to treat excessive erosion problem. The procedure is similar to the minimum slope case; the reference level for erosion is different from that for deposition, and the limit slope for erosion should be applied instead of the limit slope for deposition.
Fig. 5Flow chart for adjusting bed levels using minimum slope

3. Expansion of morphological reconstruction for area problem
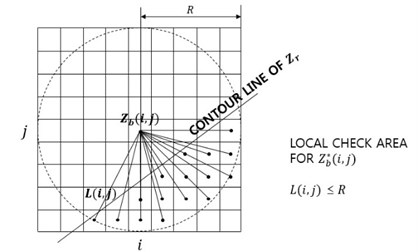
The algorithm to correct the bed level for one dimensional domain cannot be directly applied to general two-dimensional morphology. Thus, we need to find the control sections at general morphology to apply the above algorithm. We examine the bed level at a grid cell. An underwater level of reference is given at the start.
The correction must be carried out along steepest slope sections, considering the beach cross-shore characteristics. This becomes possible to involve many grid cells for comparison within a circle of a radius, centered at the grid cell of interest, see Fig. 6. The grid cell with the shortest distance indicates the steepest slope, and the normal control cross-section. This finding of the cross-section may not be perfect, but might be acceptable from the numerical point of view, if morphological resolution is fine enough.
Fig. 6Finding control cross-section from many cells below reference level
4. Adjustment for total sediment main bed
A few assumptions involved in the present approach may violate sediment mass conservation rule. First, the present algorithm is based on an assumption that a profile is composed of a few straight lines, which is not true at arbitrary time. Second, the reference level for eroding phase includes an additional parameter related to ambient bed depth, which may not be very accurate. Furthermore, the beach is not straight in general from the planar point of view. Therefore, total sediment volume source or sink caused by depth correction is computed at correction-involved grid cells, and adjustment is carried out there to conserve the total sediment mass:
where is the area of cell ), is their sum, is the depth increment at cell ), and is the adjustment depth at cell ).
5. Application of the present slope-limiting algorithm
The new algorithm to reshape beach morphology is applied to a laboratory experiment on shoreline movement due to waves behind a detached breakwater [8], see Table 1.
Table 1Conditions for shoreline experiment [8]
Test | (m) | (m) | (cm) | (s) | (m) | (m) | |
7 | 1.50 | 0.90 | 5.00 | 0.85 | 0.335 | 0.044 | 0.557 |
– deep water wave height; – deep water wave steepness; – wave period; – deep water wavelength; – water depth in the wave basin; – length of the breakwater; and – distance of the breakwater to the initial shoreline | |||||||
A tombolo developed behind the breakwater for case 7 during the laboratory experiments. A wave-period-average approach with the function of shoreline movement may be a practical option. A wave-period-average flow and morphological change model, CST3D-2015, is chosen for simulation of the shoreline movement of this case. CST3D-2015 is the updated version of CST3D-2013 [9] which incorporates the present algorithm.
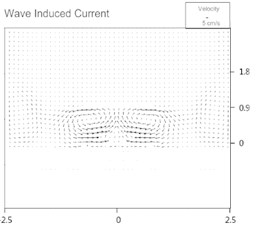
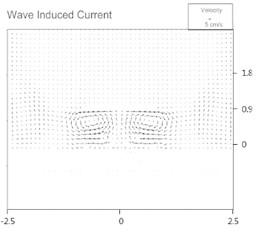
Choosing parameters , , , , , as 0.073, 0.088, 0.04 m, 0.25, 0, respectively, CST3D-2015 produced morphology every 6 minutes. The computed wave-induced surface and bottom current fields are shown in Figs. 7(a) and (b), respectively. Two distinct wakes develop behind the breakwater. The bottom flow is more off shoreward, represents the undertow trend.
Fig. 7Computed wave-induced current fields
a) Top layer
b) Bottom layer
Fig. 8Computed morphology after 19 h
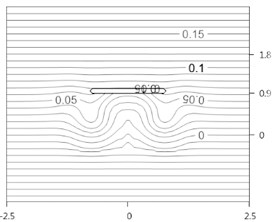
The computed morphology after 19 h is shown in Fig. 8. The shoreline advances behind the breakwater, and retreats outside the breakwater lee. The computed shorelines after 9.5 and 19 h are shown in Fig. 9(a), and the latter was compared with measurements, in Fig. 9(b). The agreement is in proper direction, although still a large gap remains between the two.
As time passes by, straight shoreline starts to become curvy due to erosion around the two strong circulations behind the breakwater, and deposition along the central line. The shoreline along the central line keeps on proceeding, but does not touch the breakwater at time of 19 h like experiment. It is presumed that the difference may have come from the fact that the present algorithm does not consider delicate cross-shore transport mechanism. However, it is promising that the present algorithm can simulate shoreline movement qualitatively for this experiment of tombolo formation.
Fig. 9Development of shoreline and comparison with measurements
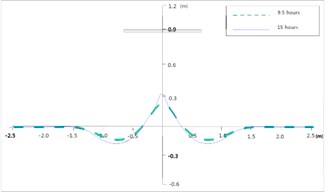
a) Computed shorelines
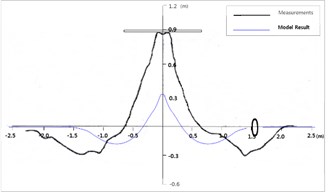
b) Comparison
6. Conclusions
Wave-period average flow and sediment transport model has not satisfactorily reproduced shoreline movement, especially shoreline advancing problem. Field beachface at a site is normally confined within a range between an upper limit during erosion phase and a lower limit during deposition phase. An algorithm to reconstitute beach profile was proposed here. We need two reference levels for deposition and erosion which don’t change during reconstruction, and divide the profile into two; one for artificial cutting, and the other for artificial dumping. The profile reconstruction was carried out along control cross-sections by using “many points checking method”. The present algorithm was then verified against a laboratory morphologic change around a detached breakwater, and the results proved useful to reproduce shoreline advance.
References
-
Roelvink J. A., Lesser G., Van der Wegen M. Morphological modelling of the wet-dry interface at various timescales. Proceedings ICHE Conference, Philadelphia, 2006.
-
Sanchez-Arcilla A., Sierra J. P., Lo Presti A. An attempt to model longshore sediment transport on the catalan coast. Coastal Engineering, Vol. 190, 1994, p. 2625-2638.
-
Watanabe A., Maruyama K., Shimizu T., Sakakiyama T. A numerical prediction model of three-dimensional beach deformation around a structure. Coastal Engineering in Japan, Vol. 29, 1986, p. 179-194.
-
Van Koningsveld M., Van Kessel T., Walstra D. J. R. A hybrid modelling approach to coastal morphology. Coastal Dynamics Conference, Barcelona, Spain, 2005.
-
Shimizu T., Kumagai T., Watanabe A. Improved 3-D Beach evolution model coupled with the shoreline model (3D Shore). Coastal Engineering in Japan, Vol. 220, 1996, p. 2843-2856.
-
Walstra D. J. R., Van Rijn L. C., Boers M., Roelvink J. A. Offshore sand pits: verification and application of hydrodynamic and morphodynamic models. Proceedings of 5th International Conference on Coastal Sediments, ASCE, Reston, Virginia, 2003.
-
Jorissen J. G. L. Strandhoofden Gemodelleerd in Delft3D-RAM. M.Sc. Thesis, Delft University of Technology, 2001, (in Dutch).
-
Ming D., Chiew Y.-M. Shoreline changes behind detached breakwater. Journal of Waterway, Port, Coastal, and Ocean Engineering, Vol. 126, 2000, p. 63-70.
-
Kim H. User Manual of CST3D-2013-v1. Haksan Media, 2013.
About this article
This work has been supported by KIMST as research projects, “Marine and Environmental Prediction System (MEPS)” in 2013, and “Development of Coastal Erosion Control Technology (MIDAS)” in 2015.
