Abstract
The seismic behavior of subway and highway tunnel has been an important topic followed the seismic damages of several structures in recent large earthquakes. Soft layer is often encountered in engineering site, and it is often located with normal strata. There have been limited literatures concerned on seismic performance of subway station with the presence of soft layer. Flac3D is employed to investigate the effect of soft layer on seismic response of subway station structure in earthquake. The effect of soft layer locating below subway station is firstly studied. Then the seismic response of subway station against location of soft layer is further investigated. The relative displacement, acceleration and safety factor of secondary lining, and internal force of central column are highlighted. It is found from numerical results that effects of the two cases are similar when soft layer locates below or above subway station and both beneficial for improving the safety of subway station compared with the case without soft layer. The case when soft layer locates below subway station is more preferable than the case above. It is also found that in the case when soft layer is within the range of subway station, it will greatly amplify the acceleration and internal force of secondary lining, especially for the part that is close to soft layer, and the influence degree gradually decreases with the increase of relative distance to soft layer. As a result, soft layer is generally beneficial for improving stability of subway station, but it should be avoided to be located within the range of subway station to ensure the stability of subway station.
1. Introduction
With the rapid development of urban cities, the available land for infrastructure construction is more and more rare. Considering the need to develop more efficient traffic system in congested urban cities, more and more subways are under construction in recent years. Unlike highway tunnel, subway station has the characteristics of large span and shallow buried depth. Underground structures are generally considered to be more earthquake-resistant than superstructures [1]. In recent years, many great earthquakes happened worldwide. Serious damage can be found in superstructures in earthquake, which brings great economic losses and casualties. In order to investigate the seismic performance of superstructures and to guide the earthquake resistance design, many scholars have devoted to study the seismic behavior of superstructures through theoretical analyses, numerical simulation, and physical model test and have obtained many valuable results [2-5].
In the past decades, fewer damages to large underground structures were reported in earthquake compared with the surface structures [6]. However, followed the several severe earthquakes in recent years, earthquake-induced damage to underground structures was recorded. For instance, the serious damage induced by Kobe earthquake on Dakai subway station in 1995 in Japan [7]. In the 1999 Taiwan earthquake, mountainous tunnel in central Taiwan suffered serious seismic damage [8]. Additional, the serious damage induced by earthquake was also reported in the Duzce earthquake in Turkey and the Wenchuan earthquake in China. Experience from major earthquake events reveals that earthquake propagation can cause serious damages to underground structures. Unlike surface buildings, the subway station is covered by rock masses. The relative interaction between subway station and surrounding rock masses is more complex than that of surface buildings. Generally, the huge stiffness differences between subway station and surrounding soil will greatly affect the original ground motions, and this has been widely accepted.
To reduce the seismic damage of underground structures, corresponding earthquake resistance design of large underground structures has received considerable attention. The seismic response of tunnel has been investigated by many researchers through theoretical analyses, numerical simulations, and laboratory tests [9, 10]. For example, dynamic numerical analyses have been conducted to investigate the load transfer mechanisms between the underground structure and the surrounding soil, so as to identify the causes for different behaviors of similar sections subjected to the same seismic loading [11]. Gazetas G. (2005) investigate the response of three Athens metro underground structures in the 1999 Parnitha earthquake through analyzing seismic data that was recorded during earthquakes [12]. Chen et al. (2015) studies the damage mechanism of a subway structure in soft soil while experiencing strong ground motions through performing shaking table tests, and present a simplified method to quantitatively evaluate the seismic damage of subway structures in soft soil [13].
It can be found that the existing researches are generally conducted on the assumption that the physical and mechanical properties of soil are homogeneous. However, the formation lithology in engineering site usually consists of different layers of soil in reality, and the most common situation is that soft layer is within the normal strata. Based on the fluctuation theory, transmission and reflection will be generated when seismic wave reaches the interface of soft layer and normal strata. This can be explained that the elastic modulus of soft layer is lower than surrounding soil, and the energy of seismic wave will be absorbed through large deformation of soft layer. Besides, part of seismic wave will be reflected due to the difference of transmission coefficient in two different layers. Consequently, the intensity of seismic wave will be greatly decreased when it passes through soft layer. Some scholars have studied the effect of soft layer on ground motions through theoretical calculation, laboratory experiments, and numerical simulation [14-16]. The existing literatures mainly focus on highlighting the influence of soft layer on ground motions and seismic behavior of surface building. There have been limited studies concerning the related seismic behavior of subway station when soft layer exists in engineering site.
In this study, the Finite Difference software Flac3D is employed to carry out numerical simulation to investigate the effect of soft layer on seismic behavior of subway station. The seismic response of secondary lining and internal structures in subway station is highlighted. Firstly, the computed results including relative displacement, acceleration and safety factor of secondary lining, and internal force of central columns in two cases with and without soft layer are compared to study the effect of soft layer locating below subway station on seismic behavior of subway station. Then the effect of soft layer location is further investigated through establishing another two numerical models with different soft layer location.
2. Material and method
2.1. Calculation method of internal force and safety factor of tunnel lining
Generally, the three-dimensional solid zones are usually chosen to simulate tunnel lining during numerical simulation, for the reason that solid zones can better simulate the relative interaction between tunnel lining and surrounding soil than structural elements. But it has the disadvantage that the internal force of secondary lining cannot be directly obtained. The internal force especially the axial force and bending moment of secondary lining are important for evaluating stability of secondary lining, and are the main indicators to calculate reinforcement. A fish command is written to conveniently calculate the axial force and bending moment of secondary lining through the obtained stress of solid zones. The obtained internal force can be then used to calculate safety factor of secondary lining. Based on the finite element theory, the calculated stress of solid zones reflects the stress state of the center points in solid zones. In other words, the stress in the center point of zones is accurate, and the stress in the boundary of solid zones is extrapolated through the stress in the center point. In the following parts, the computational method of stress in the boundary of solid zones, and the determination of safety factor is described in detail.
In order to calculate the internal force of secondary lining, the secondary lining is divided into two layers, with the thickness ranges from 20 to 40 cm, which is dependent on the thickness of secondary lining. In numerical model, the secondary lining is divided into two layers to calculate the internal force of secondary lining. Note that the secondary lining had better to be meshed using hexahedral element to improve the calculation accuracy. The stress and coordinates of the adjacent solid zones in secondary lining is shown in Fig. 1. The x-y represents the global coordinate system, while the n-s represents the local coordinate system. The angle between the s direction and x direction is defined as α. It can be calculated according to the coordinates of solid zones through Eq. (1). Then the normal stress in the n direction of the discussed zone can be calculated by using Eq. (2):
where, (x1,y1), (x2,y2) are the coordinate of center point:
where, σx, σy,σxy is the stress components of the discussed zones.
Fig. 1Stress in the global and local system
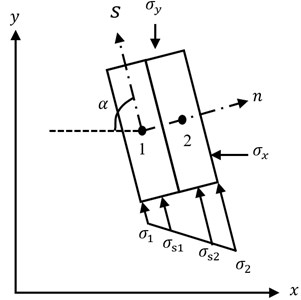
The normal stress in the boundary of discussed zone is defined as σn1 and σn2, respectively (as shown in Fig. 1). Based on the theory of structural mechanics, the normal stress changes linearly along the boundary of solid zones. Thus, the stress in the outer boundary of these two discussed zones can be extrapolated by using Eq. (3) and Eq. (4), respectively:
where, σ1 is the stress in the outer boundary of zone 1, σ2 is the stress in the outer boundary of zone 2, σs1,σs2 is the stress of zone 1 and 2 in the center point, ε represents the layers of solid zones. It is 0.5 when the secondary lining is divided into two layers.
Based on above calculated results, the bending moment and axial force can be calculated by using Eq. (5) and Eq. (6), respectively:
where, M and N are the bending moment and the axial force of the discussed section, respectively. b and h are the width and thickness of the discussed section, respectively.
According to the calculated internal force of tunnel lining, the safety factor of tunnel lining can be calculated to assess the safety of tunnel lining. According to Code for Design of Road tunnel [17], the safety factor of secondary lining is defined as the ratio of ultimate compressive strength to the actual internal force. The ultimate compressive strength is dependent on the failure mode of secondary lining. And the failure mode can be determined according to the eccentric distance e, which can be calculated through Eq. (7):
If e is less than 0.2h, then the ultimate compressive strength of tunnel lining can be calculated by using Eq. (8):
where, Nu is the ultimate compressive strength, Ra is the compressive strength of concrete, φ is the longitudinal coefficient of tunnel lining, it can be taken as 1.0 for tunnel, α is the influence coefficient of axial force, and can be calculated through Eq. (9) which is an empirical formula:
When the eccentric distance e is larger than 0.2h, tunnel lining may be tensioned and damaged, and the ultimate compressive strength can be calculated through using Eq. (10):
where, R1 is the ultimate tensile strength of concrete.
2.2. Project description
Fengtianlu subway station of metro line 1 in Chongqing is selected to study the effect of soft layer on seismic behavior of subway station. Based on geological surveying report, a soft layer is located in the lower part of subway station, with the thickness of approximate 2 m. The altitude of it is approximately level, and the relative distance between subway station and it is about 6 m. The designed width and height of Fengtainlu subway station are 22 m and 24 m respectively. The thickness of secondary lining is 0.6 m. An island platform is designed and the thickness of the plate is 0.5 m. The concrete girder is transversely constructed, with the size of 1.0 m×1.2 m. The secondary beam is designed along the longitudinal direction of subway station, with the size of 0.8 m×0.5 m. Column is designed to bear load transferred from concrete girder. The size of central columns is 0.8 m×0.8 m, with the center to center spacing of 8.4 m.
2.3. Numerical modeling
Considering the length of subway station is much larger than the size of cross section. The study is simplified as a plain strain problem. The established numerical model is shown in Fig. 2. To reduce the effect of boundary on calculation results, the lateral distance between horizontal boundary and subway station is selected as 64 m (about 3 times of the diameter of subway station). The length and height of subway station are 150 m and 70 m, respectively. Note that, the blue zones represent soft layer, while the red zones represent normal strata. Fig. 2(b) described the mesh of secondary lining and internal structures in subway station. The secondary lining is divided into two layers to facilitate the calculation of internal force. Surrounding rock masses and secondary lining are both simulated using solid elements, while internal structures in subway station including beams and columns are simulated using structural beam element. The structural elements are rigidly connected with solid elements. Totally, the established model is composed of 4385 zones and 65 structural elements. The central column in the island platform is simplified to a longitudinal wall in numerical model. Thus the elastic modulus of central columns should be reduced based on the equivalent stiffness principle. The local damp is selected to simulate the damping of rock masses. Based on site geological conditions and local engineering experiences, the damp of solid zones and structural zones are set as 0.05 and 0.02, respectively. The free field boundary combined with displacement boundary is applied around numerical model. The earthquake excitation is applied in the bottom of numerical model. In numerical simulation, the normal stratum and soft layer bot obey the Mohr Coulomb criterion. The structures in subway station including plate, beams and columns are simulated conform to linear elastic constitutive model. According to the geological survey report, the physical and mechanical parameters of materials in numerical simulation are listed in Table 1, which are chosen according to geological survey report.
Fig. 2Numerical model
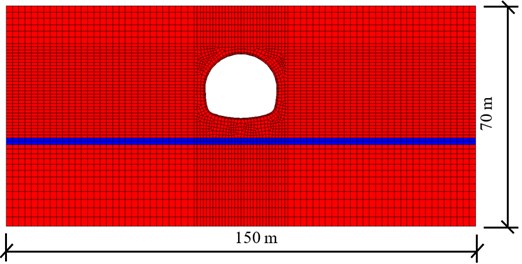
a) Numerical model of model A
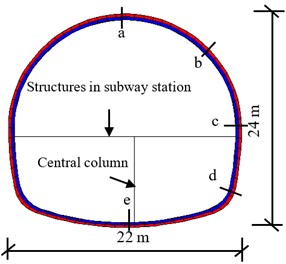
b) Detail size of Fengtianlu subway station
Table 1The physical and mechanical parameters of materials in numerical simulation
Materials | Young’s modulus E (GPa) | Poisson’s ratio μ | Density ρ (g/cm3) | Cohesion c (kPa) | Internal friction angle Φ (°) |
Normal stratum | 1.5 | 0.35 | 2.3 | 300 | 33 |
Soft layer | 0.2 | 0.35 | 2.2 | 50 | 28 |
C30 concrete | 30 | 0.20 | 2.4 | – | – |
2.4. Earthquake excitation
The ground acceleration of Kobe earthquake happened in 1995 is completely recorded, and it is widely used in seismic study. The duration of this seismic record is approximate 50 s. This paper focuses on studying the peak seismic response of subway station, thus only 8.5 s of the record containing the peak velocity was selected as input excitation. For briefly, the initially 8.5 s of seismic record is adopted (as shown in Fig. 3). Generally, seismic wave contains a wide range of spectrum, but most of the energy is concentrated in the part with a frequency of less than10 Hz. And the high-frequency seismic wave does not play an important role on geotechnical engineering [18]. A seismic wave is usually a series of discrete acceleration points, which should be filtered and rectified before use in numerical simulations [19]. A higher frequency requires a smaller mesh dimension, a larger grid number, and a longer calculating time under the same calculation accuracy condition. It is suggested that the high-frequency of input history can be removed without significantly affecting the results [20]. In this paper, the filtering procedure is accomplished with a low-pass filter routine in SeismoSignal (http://www.seismosoft.com). The selected acceleration record was filtered with a 20 Hz low-pass filter. The input earthquake excitation and its corresponding Fourier amplitude after filtering are plotted in Fig. 3. The input acceleration is scaled down to a magnitude of 0.15 g according to local engineering experiences.
Fig. 3The selected earthquake excitation
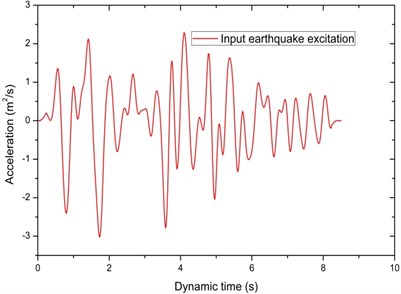
a) The acceleration versus time data of input earthquake
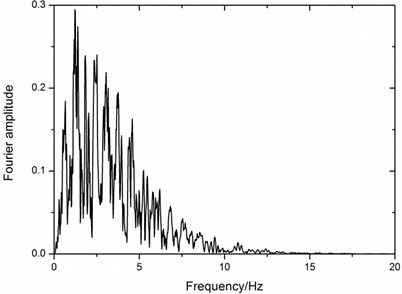
b) The Fourier frequency of input earthquake
3. Numerical results
In order to investigate the effect of soft layer locating below subway station on seismic behavior of subway station, the numerical model was run twice, on the condition of with and without the existence of soft layer. The relative displacement, acceleration and safety factor of secondary lining, and internal force of columns are highlighted.
3.1. The effect of soil layer on displacement of subway station
Fig. 4 shows the time-history curve of relative lateral displacement between tunnel crown a bottom. It can be seen that the curve of the case with soft layer is always within the range of the case without soft layer. The relative displacement when soft layer is included is much less than the case without soft layer. In detail, the maximum relative displacement without considering soft layer is approximate 29.86 mm, at the moment of 1.89 s, while the maximum relative displacement of the case considering soft layer is 14.66 mm, at the moment of 5.15 s. The decrease rate of maximum relative displacement in the case considering soft layer is about 50.9 % when compared with the case without considering soft layer. The existence of soft layer is beneficial for decreasing relative displacement of subway station.
3.2. The effect of soft layer on acceleration of secondary lining
In order to investigate the effect of soft layer on acceleration of secondary lining, five key points in secondary lining (as shown in Fig. 2(b)) are selected to record the variation of acceleration in secondary lining during earthquake. Fig. 5 shows the time-history curve of acceleration except point b, for the record command of point b is missing in numerical simulation. It can be seen that the curve of acceleration with dynamic time when considering soft layer is within the range of the case without conspiring soft layer. The acceleration with soft layer is much less than that without soft layer. The corresponding moment of the maximum acceleration without considering soft layer is earlier than the case considering soft layer. In detail, the maximum acceleration without considering soft layer appears at the moment of 2.34 s, which is 2.81 s earlier than the case considering soft layer. The maximum acceleration of these four monitoring points is extracted to further investigate the influence degree of soft layer on acceleration of secondary lining. Table 2 lists the maximum acceleration and calculation errors of these four monitoring points. Note that the calculation error is defined as the change rate of numerical results considering soft layer with the case without soft layer. It can be seen that acceleration when the soft layer is much less than the case considering soft layer, which means the presence of soft layer is beneficial for reducing acceleration in secondary lining. The decrease rate from point a to point e are –49.05 %, –49.70 %, –35.56 %, and –39.79 %, respectively. The maximum decrease rate is in tunnel crown, and the minimum value occurs in arch springing.
Fig. 4Time-history curve of the relative lateral displacement between tunnel crown and bottom
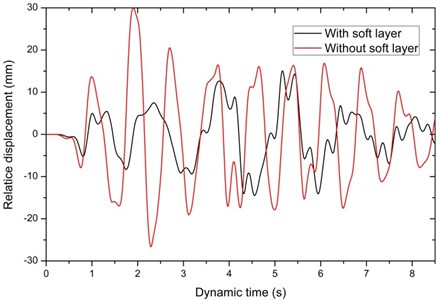
Table 2The maximum acceleration in X direction of four monitoring points in secondary lining
Working conditions | Acceleration in X direction (m2/s) | |||
Point a | Point c | Point d | Point e | |
Without soft layer | 6.91 | 5.05 | 4.95 | 6.56 |
With soft layer | 3.52 | 2.54 | 3.19 | 3.95 |
Decrease rate (%) | –49.05 | –49.70 | –35.56 | –39.79 |
3.3. The effect of soft layer on safety factor of secondary lining
Safety factor plays a key role in evaluating stability of secondary lining. Safety factor of five key points in secondary lining is calculated through the calculation method discussed in Section 2.1. It should be noted that since the safety factor is not an intrinsic indicator in Flac3D, it can’t be directly and continuously recorded during numerical simulation. To derive the variation of safety factor during simulation, 425 calculation steps were divided, with the calculation time of each steps 0.02 s. Fig. 6 shows the time-history curve of safety factor. It can be seen the curve of the case considering soft layer is within the range of the case without softy layer. The safety factor of secondary lining fluctuates around a certain value except for point a and e. For point a and e, the safety factor decreases rapidly and then tends to keep stable. Besides, the appearance moment of rapid decrease in point a and e without considering soft layer is earlier than the case with soft layer. Note that the dashed line in Fig. 6 represents the minimum safety factor during earthquake. To further investigate the influence degree of soft layer on safety factor of secondary lining, the minimum safety factor of five monitoring points is extracted and listed in Table 3. It can be seen the distribution of safety factor in two cases are similar. The maximum safety factor occurs in point a (tunnel crown), and the minimum value appears in Point d (tunnel arch feet). To ensure the stability of subway station, the thickness and strength of secondary lining in tunnel arch feet should be improved. The safety factor of secondary lining in the case that soft layer is included shows great increase compared with the case without soft layer. The increase rate from Points a to e are 72.57 %, 43.25 %, 13.42 %, 50.72 %, and 54.94 %, respectively. The presence of soft layer can greatly enhance the stability of subway station.
Fig. 5Time-history curve of acceleration in X direction in secondary lining
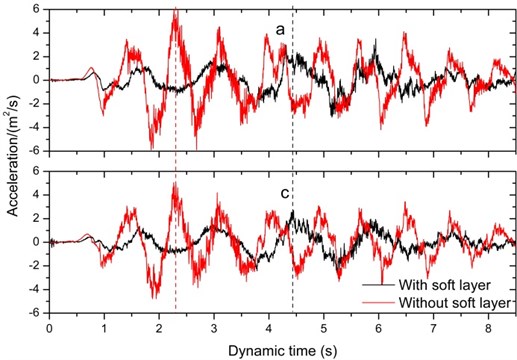
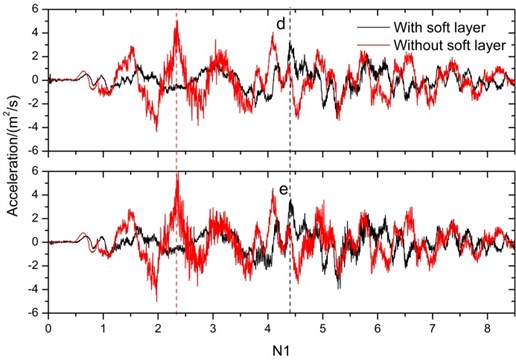
Table 3The minimum safety factor of monitoring points
Working conditions | Safety factor of secondary lining | ||||
Point a | Point b | Point c | Point d | Point e | |
Without soft layer | 4.52 | 2.89 | 3.80 | 2.07 | 2.53 |
With soft layer | 7.8 | 4.14 | 4.31 | 3.12 | 3.92 |
Increase rate (%) | 72.57 | 43.25 | 13.42 | 50.72 | 54.94 |
Fig. 7 shows the distribution of safety factor in secondary lining at the end of earthquake. It can be seen that the distribution of safety factor is not symmetric along the central axes of tunnel, for the reason that the stress condition of tunnel lining in two sides are opposite. Generally, the moving trend of tunnel lining is always identical with the direction of input earthquake. When the direction of input earthquake is along the positive half of the X axis, tunnel lining in the right part will be extruded by surrounding soil, but that in the left part will detach from surrounding soil, which will introduce the differences in stress condition. It can be seen in Fig. 7 that secondary lining in tunnel crown is the safest area, and tunnel arch feet is the most unfavorable part. Safety factor of the case with soft layer is much greater than the case without soft layer in any part of tunnel lining.
Fig. 6Time-history curve of safety factor in secondary lining
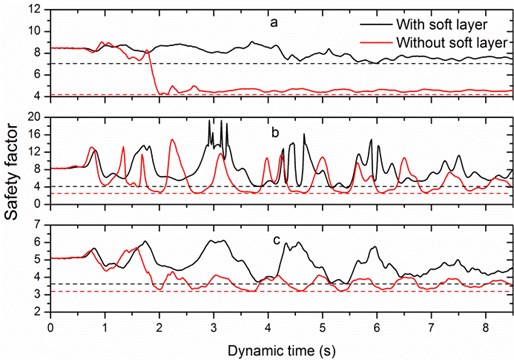
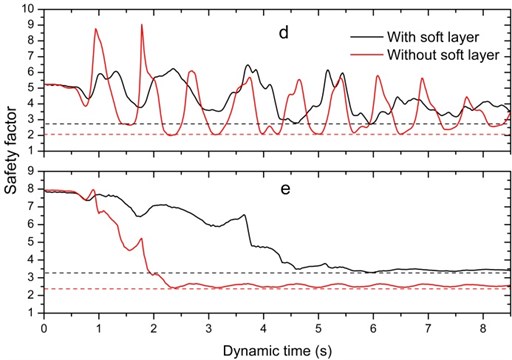
Fig. 7Safety factor of secondary lining at the end of earthquake
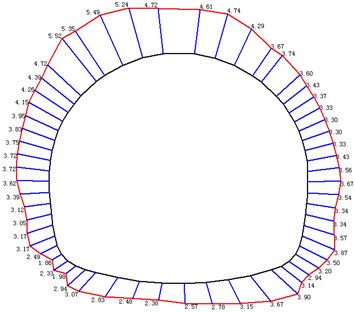
a) Without soft layer
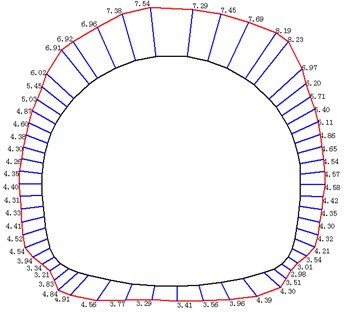
b) With soft layer
3.4. The effect of soil layer on internal force of internal structures
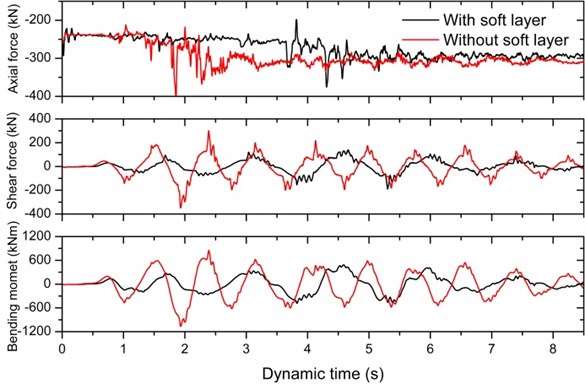
The Kobe earthquake happened in Japan in 1995 caused serious seismic damage in subway station. The most attracting phenomenon is that the columns in subway station suffered serious shear failure. In addition, many existing studies have pointed that the bottom of columns in subway station is vulnerable to damages in earthquake. To make clear the effect of soft layer on internal force of columns in subway station, the internal force, including axial force, shear force and bending moment in the bottom of columns are highlighted. Fig. 8 shows the time-history curve of internal force. Note that positive and negative values of axial force refer to tension and compression, respectively. If the shear force tends to make the column rotate clockwise, it is regarded as positive. Otherwise, it is negative. If the bending moment tends to put the column in the right part into tension, it is regarded as positive. Otherwise, it is negative. Generally, the value of internal force when the soft layer is included are less than the case when the soft layer is not included except for axial force. Table 4 lists the maximum value of internal force in central column. The variation rates are 7.19 %, –48.24 %, and –56.33 %, respectively. The axial force is less influenced by soft layer compared with shear force and bending moment. The decrease of internal force in central column will greatly increase the stability of subway station.
Table 4The maximum value of internal force in central column
Axial force (kN) | Shear force (kN) | Bending moment (kN∙m) | |
Without soft layer | 403.5 | 344.3 | 1017.0 |
With soft layer | 374.5 | 178.2 | 444.1 |
Decrease rate (%) | –7.19 | –48.24 | –56.33 |
Fig. 8Time-history curve of internal force in central column
4. Discussions
The numerical results presented in Section 3 indicate that the soft layer is beneficial for improving stability of subway station when it is below subway station. However, the location of soft layer in engineering site is variable. It may locate in the above or the middle part of subway station. The seismic behavior of subway station can be affected by location of soft layer to some extent. In this section, the effect of soft layer location on seismic behavior of subway station is discussed. Another two models considering soft layer in numerical model are established (as shown in Fig. 9). In model B, the soft layer locates in the middle part of subway station. While in model C, it locates above subway station with the vertical distance of approximate 3 m. Note that the all the setting in model B and model C are identical with model A (shown in Fig. 2) except for the location of soft layer. Similarly, the relative displacement, acceleration and safety factor, and distribution of internal force of four cases are compared to investigate the effect of soft layer location on seismic performance of subway station.
Fig. 9Numerical model with different soft layer location
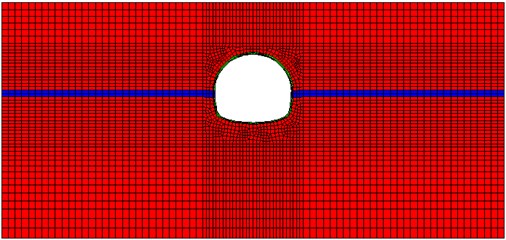
a) Model B
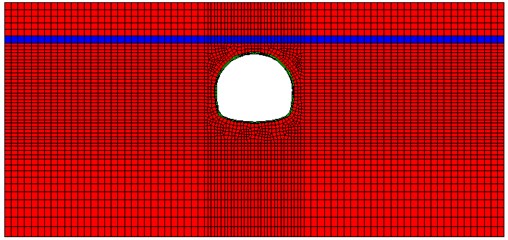
b) Model C
4.1. Effect of soft layer location on relative displacement
Fig. 10 shows the time-history curve of relative displacement. It can be seen that the maximum relative displacement in model B and C are 70.17 mm and 30 mm, respectively. Through comparing numerical results with the results presented in Section 3.1, it can be seen that the maximum relative displacement in model B has greater increase than model C compared with the case without considering soft layer. The amplification factor of relative displacement is defined as the ratio of relative displacement with soft layer to that without soft layer. Thus, the amplification factor of model B and C are 2.81 and 1.01, respectively. The effect of soft layer on relative displacement almost can be neglected when it is above subway station. The most favorable and unfavorable case in reducing relative displacement are model A and B, respectively.
4.2. Effect of soft layer location on acceleration of secondary lining
The variation of maximum acceleration in secondary lining due to the change of soft layer location is shown in Table 5. The calculation results of three cases with soft layer are compared with the case without soft layer. Note that calculation error is defined as the change rate of results considering soft layer to the case without considering soft layer. It can be seen from Table 5 that although the presence of soft layer is generally beneficial for reducing acceleration, special attention should be paid to model B. Since the acceleration in point b has a significant increase, with the value and increase rate of 20.45 and 327.82 %, respectively. The induced great acceleration by soft layer in model B may cause failure of secondary lining. Besides, the location of point c is near to the location of soft layer. It can be concluded that when the soft layer is in the lower part or upper part of subway station, the presence of soft layer is effective in reducing acceleration. While the soft layer is within the range of subway station, acceleration of the range that is close to soft layer will have an increase, but the area that is far away from it will be reduced. The effect of soft layer in model A and C are similar, since they are both favorable for reducing acceleration. The soft location in model A is more preferable than that in model C.
Fig. 10Time-history curve of relative displacement in four cases
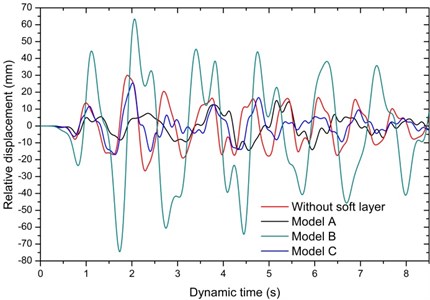
Table 5The maximum acceleration in secondary lining in four cases
Location | Acceleration (m2/s) | ||||||
Without soft layer | With soft layer | ||||||
Model A | Model B | Model C | |||||
Value | Error (%) | Value | Error (%) | Value | Error (%) | ||
Point a | 6.91 | 3.52 | –49.06 | 4.09 | –40.81 | 5.08 | –26.48 |
Point c | 4.78 | 2.70 | –43.51 | 20.45 | 327.82 | 3.83 | –19.87 |
Point d | 4.95 | 3.19 | –35.56 | 5.33 | 7.68 | 3.44 | –30.51 |
Point e | 6.56 | 3.95 | –39.79 | 5.29 | –19.36 | 4.32 | –34.14 |
4.3. Effect of soft layer location on safety factor of secondary lining
Table 6 compares the safety factor of secondary lining in five key points of four cases. As can be seen from Table 6, the contribution of soft layer location to safety factor is opposite to that of acceleration, which reveals that the safety factor has a close relationship with acceleration. In detail, safety factor will greatly reduce while the acceleration increases significantly. The distribution of safety factor in four cases is almost identical. The most favorable and unfavorable point is point a and point d in each case. The effect of soft layer in model A and C are consistent. The presence of soft layer in these two cases will greatly increase the safety factor, with the maximum increase rate 72.57 % and 56.19 %, respectively. Soft layer in model A and C are helpful to improve the stability of subway station. The soft layer location in model A is more preferable on improving safety factor than that in model C. The calculated safety factor in model B is much less than the case without soft layer except point e, with the maximum decrease rate –22.37 %. This phenomenon reveals that the location of soft layer in model B is harmful to the stability of subway station.
4.4. Effect of soft layer location on internal force of central column
In order to study the location of soft layer on internal force of central column, the maximum induced internal force of central column of four cases during earthquake are listed in Table 7. As can be seen from Table 7, the calculated values in model A and C both decrease significantly compared with the case without soft layer. However, soft layer in model B caused an increase of shear force and bending moment except axial force. From the observations of past earthquakes, it seems that the bottom of columns in subway station is more vulnerable to shear failure. Shear force in model A and C has a significantly decrease, and the stability of columns will be greatly improved. While in model B, the shear force and bending moment both increased, which may lead to unstable of columns during earthquake. In addition, the decrease rate of bending moment is greater than that of axial force, which will lead to the decrease of eccentric distance and further improve the stress state of columns. However, the axial force decreased while the bending moment increased in model B, while will lead to a significant increase of eccentric distance and further decrease the bearing capacity of columns. Hence, the soft layer location in model A and C is beneficial for improving stress state of columns. Nevertheless, the soft layer location in model B is harmful for the stability of columns.
Table 6The minimum safety factor of secondary lining in four cases
Location | Safety factor | ||||||
Without soft layer | With soft layer | ||||||
Model A | Model B | Model C | |||||
Value | Error (%) | Value | Error (%) | Value | Error (%) | ||
Point a | 4.52 | 7.80 | 72.57 | 3.51 | –22.35 | 7.06 | 56.19 |
Point b | 2.89 | 4.14 | 43.25 | 2.79 | –3.46 | 3.80 | 31.49 |
Point c | 3.80 | 4.31 | 13.42 | 2.95 | –22.37 | 3.63 | –4.47 |
Point d | 2.07 | 3.12 | 50.72 | 1.93 | –6.76 | 2.70 | 30.43 |
Point e | 2.53 | 3.92 | 54.94 | 2.96 | 17.00 | 3.29 | 30.04 |
Table 7The maximum internal force of central column in four cases
Location | Internal force | ||||||
Without soft layer | With soft layer | ||||||
Model A | Model B | Model C | |||||
Value | Error (%) | Value | Error (%) | Value | Error (%) | ||
Axial force (kN) | 406.9 | 375.7 | –7.67 | 315.0 | –22.59 | 331.0 | –18.65 |
Shear force (kN) | 344.3 | 189.0 | –45.11 | 370.1 | 7.49 | 211.2 | –38.66 |
Bending moment (kN∙m) | 1066.0 | 485.1 | –54.49 | 1836.0 | 72.23 | 699.5 | –34.38 |
5. Conclusions
The seismic response of subway station structure in normal strata with soft layer is investigated by using numerical simulation. The effect of soft layer locating below subway station is firstly investigated. Then the seismic response of subway station structure against soft layer location is further studied. The relative displacement, acceleration and safety factor in secondary lining, and internal force of central column calculated with and without soft layer are compared and analyzed. Thus, some conclusions can be arrived at:
1) The solid element is more suitable to simulate the relative interaction between secondary lining and surrounding rock masses. While it is adopted to simulate secondary lining, the internal force can be calculated through the computational stress in the center point of solid zones, and the safety factor of secondary lining can be further calculated based on empirical formula.
2) Due to the transmission and reflection of seismic wave when it propagates through soft layer, the presence of soft layer may influence the seismic behavior of subway station. In the case that soft layer is below subway station, the relative displacement, acceleration of secondary lining and internal force of columns all have a significant decrease compared with the case without soft layer. Consequently, when soft layer is below subway station, it is beneficial for improving stability of subway station.
3) The effect of soft layer on seismic performance of subway station depends on the location of soft layer. In the two cases that soft layer is below and above subway station, they are both favorable for improving stability of subway station. Note that when the soft layer is below subway station, it is more preferable than that above subway station. However, in the case when soft layer is within the range of subway station, it will greatly amplify the acceleration and internal force of secondary lining, especially for the part that is close to soft layer. The influence degree gradually decreases with the increasing relative distance to soft layer. To ensure the stability of subway station, the soft layer should be avoided to be within the range of subway station.
4) The contribution of soft layer location on safety factor is opposite to that of acceleration. These two indicators have an intrinsic relationship. Due to the presence of soft layer, safety factor of secondary lining increases significantly while acceleration decreases.
References
-
Okamoto Introduction to Earthquake Engineering. University of Tokyo Press, 1973, p. 29-40.
-
Iwan W. D. Drift spectrum: measure of demand for earthquake ground motions. Journal of Structural Engineering, Vol. 123, 1997, p. 397-404.
-
D’Ayala D., Speranza E. Definition of collapse mechanisms and seismic vulnerability of historic masonry buildings. Earthquake Spectra, Vol. 19, 2003, p. 479-509.
-
Seyedi D. M., Gehl P., Douglas J., et al. Development of seismic fragility surfaces for reinforced concrete buildings by means of nonlinear time-history analysis. Earthquake Engineering and Structural Dynamics, Vol. 39, 2010, p. 91-108.
-
Guo J., Chen J. Y., Antonio B. Influence of a subway station on the inter-story drift ratio of adjacent surface structures. Tunnelling and Underground Space Technology, Vol. 35, 2013, p. 8-19.
-
Liu H. B., Song E. X. Seismic response of large underground structures in liquefiable soils subjected to horizontal and vertical earthquake excitations. Computers and Geotechnics, Vol. 32, 2005, p. 223-244.
-
Masaru T. Damage done by the great earthquake disaster of the Hanshin-Awaji district to the Kobe Municipal Subway system and restoration works of the damage. Japanese Railway Engineering, Vol. 137, 1997, p. 19-23.
-
Wang W. L., Wang T. T., Su J. J., et al. Assessment of damage in mountain tunnels due to the Taiwan Chi-Chi Earthquake. Effects of surface buildings on twin tunneling-induced ground settlements. Tunnelling and Underground Space Technology, Vol. 16, 2001, p. 133-150.
-
Hashash Y. M. A., Hook J. J., Schmidt B., et al. Seismic design and analysis of underground structures. Tunnelling and Underground Space Technology, Vol. 16, 2001, p. 247-293.
-
Jiang Y. J., Wang C. X., Zhao X. D. Damage assessment of tunnels caused by the 2004 Mid Niigata Prefecture Earthquake using Hayashi’s quantification theory type II. Natural Hazards, Vol. 53, 2010, p. 425-411.
-
Huo H., Bobet A., Fernandez G., et al. Load transfer mechanisms between underground structure and surrounding ground: evaluation of the failure of the Daikai Station. Journal of Geotechnical and Geoenvironmental Engineering, Vol. 131, 2005, p. 1522-1533.
-
Gazetas G., Gerolymos N., Anastasopoulos I. Response of three Athens metro underground structures in the 1999 Parnitha earthquake. Soil Dynamic and Earthquake Engineering, Vol. 25, 2005, p. 617-633.
-
Chen G. X., Chen S., Zuo X., et al. Shaking-table tests and numerical simulations on a subway structure in soft soil. Soil Dynamic and Earthquake Engineering, Vol. 76, 2015, p. 13-28.
-
Takahashi N., Hyodo M., Hyde A. F., et al. Online earthquake response test for stratified layers of clay and sand. Journal of Geotechnical and Geoenvironmental Engineering, Vol. 132, 2006, p. 611-621.
-
Groby J. P., Wirgin A. Two dimensional ground motion at a soft viscoelastic layer/hard substratum site in response to SH cylindrical seismic waves radiated by deep and shallow line sources: 1. theory. Geophysical Journal International, Vol. 163, 2005, p. 165-191.
-
Groby J. P., Wirgin A. Two dimensional ground motion at a soft viscoelastic layer/hard substratum site in response to SH cylindrical seismic waves radiated by deep and shallow line sources: 2. numerical results. Geophysical Journal International, Vol. 163, 2005, p. 192-224.
-
Code for Design of Road Tunnel. Ministry of Transport of the People’s Republic of China, 2004.
-
Zhang Y. B., Zhang J., Chen G. Q., et al. Effects of vertical seismic force on initiation of the Daguangbao landslide induced by the 2008 Wenchuan earthquake. Soil Dynamics and Earthquake Engineering, Vol. 73, 2015, p. 91-102.
-
Alberto S., Riccardo D., Yumei H., et al. Improvement of the seismic noise attenuation performance of the monolithic geometric anti-spring filters for gravitational wave interferometric detectors. Nuclear Instruments and Methods in Physics Research Section A-Accelerators Spectrometers Detectors and Associated Equipment, Vol. 580, 2007, p. 1559-1564.
-
Fast Lagrangian Analysis of Continua in 3-Dimension (FLAC3D V3.1). Itasca Consulting Group, Minnesota, 2007.
About this article
This research is founded by the National Natural Science Foundation of China (No. 51578091). The financial support from the NSFC is greatly appreciated. Moreover, the authors would like to thank the reviewers for their valuable comments and constructive suggestions on the manuscript.
