Abstract
In this paper, a displacement monitoring APP called D-Viewer is proposed and developed. By means of common laser device and projection plate, structural displacement can be monitored dynamically, using the APP. Firstly, the laser spot centroid recognition method was studied. Second, the displacement monitoring APP was developed. Finally, in order to verify the feasibility of the method, a series of static and dynamic experiments using smartphone were conducted. Results show that this method can be used as a convenient, fast, low-cost structural displacement monitoring method.
1. Introduction
Nowadays, SHM systems have become one important way for ensuring safety of civil infrastructures, as well as, an important approach for research of the damage accumulation or even disaster evolving characteristics of civil infrastructures [1]. However, most SHM systems reported were designed, integrated, and installed into large-scale infrastructures by professionals and equipped with relatively expensive sensors, data acquisition devices, and so forth. Therefore, it is impossible to install SHM system for every civilian building. It will be of dramatic significance if some convenient monitoring techniques, which can be equipped, operated and utilized by common civilian, can be developed. Those kinds of techniques could play a huge role in emergency monitoring for structures, especially for civilian buildings in natural disaster area, such as earthquakes, floods, hurricane etc. [2, 3].
Smartphones installed with various APP, as a kind of high-tech and fast growing mobile information terminals are rapidly affecting all aspects of human lives. At present, using the smartphone APP, people can already carry out the human health monitoring [4], car crash detection [5], motivation recognition [6], and seismic sensing [7]. One iOS App called Orion CC has been developed, which can inspect the bridge cable force by invoke the built-in accelerometer of iPhone [8]. One person, who is equipped without any professional inspection device, and just with one iPhone, can measure the cable force. It means that smartphone based monitoring techniques will be one big challenge and powerful supplement for traditional techniques.
In this paper, one novel and convenient displacement monitoring technique using smartphone is proposed. Currently, several kinds of displacement monitoring techniques were utilized, such as displacement sensor and acceleration sensor [9], Laser Doppler vibrometer system [10], GPS satellite-surveying method [11], Robotic total station [12], terrestrial laser scanning [13], Strain sensors [14], most of which require high cost to install and maintain, and due to some limitations, making them not suitable for widespread use in the normal structures. Therefore, one smartphone APP called D-Viewer was developed for displacement monitoring with the aid of one common laser device and one projection plate. By using D-Viewer, people can use smartphones to perform displacement monitoring by themselves, which will popularize displacement monitoring greatly. At present, the software can be searched and downloaded in the wan doujia (android version) [15] and APP Store (IOS version) [16], people can also log www.cloudshm.com to download the D-Viewer.
2. Basic principle
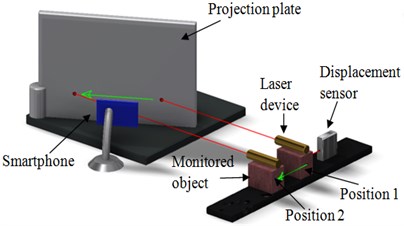
First, a laser device is mounted on the monitored object, making its optical path direction perpendicular to the movement direction of the monitored object. Second, the angle between the projection plate plane and the laser optical path is adjusted to 30 degrees. During measurement, use the camera of smartphone to shoot the laser spot on the projection plate. Once the monitored object moves from position 1 to position 2, the laser device will follow the movement, such that the laser spot on the projection plate will move proportionally. The ratio (K) of the actual size and the pixel size, as well as the original position of the laser spot of the video, are obtained through the D-Viewer first, after which the video is processed to obtain the pixel coordinates (X) of the laser spot centroid of each frame image. Then, the actual coordinates of the laser spot centroid of each frame image can be obtained by the formula L=X×K, thereby visually reflecting the displacement of the monitored object. During the experiment, a laser displacement sensor was used to monitor the precise displacement of the object. The experimental schematic diagram is shown in Fig. 1
Fig. 1Experimental schematic diagram
3. Introduction of the D-Viewer
The CV_BGR2GRAY function in OpenCV is employed for image gray processing, whereas the cvThreshold function in OpenCV is used for gray image binarization processing. The pixel coordinates of the laser spot centroid of the binarized image are obtained by the calculation formula for the centroid.
To obtain the actual coordinates of the laser spot centroid, two steps are needed: calibration and coordinates acquisition.
3.1. Calibration
1. Print a reference (black circle) on white paper and attach the paper to the projection plate, the black circle’s diameter can be set during printing, such as 25 mm.
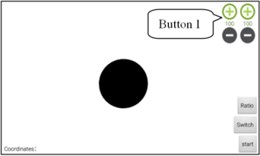
Click the D-Viewer icon, appear the initial setup interface shown in Fig. 2. In this interface, the black circle diameter and monitoring regional scope can be entered, the front or rear camera can be selected, and lines of pixel scanning interval can be setted.
2. The “done” button of the setup interface is clicked to enter the calibration interface as show in Fig. 3. Fixed the smartphone, making it shooting the black circle, then click the button 1 in the top right of the image to adjust the threshold, so the black circle and white background can be separated clearly.
3. Click the “Ratio” button, the D-Viewer scans and records the number of black pixels of the line which has the maximum number of black pixels in the image, namely the pixel number of the black circle diameter occupied. Then, the D-Viewer compare the pixel number with the actual diameter of the black circle automatically to obtain the ratio (K) of the actual size to the pixel size.
Fig. 2Initial setup interface

Fig. 3Calibration interface
3.2. Coordinates acquisition
1. Remove the paper on the projection plate, making the laser spot directly project on the black projection board. Keep the smartphone still, click the “switch” button to switch to the monitoring regional scope adjustment interface. As shown in Fig.4.
Click the button in the left side to adjust the location of the monitoring regional, making the laser spot locate inside the monitoring regional scope.
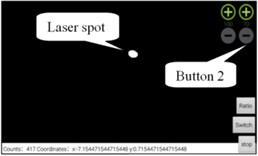
2. Click the button 2 in the upper right corner of the image to adjust the threshold, so the laser spot and black projection plate can be separated clearly. Click “start” button, the D-Viewer began to monitor the coordinates of the laser spot centroid and display the X and Y coordinate values of laser spot at the bottom of the D-Viewer in real-time, and real-time store laser spot coordinate values of each frame image. When the “stop” button is clicked, the D-Viewer will save the coordinate values of the laser spot centroid into .txt file format. The Monitoring interface is show in Fig. 5.
Fig. 4Monitoring regional scope adjustment interface
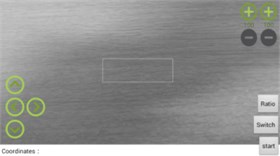
Fig. 5Monitoring interface
4. Experiments
Before use smartphone to monitor laser spot for displacement monitoring experiments, a series of displacement monitoring experiment use industrial CCD camera to monitor the laser spot were conducted [17], the results are as follows.
4.1. Static experiment of CCD camera
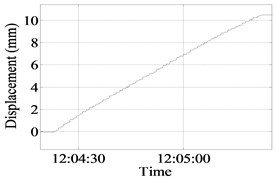
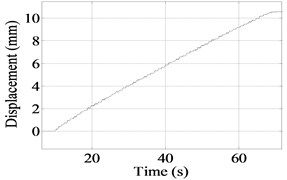
The laser device is mounted onto the pedestal of the displacement loading device. The knob of the pedestal is rotated to enable the pedestal to drive the laser device motion. The laser displacement sensor is adopted to measure the precise displacement of the pedestal. The knob was continuously rotated for 30 laps, and the total displacement of pedestal is about 10.5 mm. The experimental schematic diagram and field experiment images are shown in Fig. 6.
As can be seen from Fig. 6, the peak datum of the laser displacement sensor is 10.58 mm, whereas that of the camera is 10.54 mm. The difference is 0.04 mm, and the error between them is negligible at 0.38 %.
Fig. 6a) Result of the camera; b) result of the sensor
a)
b)
4.2. Dynamic experiment of CCD camera
The laser device is mounted on the vibration table and moves along with the vibration table. The laser displacement sensor is adopted to monitor the precise displacement of the vibration table.
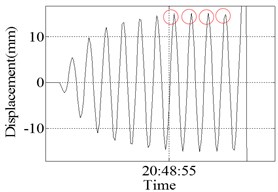
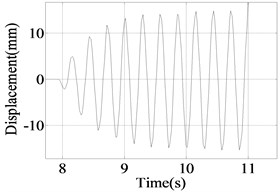
The experimental results of the sine wave of a 3.5 Hz frequency and 15 mm amplitude is shown in Fig. 7.
Four peak point displacement values are selected to compare, and the results are shown in Table 1.
Fig. 7a) Result of the camera; b) result of the sensor
a)
b)
The Fig. 7 and Table 1 show that when the vibration frequency of the vibration table is less than or equal to 3.5 Hz, the displacement change of the vibration table can be accurately and completely monitored by this system. However, when the vibration frequency is greater than or equal to 4.0 Hz, some individual peak points of the displacement curve cannot be monitored. This limitation is attributed to the camera frame rate, which are approximately 40 frames per second. If the vibration is too fast, then the camera fails to capture all of the peak points
Table 1Comparison of the data of the sensor and program
Camera | 15.03 | 15.20 | 15.12 | 14.96 |
Sensor | 14.09 | 14.66 | 14.83 | 14.77 |
Difference | 0.94 | 0.54 | 0.29 | 0.19 |
Error | 6.67 % | 3.68 % | 1.96 % | 1.29 % |
4.3. Static experiment of smartphone
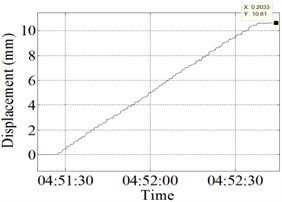
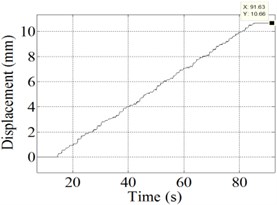
Experimental procedure as 4.1, the smartphone is Samsung A5, and the experimental result is shown in Fig. 8.
As can be seen from the Fig. 8, the peak datum of the laser displacement sensor is 10.61 mm, where as that of the APP is 10.65 mm. The difference is 0.04 mm, and the error between them is negligible at 0.37 %.
Compared with the experimental results of 4.1, the static experiment precision of smartphone and industrial camera are almost unanimously.
Fig. 8a) Result of the smartphone; b) result of the sensor
a)
b)
4.4. Dynamic experiment of smartphone
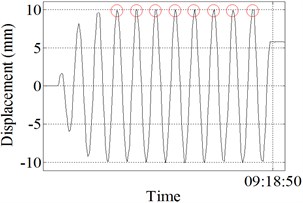
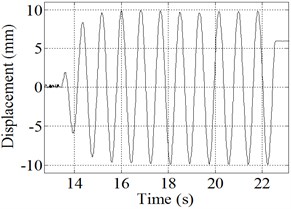
Experimental procedure as 4.2, the smartphone is Samsung A5, and the experimental result of the sine wave of a 1.2 Hz frequency and 10 mm amplitude is shown in Fig. 9.
As shown in Fig. 9, eight peak datum are selected to compare, and the results are shown in Table 2.
Fig. 9a) Result of the smartphone; b) result of the sensor
a)
b)
The Fig. 9 and Table 2 show that when the vibration frequency of the vibration table is less than or equal to 1.2 Hz, the displacement change of the vibration table can be accurately and completely monitored by the smartphone. However, when the vibration frequency is greater than or equal to 1.3 Hz, some individual peak points of the displacement curve cannot be monitored by the A5.
Compared with the experimental results of 4.2, shows that the maximum frequency can be monitored by A5 is 1.2 Hz, lower than the maximum frequency can be monitored by CCD camera (3.5 Hz), this is because the A5 collected 11 to 14 data per second, while CCD camera collected 40 data per second.
Table 2Data comparison of the smartphone and sensor
Smartphone | 9.961 | 10.02 | 10.02 | 10.02 | 10.02 | 10.02 | 9.961 | 9.961 |
Sensor | 9.873 | 9.987 | 9.880 | 9.660 | 9.652 | 9.820 | 9.835 | 9.795 |
Difference | 0.088 | 0.033 | 0.140 | 0.360 | 0.368 | 0.200 | 0.126 | 0.166 |
Error | 0.89 % | 0.33 % | 1.42 % | 3.73 % | 3.81 % | 2.04 % | 1.28 % | 1.69 % |
5. Conclusions
Through a series of experiments and the analyses of the experimental data, it can be concluded that the precision of the D-Viewer is ideal. The results show that use smartphones to monitor the displacement has the advantages of high accuracy, convenience, ease of operation and stable performance, it can be a feasible method to monitor displacement of structures. Smartphones appeared in people’s life with only a few years, in the future, smartphones will certainly have a big performance boost with the progress of science and technology. Higher pixel camera can carry out a wider range of displacement monitoring in the case of upgrading smartphones displacement monitoring resolution; higher performance CPU can process data faster to improve sampling frequency, which increase its applicability in civil engineering applications in which structures vibrate at high frequencies.
References
-
Ou J. P. Some recent advances of intelligent health monitoring systems for civil infrastructures in mainland China. Structural Health Monitoring and Intelligent Infrastructure, Vol. 1, 2003, p. 131-144.
-
Yu Y., Han R., Zhao X., et al. Initial validation of mobile-structural health monitoring method using smartphones. International Journal of Distributed Sensor Networks, 2015.
-
Yu Y., Zhao X., Ou J. P. A new idea: mobile structural health monitoring using smart phones. Third International Conference on Intelligent Control and Information Processing (ICICIP), 2012, p. 714-716.
-
Lau S. L., Konig I., David K., et al. Supporting patient monitoring using activity recognition with a smartphone. 7th International Symposium on Wireless Communication Systems (ISWCS), New York, 2010.
-
Ketabdar H., Polzehl T. Fall and emergency detection with mobile phones. Proceedings of the 11th International ACM SIGACCESS Conference on Computers and Accessibility, New York, 2009.
-
Lau S. L., David K. Movement recognition using the accelerometer in smartphones. Future Network and Mobile Summit, 2010, p. 1-9.
-
Reilly J., Dashti S., Ervasti M. Mobile phones as seismologic sensors: automating data extraction for the iShake system. IEEE Transactions on Automation Science and Engineering, 2013, p. 242-251.
-
https://itunes.apple.com/cn/app/orion-cc/id951253417?mt=8.
-
Park K., Kim S., Park H., et al. The determination of bridge displacement using measured acceleration. Engineering Structures, Vol. 3, Issue 27, 2005, p. 371-378.
-
Nassif H. H., Gindy M., Davis J. Comparison of laser Doppler vibrometer with contact sensors for monitoring bridge deflection and vibration. NDT&E International, Vol. 3, Issue 38, 2005, p. 213-218.
-
Roberts G. W., Meng X., Dodson A. H. Integrating a global positioning system and accelerometers to monitor the deflection of bridges. Journal of Surveying Engineering, Vol. 2, Issue 130, 2004, p. 65-72.
-
Psimoulis P. A., Stiros S. C. Measurement of deflections and of oscillation frequencies of engineering structures using robotic theodolites (RTS). Engineering Structures, Vol. 12, Issue 29, 2007, p. 3312-3324.
-
Gordon S. J., Lichti D. D. Modeling terrestrial laser scanner data for precise structural deformation measurement. Journal of Surveying Engineering, Vol. 2, Issue 133, 2007, p. 72-80.
-
Glisic B., Inaudi D., Nan C. Pile monitoring with fiber optic sensors during axial compression, pullout, and flexure tests. Transportation Research Record: Journal of the Transportation Research Board, 2002, p. 11-20.
-
http://www.wandoujia.com/apps/com.dlut.lightdetect.
-
https://itunes.apple.com/cn/app/d-viewer/id1006583231?mt=8.
-
Zhao X., Liu H., Yu Y., et al. Bridge displacement monitoring method based on laser projection-sensing technology. Sensors, Vol. 4, Issue 15, 2015, p. 8444-8463.
About this article
Thanks are given for the financial support of the National Natural Science Foundation of China (51278085, 51221961).
