Abstract
According to the non-stationary and nonlinear characteristics of bearing vibration signals of the centrifugal pumps, a fault diagnosis method based on local characteristic-scale decomposition (LCD)-approximate entropy (ApEn) and probabilistic Neural Network (PNN) is proposed in this paper. First, the vibration signals are decomposed into a finite number of intrinsic scale components (ICSs), after which the ApEn of each ISC is obtained to form the feature vector. Then, the feature vectors are selected as the input vectors of the PNN for fault diagnosis. The classification results achieve a fault recognition rate of 100 % for various centrifugal pump fault patterns, which verifies the effectiveness and feasibility of the proposed method.
1. Introduction
As Centrifugal pumps are frequently used in many critical industries, fault diagnosis technique for centrifugal pump become absolutely essential. Generally centrifugal pumps under an abnormal state are accompanied by changes in vibration, thus, fault detection of centrifugal pump via vibration monitoring has been proven to be an effective method of enhancing the reliability and safety of machinery. In this paper, a fault diagnostic method for centrifugal pump by local characteristic-scale decomposition (LCD)-approximate Entropy (ApEn) and probabilistic neural network is provided.
Local characteristic-scale decomposition (LCD) is a kind of data-driven and adaptive non-stationary signal decomposition method and hence suitable for processing non-stationary signals such as vibration signals of centrifugal pump [1]. The LCD method can self-adaptively decompose vibration signals into a series intrinsic scale components (ISCs) and a residue with a faster running time and a smaller fitting error. Approximate Entropy (ApEn), proposed by Steven M. Pincus in the early 1990s [2], is introduced to measure the complexity of time series, which has stronger anti-interfering and anti-noise ability. The ApEn of the ISCs obtained from LCD are computed to quantity the fault features.
Probabilistic neural network (PNN) is a kind of neural network based on Bayesian minimum risk criteria (i.e., Bayesian decision theory), which is a feedforward neural network developed from RBF model [3], and can meet the need of real time requirements for engineering practice due to its fast training, high stability, strong supplement capability and good diagnosis robustness. In this paper, the PNN is applied in fault diagnosis for fault recognition of centrifugal pumps.
This paper is structured as follows: Section 2, the fundamental principles of the LCD and PNN are illustrated. Section 3 describes the case study performed to validate the method. Finally, the conclusion is drawn in Section 4.
2. Methodology
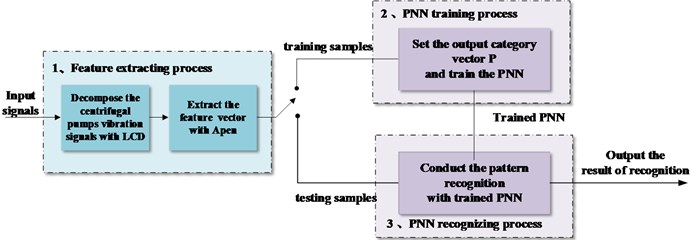
The proposed method has three major steps: (1) the LCD is applied to decompose sensor signals into several ISCs; (2) the ApEn of the ICSs are extracted as signal features; (3) the feature vectors composed by LCD-ApEn are input into the PNN for fault diagnosis. The process of the methodology can be summarized as Fig. 1.
2.1. Local characteristics-scale decomposition method
The LCD method can self-adaptively decomposed a complex signal into a sum of ISCs and a residue with the assumption that any two ISCs are independent of each other. The ISC component must meet the following two conditions [1]:
1) in the entire data set, the signal is monotonic between any two adjacent extreme points;
2) among the whole data set, suppose the number of extrema of the signal x(t) is M, and determine all the extrema (tk,xk), any two adjacent maxima (minima), (tk,xk) and (tk+1,xk+1), are connect by a straight line, as follows:
Fig. 1The process of the methodology
In order to assure the smoothness and symmetry of the ISC, the proportions of and remain constant, as follows:
Generally, a is set as 0.5, thus, Ak/xk= –1. At the time, xk and Ak are symmetrical for the x-axis, which ensure the symmetry and smoothness of the ISC component waveform [4].
Based on the definition of the ISC component, a complex signal x(t) (t> 0), can be decomposed into a sum of ISCs using the LCD method as follows:
1) Suppose the number of extrema of the signal x(t) is M, and the corresponding time of any extrema is tk, which determine all the extrema (tk,xk) (k=1,…,M) of the signal x(t).
2) Compute Ak (k=2,…,M-1) according to Eq. (1). Based on the following equation, the corresponding Lk (k=2,…,M-1) can be calculate:
Since k is from 2 to M-1, the values of L1 and LM should be calculate by extent by extending the boundary of the data, which can be fulfilled by different methods [5-7].
A1(t0,x0) and AM(tM+1,xM+1) can be obtained by the extension two end extrema, thus, the values of L1 and LM can be get [8].
3) All the Lk(k=1,…,M) are connected by the cubic as spline line SL1(t), which is defined as the base line of the LCD.
4) The difference between the data and the base line SL1(t) is the first component h1(t):
5) Separate the first ISC1 from the initial data x(t):
6) Take the residue r1 as the original signal to be processed. Repeat the above process until the residue are constant or monotonic function or a function with no more than twenty extrema. ISC1,…, ISCn and the residue are obtained, as follows:
where ci(t) is the ith ISC and rn(t) is the residue.
The LCD method is applied to decompose the original signal into several ISCs with different time scale and the characteristics. Then, the approximate entropy (ApEn) is used to characterize the probability of the new model of the signal. That is, the values can be change when the centrifugal pump working under different conditions, which can reflect the different fault mode of centrifugal pump. Thus, the LCD-ApEn can be applied to obtain the feature vector.
2.2. A description probabilistic neural network
The Probabilistic Neural Network (PNN) is a supervised neural network with the advantage of fast training, high stability, strong supplement capability, good diagnosis robustness, which was widely used in fault diagnosis [9].
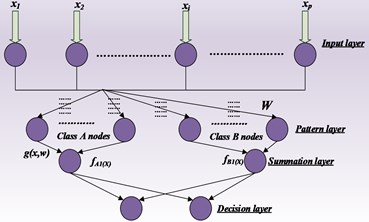
PNN is a feedforward neural network with a parallel 4-year structure: input layer, pattern layer, summation layer and output layer, as showed in Fig. 2. The first layer is the input layer, the number of whose neurons is determined by feature vector, and with the function to transferring samples to each node of model layer [10]. The pattern layer contains nodes with exponential function, whose nodes are as many as training samples. The ability of summation layer is to sum up the input from the pattern layer and obtains the estimated probability densities, the output layer calculate the probability of each mode, the one with the maximum probability density correspond to the kind of recognition model of sample category is 1, all others neurons output is 0 [11].
Fig. 2Probabilistic neural network architecture
3. Case study
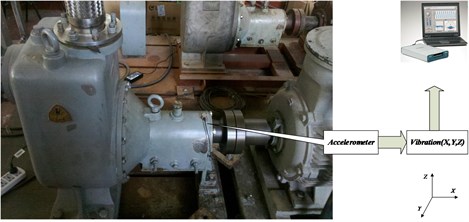
The data from the following centrifugal pump data acquisition system (Fig. 3) was used as the experimental raw data in our study. The vibration signals were acquired from an installed accelerometer, with a sampling rate of 10.24 kHz.
In the experiment, five commonly occurring faults in the centrifugal pump were set, namely, normal, bearing roller wearing, bearing inner race wearing, bearing outer race wearing, and centrifugal pump impeller wearing. For each fault mode, forty samples were acquired and half of them were used as trained samples and others were used as testing samples.
Fig. 3Centrifugal pump data acquisition system
3.1. Feature extraction based on LCD-ApEn
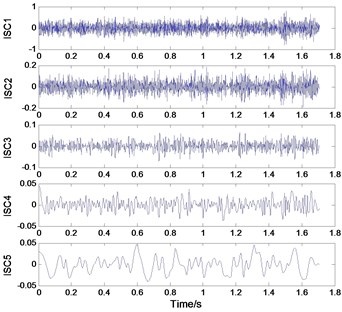
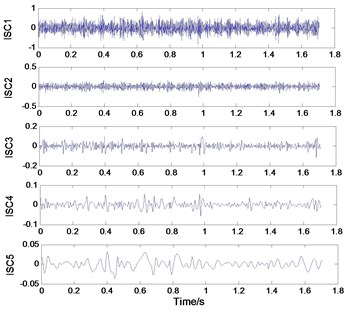
To acquire the fault feature vectors, each vibration signal was processed by local characteristic-scale decomposition to acquire the intrinsic scale components. Fig. 4(a) shows the result of the local characteristic-scale decomposition of the inner race wearing while Fig. 4(b) shows the result of normal. Each signal was decomposed into five ISCs.
Fig. 4Time domain waveform of ISCs of vibration signal of inner race wearing a) and normal b)
a)
b)
Table 1ApEn for ISCs for normal condition
Condition | Fault feature values | ||||
ISC 1 | ISC 2 | ISC 3 | ISC 4 | ISC 5 | |
Normal | 2.1147 | 1.8168 | 1.1501 | 0.5745 | 0.1684 |
2.1128 | 1.8294 | 1.1702 | 0.5688 | 0.1555 | |
2.1140 | 1.8245 | 1.1693 | 0.5735 | 0.1597 | |
2.1129 | 1.8372 | 1.1601 | 0.5716 | 0.1734 | |
2.1149 | 1.8430 | 1.1544 | 0.5801 | 0.1712 | |
Table 2ApEn for ISCs for bearing outer race wearing
Condition | Fault feature values | ||||
ISC 1 | ISC 2 | ISC 3 | ISC 4 | ISC 5 | |
Bearing outer race wearing | 1.9271 | 1.6180 | 0.9051 | 0.3643 | 0.1266 |
1.9285 | 1.6128 | 0.8989 | 0.3573 | 0.1317 | |
1.9301 | 1.6189 | 0.9038 | 0.3520 | 0.1356 | |
1.9293 | 1.6165 | 0.9031 | 0.3567 | 0.1266 | |
1.9292 | 1.6108 | 0.8956 | 0.3809 | 0.1315 | |
Then as shown in Tables 1-5, the ApEn of each ICS for each fualt mode is respectively computed to further extract the fault feature with the established parameter values of m=2 and r=0.25. For convenience, only the first five groups of values of Apens was listed in the table under different fault conditions. For each fault mode, the ApEn of each ICS component decreases as the number of decomposition layers increase. Compared with each condition, we can see that the ApEns are different, which can reflect their different nonlinear generation mechanism However, to recognize the fault mode, the feature vector has to be effectively integrated with classifiers.
Table 3ApEn for ISCs for bearing roller wearing
Condition | Fault feature values | ||||
ISC 1 | ISC 2 | ISC 3 | ISC 4 | ISC 5 | |
Bearing roller wearing | 1.9133 | 1.6114 | 0.9055 | 0.4457 | 0.1433 |
1.9150 | 1.6228 | 0.9196 | 0.4292 | 0.1308 | |
1.9066 | 1.6241 | 0.9123 | 0.4245 | 0.1265 | |
1.9008 | 1.6245 | 0.8801 | 0.4410 | 0.1299 | |
1.8985 | 1.6237 | 0.9338 | 0.4291 | 0.1192 | |
Table 4ApEn for ISCs for impeller wearing
Condition | Fault feature values | ||||
ISC 1 | ISC 2 | ISC 3 | ISC 4 | ISC 5 | |
Impeller wearing | 2.0747 | 1.8762 | 1.0912 | 0.4802 | 0.1646 |
2.0769 | 1.8672 | 1.0978 | 0.4626 | 0.1679 | |
2.0780 | 1.8554 | 1.0991 | 0.4927 | 0.1858 | |
2.0826 | 1.8471 | 1.1296 | 0.4995 | 0.1838 | |
2.0728 | 1.8404 | 1.1421 | 0.5044 | 0.1749 | |
Table 5ApEn for ISCs for bearing inner race wearing
Condition | Fault feature values | ||||
ISC 1 | ISC 2 | ISC 3 | ISC 4 | ISC 5 | |
Bearing inner race wearing | 1.8250 | 1.7110 | 1.0873 | 0.4782 | 0.1092 |
1.8284 | 1.7071 | 1.0868 | 1.4826 | 0.1086 | |
1.8264 | 1.7070 | 1.0973 | 1.4759 | 0.1102 | |
1.8241 | 1.7114 | 1.0939 | 1.4665 | 0.1060 | |
1.8150 | 1.7059 | 1.0950 | 1.4610 | 0.1055 | |
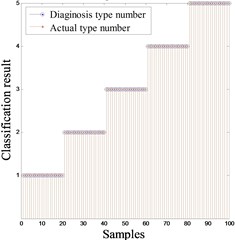
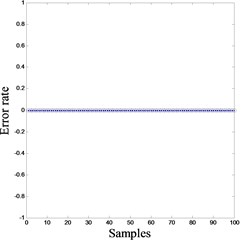
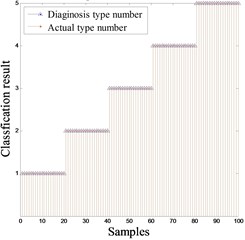
Fig. 5a), b) The result of network training and c) fault diagnosis
a) Training result of PNN
b) Training error of PNN
c) Diagnosis result of PNN
3.2. Fault diagnosis based on PNN
In this section, the Probabilistic Neural Network (PNN) was applied to recognize the states of the centrifugal pump based on the feature vectors obtained by LCD-ApEn.
For each fault mode, 40 samples were acquired and 20 sets of data were used for training network. The total number of training samples is 100. Each group of data was decomposed by LCD and the approximate entropy of the five ISCs was calculated for training as a network input. Then the remaining samples were selected for testing as PNN input. The output results of testing samples are shown as Fig. 5. The classification result No. 1-5 respectively represent the bearing roller wearing, the bearing inner race wearing, the normal condition, the centrifugal pump impeller wearing and the bearing outer race wearing. As showed in Fig. 5, the accuracy rate of fault diagnostic can reach 100 %, which verifies the effectiveness of the proposed feature extraction method.
4. Conclusions
Aiming at the non-stationary and nonlinear characteristics of vibration signals of the centrifugal pumps, a fault-diagnosis method based on LCD-ApEn and PNN is presented in this study. The Local characteristic-scale decomposition combined with ApEn is introduced to extract features from non-stationary signals. The Probabilistic Neural Network is verified as an effective and efficient tool for fault classification. The method can not only process stationary signals but also non-stationary signals which makes it generalized and can be applied to other vibration signals of centrifugal pumps with the advantage of fast computation speed, and good diagnosis robustness. However, we only applied the proposed method to above fault mode, more fault mode related to other parts of centrifugal pump should be taken into consideration for further study.
References
-
Zheng Jinde, Cheng Junsheng, Yang Yu A rolling bearing fault diagnosis approach based on LCD and fuzzy entropy. Mechanism and Machine Theory, Vol. 70, 2013, p. 441-453.
-
Dong Zengshou, Tian Xueqin,Zeng Jianchao Mechanical fault diagnosis based on LMD-approximate entropy and LSSVM. Telkomnika, Vol. 11, Issue 2, 2013, p. 803-808.
-
Sun Zhi-hong, Duan Hong-mei, Hao Jian Zhong Fault diagnosis of diesel engine cylinder wall based on Matlab probabilistic neural network. Computational Problem-Solving (ICCP) International Conference, 2012, p. 465-468.
-
Liu Hongmei, Wang Xuan, Lu Chen Rolling bearing fault diagnosis based on LCD-TEO and multifractal detrended fluctuation analysis. Mechanical Systems and Signal Processing, Vols. 60-61, 2015, p. 273-288.
-
Güneri Ali Fuat, Ertay Tijen, Yücel Atakan An approach based on ANFIS input selection and modeling for supplier selection problem. Mechanical Systems and Signal Processing, Vol. 38, Issue 12, 2011, p. 14907-14917.
-
Cheng Junsheng, Yu Dejie, Yang Yu Application of support vector regression machines to the processing of end effects of Hilbert-Huang transform. Mechanical Systems and Signal Processing, Vol. 21, Issue 3, 2007, p. 1197-1121.
-
Qi K. Y., He Z. J., Zi Y. Y. Cosine window-based boundary processing method for EMD and its application in rubbing fault diagnosis. Mechanical Systems and Signal Processing, Vol. 21, Issue 7, 2007, p. 2750-2760.
-
Luo Songrong, Cheng Junsheng, HungLinh A. Application of LCD-SVD technique and CRO-SVM method to fault diagnosis for roller bearing. Shock and Vibration, 2015.
-
Jiang Rongjun, Weijun Zhu A PNN fault diagnosis method for gas turbine. World Automation Congress (WAC), 2012, p. 1-4.
-
Xu Chunmei, Zhang Hao, Huang Conghua, Peng Daogang Study of fault diagnosis based on probabilistic neural network for turbine generator unit. International Conference on Artificial Intelligence and Computational Intelligence (AICI), Vol. 1, 2010, p. 275-279.
-
Chen Xiaoyue, Zhou Jianzhong, Xiao Jian, Zhang Xinxin, Xiao Han, Zhu Wenlong, Fu Wenlong Fault diagnosis based on dependent feature vector and probability neural network for rolling element bearings. Applied Mathematics and Computation, Vol. 247, 2014, p. 835-847.
About this article
This study is supported by the National Natural Science Foundation of China (Grant Nos. 61074083, 50705005, and 51105019) and by the Technology Foundation Program of National Defense (Grant No. Z132013B002).
