Abstract
To investigate the relation between the dynamic stiffness and bearing capacity for the pile foundation, four model piles with the same dimension were designed in a same test field. Both the dynamic test by the impulse transient response method and the static loading test were performed. Then, a pile-soil finite element model was built, which was calibrated with the measurement data by the model pile tests. Four main parameters were considered: the pile length, pile diameter, Young’s modulus of the soil and Young’s modulus of the pile. A parameter sensitivity analysis was performed, for the intact pile under dynamic impulse loads and static loads. Results show that: for pile foundations with the same type and embedded in the similar ground environment, the dynamic stiffness can reflect the static characteristic for the pile during the period of elastic deformation. Accordingly, a reasonable dynamic stiffness can be used as an alert value for pile capacity.
1. Introduction
The transient response method (TRM), also known as the mechanical mobility method, is a dynamic loading method for the pile inspection. It was proposed in the 1970s by Davis and Dumm [1]. TRM analyses both the velocity and force signals in the frequency domain. The velocity spectrum is divided by the force spectrum to determine the Mobility or Mechanical Admittance spectrum [2], which helps provide more information than the traditional pulse echo method to identify defects near the top of the pile [3]. Another important parameter from Mobility spectrum is the dynamic stiffness. It is defined as the slope of the low frequency linear portion of the spectrum from the origin to the first peak. The dynamic stiffness Kd can be calculated by Eq. (1):
where V(f)and F(f) are the velocity and force signals in the frequency domain. The value of Kd is sensitive to the stiffness of the pile shaft under compression. When the frequency approaches to 0 (f→0), the value of the dynamic stiffness approaches to the static stiffness (Kd→Ks). In practice, however, the frequency of the dynamic impulse cannot be 0 Hz. Therefore, a coefficient α is introduced here to describe the ratio between the dynamic and static stiffness: α=Kd/Ks. Sometimes, then, the pile allowable bearing capacity Q can be estimated by:
where Sa is the guideline value of the pile settlement. This capacity estimation method was proposed in China in 1980s [4], and used for pile capacity evaluation [5, 6]. In Eq. (2), the coefficient α is a bridge between the dynamic test and static capacity estimation, however, it is an empirical value rather than a theoretical one. Accordingly, the relation between the dynamic stiffness and capacity for piles should be analysed.
2. An experiment study on the model piles
2.1. Dynamic loading test
To investigate the relation between the integrity and allowable capacity of piles, four model piles (P1-P4) with different defects were designed and constructed in the same test field. All the piles have the same diameter of 0.6 m, length of 11.2 m, reinforcement ratio of 0.4 %, and the concrete compressive strength class of C25. The pile P1 and P2 were designed with necking defects. The different size of necking formworks were bound with the reinforcement at the location of 5 m and 4 m from the pile top, respectively. The pile P3 was designed as a broken pile. A foam board was placed at the location of 5 m from the pile top. The pile P4 was designed with the segregation. The sand with 30 mm thick was constructed at the location of 5 m from the pile top.
All the pile head were polished. The low-strain integrity test was performed with a hand held hammer (Fig. 1(a)). The mechanical mobility method test was performed with a drop hammer, weighting 106 kg (Fig. 1(b)).
Fig. 1The dynamic loading test for model piles
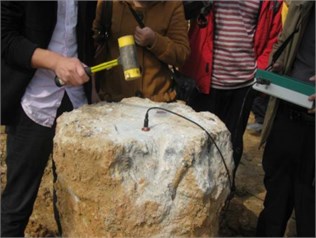
a) Low-strain integrity test
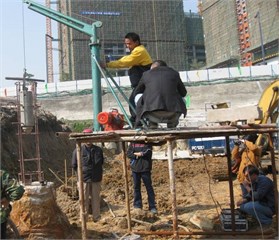
b) Mechanical mobility method test
Fig. 2 shows the test results of the pile integrity. It can be found that: (1) pile P1 has a necking defect at the location of 5.52 m from the pile top; (2) pile P2 has an obvious necking defect at the location of 4.37 m from the pile top; (3) pile P3 is a broken pile and (4) pile P4 is a segregation pile.
By the mechanical mobility method test, according to Eq. (1), the averaged Kd in the low frequency range for the four tested piles were 4.77×10⁸, 3.66×10⁸, 3.49×10⁸ and 1.35×10⁸ N/m.
Fig. 2The pile integrity test results

a) Pile P1

b) Pile P2

c) Pile P3

d) Pile P4
2.2. Static loading test
Two piles (P2 and P3) were selected to perform the static loading test. The loading test equipment with type JCQ-503A was used. The large concrete cubes were used to apply load (Fig. 3). Fig 4 shows the Q-s curve for the relation between load and settlement. The ultimate capacities for P2 and P3 can be calculated from Q-s curve: 635.2 kN for P2 and 622.7 kN for P3.
Fig. 3The pile loading test
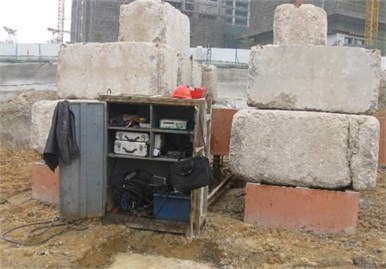
a) Heaped load by concrete cubes
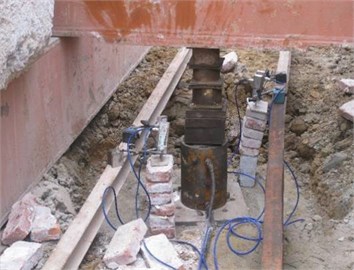
b) The jack and sensors
Fig. 4The Q-s curve for pile P2
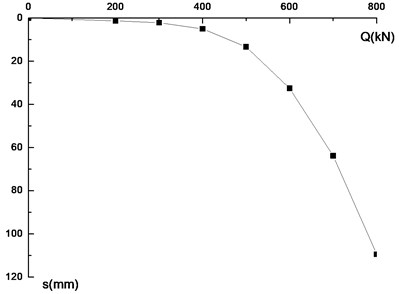
Fig. 5The stiffness and capacity for the test piles
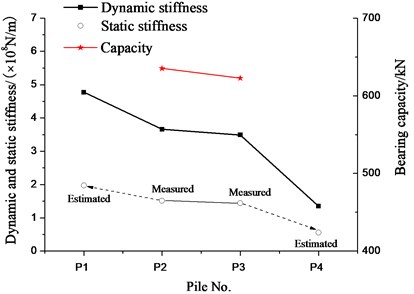
From the test result, the coefficient α=Kd/Ks can be calculated as 2.42 for both P2 and P3. Since all four piles were constructed in the same field, and had the same dimension, it can be regarded that all four piles have the same coefficient α. Then, the static stiffness Ks for P1 and P4 can be estimated, shown in Fig. 5.
It can be found that, there was a positive relation between the dynamic stiffness and static stiffness for all four piles. Moreover, there was also a positive relation between capacity and dynamic stiffness for P2 and P3.
3. The numerical study on the pile foundation
3.1. Dynamic analysis for the intact pile
A 3D pile-soil finite element model was built (Fig. 6). The pile was modelled with the elastic beam element, and with the same dimension with the tested model pile. The soil was modelled with elastic solid element. The measured impulse force signal was input, and response at the pile top can be obtained. Fig. 7 compares the measured and calculated mobility curves below 50 Hz. In low frequency range, the measured and calculated mobility curves match well.
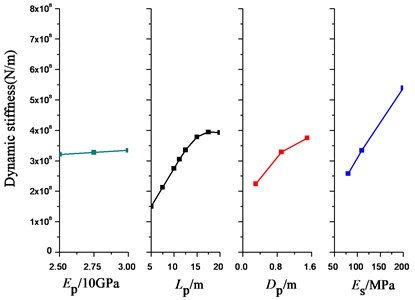
Fig. 8 shows the dynamic stiffness changes with the pile length (Lp), pile diameter (Dp), Young’s modulus of the soil (Es) and Young’s modulus of the pile (Ep). Results show that the pile length, pile diameter and the soil modulus have large influence on the dynamic stiffness, while the pile modulus has smaller influences on the dynamic stiffness of the pile.
Fig. 6The pile-soil finite element model
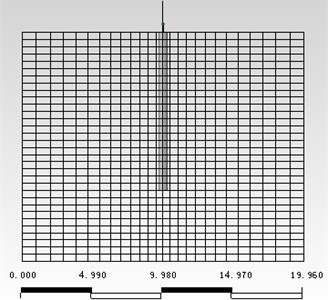
Fig. 7Mesured and calculated mobility
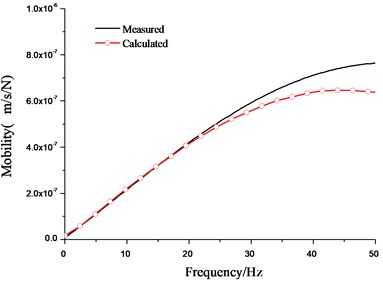
Fig. 8Calculated dynamic stiffness changes with different factors
3.2. Static loading analysis for the intact pile
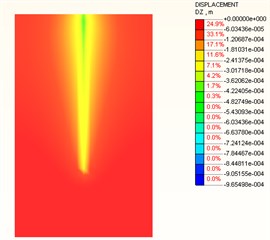
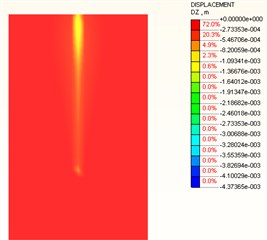
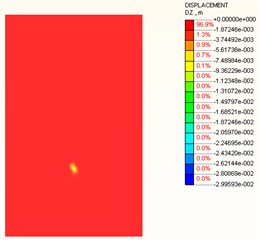
A contact element was added between the pile-soil surface, and the Mohr-Coulomb yielding criterion was employed for the soil. Fig. 9 shows the soil displacement field. When the load is small, a settlement trough can be observed around the pile. The largest settlement was at the pile top. When the load reaches 400 kN, the soil settlement around the pile was obviously large. When the load reaches 600 kN, an obvious displacement can be observed at the pile bottom, which means a plastic flow occurs at the pile-soil contact surface.
Fig. 9Vertical displacement of soil under different loads
a) 200 kN
b) 400 kN
c) 600 kN
Similar to Section 3.1, the four parameters were analysed. Fig. 10 shows the Q-s curves influenced by Lp, Dp, Es and Ep. The inflection point of the curve was affected by the pile length and diameter. Accordingly, the two parameters have the large influence on the Q-s curve. The Es affect the slope after the inflection point, which also affect the pile ultimate capacity rather than the static stiffness. The parameter of Ep has the least contribution to the Q-s curve.
Fig. 10Load-settlement curves influenced
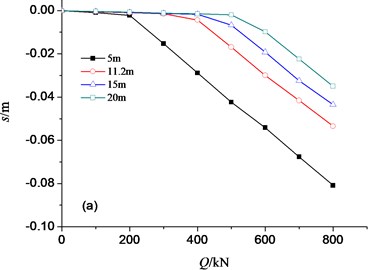
a)Lp
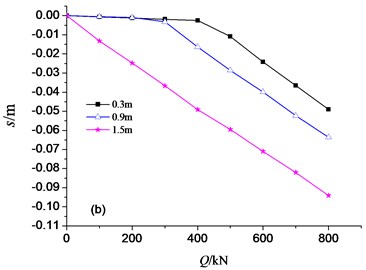
b)Dp
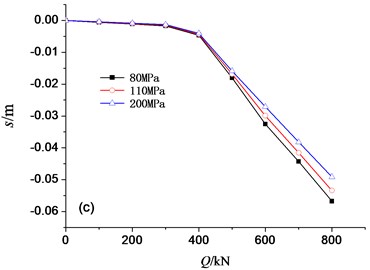
c)Es
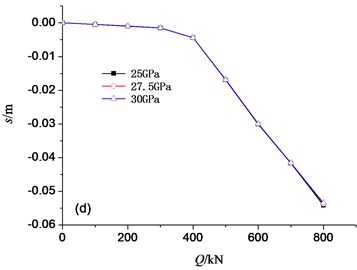
d)Ep
Fig. 11Parameter sensitivity analysis
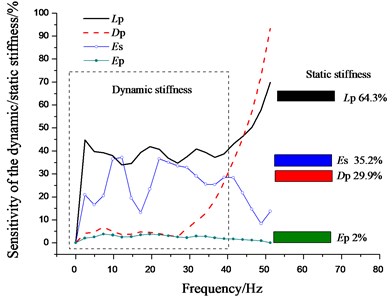
3.3. Parameter sensitivity analysis for the intact pile
The parameter sensitivity was shown in Fig. 11. Four parameters were considered to analyse the dynamic stiffness-frequency curve. Meanwhile, the parameter sensitivity for static stiffness was also plotted, by analysing the initial linear section of the Q-s curves. It can be found that, in the early stage of the pile loading test, the deformation of pile-soil system is linear. The sequence of sensitivity for the dynamic and static stiffness kept the same. That is, when the pile capacity was controlled by pile displacement, the dynamic test can reflect the static characteristics well to the pile under elastic deformation.
4. Conclusions
By the experiment for the model piles and numerical study, the relation between the dynamic stiffness and bearing capacity for the pile foundation were analysed. Some conclusions can be drawn below:
1) There is a positive relation between the dynamic stiffness and bearing capacity for the similar type of pile foundation embedded in the similar soil layers.
2) The results by the impulse transient response method can reflect the static characteristic for the pile during the elastic deformation. Accordingly, the dynamic stiffness can be used as an alert value to estimate the pile capacity.
References
-
Davis A. G., Dumm C. S. From theory to field experience with the non-destructive vibration testing. Proceeding of Institution of Civil Engineers, Part 2, Issue 57, 1974, p. 571-593.
-
Liang L., Beim J. Effect of soil resistance on the low strain mobility response of piles using impulse transient response method. The 8th International Conference on the Application of Stress Wave Theory to Piles, 2008, p. 435-441.
-
Rausche F. Non-destructive evaluation of deep foundations. Proceedings of the Fifth International Conference on Case Histories in Geotechnical Engineering, 2004, p. 1-9.
-
Xu Y. Z. Determination of pile bearing capacity by dynamic test. Chinese Journal of Geotechnical Engineering, Vol. 14, Issue 1, 1992, p. 74-83.
-
Zheng C. T., Wang Y., Xu S. J, et al. Pile bearing capacity measurement by steady mechanical impedance method. Water Resources and Hydropower Engineering, Vol. 28, Issue 8, 1997, p 50-52.
-
Ma M., Liu J. L., Ke Z. T., et al. Bearing capacity evaluation of bridge piles using impulse transient response method. The 13th International Symposium on Structural Engineering, 2014, p. 2048-2060.
About this article
The authors gratefully acknowledge the support of the Research Funds from Beijing Jiaotong University (Project No. 2014RC033).
