Abstract
This work focuses on a method which experimentally recognizes faults of gearboxes using wavelet packet and two support vector machine models. Two wavelet selection criteria are used. Some statistical features of wavelet packet coefficients of vibration signals are selected. The optimal decomposition level of wavelet is selected based on the Maximum Energy to Shannon Entropy ratio criteria. In addition to this, Energy and Shannon Entropy of the wavelet coefficients are used as two new features along with other statistical parameters as input of the classifier. Eventually, the gearbox faults are classified using these statistical features as input to least square support vector machine (LSSVM) and wavelet support vector machine (WSVM). Some kernel functions and multi kernel function as a new method are used with three strategies for multi classification of gearboxes. The results of fault classification demonstrate that the WSVM identified the fault categories of gearbox more accurately and has a better diagnosis performance as compared to the LSSVM.
1. Introduction
Fault diagnosis of gearboxes is one of the most common and intricate challenges in plants. Analysis of vibration signal is a principal method for gearbox fault diagnosis. The procedure for a fault diagnosis of a gearbox can be stated in several steps: data acquisition, signal processing, feature selection and diagnostics [1, 2]. To analyze vibration signals, some methods such as time [3, 4], frequency [5], and time-frequency domain [6] have been investigated. Between these, wavelet transform [7-10] has progressed in the last two decades, and outweighs the other time-frequency ways, although it is lacking in a few aspects as well. Discrete wavelet transform is primarily considered as an efficient tool for vibration based signal processing for fault detection. Wavelet analysis could provide local features in both time and frequency domains and has the feature of multi-scale, which enables wavelet analysis to distinguish the abrupt components of the vibration signal [11]. The foundations of Support Vector Machines (SVM) have been developed by Vapnik [12, 13] which is applied to both pattern recognition [14-18] and regression forecasting [19-24]. The effectiveness of wavelet based features for fault diagnosis of gears using SVM and proximal support vector machines has been revealed by Saravanan et al. [25]. Qu and Zuo [26] utilized a SVM to identify the wear degree of slurry pump. Sun et al. [27] predicted the remaining life of a bearing by establishing a SVR-based model. Hou and Li [28] optimised the parameters of SVR through an evolution strategy and formulated a SVR-based short-term fault prediction strategy. Shen et al. [29] presented a novel intelligent gear fault diagnosis model based on empirical mode decomposition and multi-class transductive support vector machine. Xian and Zeng [30] developed an intelligent fault diagnosis procedure based on wavelet packet transform (WPT) and hybrid SVM. Zamanian and Ohadi [31] presented a method for feature extraction based on exact wavelet analysis to improve the fault diagnosis of gears. In their study, feature extraction was based on maximization of local Gaussian correlation function of wavelet coefficients. They used from a linear support vector machine to classify feature sets extracted with the presented method.
The rest of this paper is outlined as follows. Section 2 briefly describes the fundamental theory of wavelet packet decomposition and two wavelet selection criteria. The proposed new machine health status identification method is presented in Section 3, followed by the experimental verification tests using both bearing and gearbox datasets as stated in Section 4. In Section 5, the effect of different wavelet basis functions on the performance of the proposed scheme is discussed. Conclusions are drawn in Section 6.
2. Theoretical background
2.1. The review of wavelet packet transform
Wavelet packet transform is an extension of discrete wavelet transform. The signals are decomposed into a hierarchical structure of detail and approximations at limited levels as follows:
where Di(t) denotes the wavelet detail and Aj(t) stands for the wavelet approximation at the jth level [1]. A wavelet packet is a function with three indices of integers i, j and k which are the modulation, scale and translation parameters, respectively:
The wavelet functions ψj are determined as follows:
The original signal f(t) is defied after j level of decomposition as follows:
While the wavelet packet component signal fij(t) are stated by a linear combination of wavelet packet functions ψij,k(t) as follows:
where the wavelet packet coefficients cij,k(t) are calculated by:
Providing that the wavelet packet functions satisfy the orthogonality:
Two wavelet selection criteria are used and compared to select a suitable wavelet for feature extraction of the problem.
2.2. Maximum relative wavelet energy criterion
Relative wavelet energy gives information about relative energy with associated frequency bands and can detect the degree of similarity between segments of a signal [32, 33]. The energy at each resolution level n, will be the energy content of signal at each resolution is estimated by:
where ‘m’ is the number of wavelet coefficients and Cn,i is the ith wavelet coefficient of nth scale. The total energy can be calculated as follows:
The distribution of energy probability is defined as follows [33]:
where ∑npn=1, and the distribution, pn, is considered as a time scale density. The Total Energy is calculated for each scale and for vibration signals at different rotor speed and for different loading conditions using healthy and faulty gearbox conditions.
2.3. Maximum energy to Shannon entropy ratio criterion
A suitable wavelet is chosen as the base wavelet, which can extract the maximum amount of Energy while minimizing the Shannon entropy of the corresponding wavelet coefficients. The amount of the Energy and Shannon entropy of a signal’s wavelet coefficient is shown by Energy to Shannon Entropy ratio [34] and is given as:
In Eq. (12), the entropy of signal wavelet coefficients is given as follows:
The energy probability distribution of the wavelet coefficients (pi), is given by:
with ∑mi=1pi=1, and pilog2pi=0 if pi=0.
3. Review of machine learning techniques
3.1. Multi class support vector machine
The SVM is a supervised learning method based on statistical learning theory formulated by Vapnik [12]. The SVM maps the low dimensional data to the high dimensional feature space, and aims to solve a binary problem by searching an optimal hyper plane which can separate two datasets with the largest margin in the high dimensional space. The optimal hyper plane is established through a set of support vectors from the original datasets and these subsets form the boundary between the two classes. The classification function can be described as follows:
where the nonlinear mapping function Ф(x) maps the input feature vector in to a higher dimensional feature space, b is the bias, w is the weight vector. b and w are used to determine the position of the separating hyper-plane. Some problems about multi-class classification have been researched [20, 21]. As seen before, really SVM is a binary classifier. However, rotating machinery may usually suffer more than two faults. To tackle this problem, in this paper three strategies, such as one-against-one (OAO), one-against-all (OAA) and one against others (OAOT) are used [35].
3.2. Least square support vector machine
LSSVM is a reformulation of standard SVM which was proposed by Suykens and Vandewalle [36]. In contrast to SVM, the LSSVM uses a least squares cost function and involves equality constraints instead of inequalities in the problem formulation. Given the training set {(xi,yi)}ni=1 with xi∈Rn and yi∈(-1,1). To class the training set, LSSVM has to find the optimal (with maximum margin) separating hyper plane so that LSSVM has good generalization ability. All of the separating hyper planes have the following representation in the feature space: y(x)=ωTФ(x)+b, where ω is the normal vector of the separating hyper plane. Margin maximization is obtained by minimizing the squared norm of ω while also minimizing the fitting error ζi of the training set. The resulting optimization problem of LSSVM can be formulated in the following form:
where ˊγ is the regularization parameter. The Lagrangian comes in the form:
where αi is the Lagrange multiplier. According to the conditions for optimality yield, the following equations must be satisfied: ∂L/∂ω=0; ∂L/∂b=0; ∂L/∂αi=0; and ∂L/∂ζi=0. Then a linear system for classification and regression can be obtained from the Karush-Kuhn-Tucker conditions [37]. Its solution is found by solving the system of linear equations expressed in matrix form as follows:
where P=[Ф(x1)Ty1,…,Ф(xl)Tyl], →1=[1,…,1]T, Q=[y1,…,yl]T, α=[α1,…,αl]T.
Then the regression function of LSSVM is obtained:
where the kernel function can be given by K(xi,x)=ФT(xi)Ф(x) and it meets Mercer’s condition. In the process of fault diagnosis, it is very important to choose a reasonable kernel function for support vector machine. Different kernel functions will obtain different decision functions so that determine the operation performance for support vector machine. Generally, two kinds of kernels, i.e. local kernel and global kernel, are utilized to construct the decision functions [38]. A typical local kernel is radial basis function kernel, which is defined as follows:
where σ is the width of the RBF kernel. A typical global kernel is the polynomial kernel, which is defined as follows:
where d denotes the kernel parameter. In order to improve the classification performance and generalization ability for LSSVM, a multi-kernel (Km) support vector machine (MSVM) is constructed in this study by a controlled parameter β based on the local kernel function Kr and global kernel function Kp:
where 0 <β<1 is the controlled parameter. To be an admissible kernel in SVM, kernels must satisfy Mercer’s Theorem. Since Kr and Kp all satisfy Mercer’s Theorem, therefore a convex combination of them also satisfy Mercer’s Theorem. In the MSVM model, there are four parameters: weight parameter β, penalty constant C, kernel parameters σ and d. The weight parameter is used for weight assignment for different kernel function. The penalty constant is used for these samples misclassified by the optimal separating plane and its role is to strike a proper balance between the calculation complexity and the separating error. The kernel function parameters σ and d reflect the characteristics of the training data. All these parameters affect the generalization of MSVM and exert a considerable influence on the performance of MSVM. However, it is not known beforehand which parameters are best for a given problem. In this work, parameters in multi-kernel SVM are randomly selected. The LSSVM was initially proposed to deal with binary classification problems. Multi-classification problems can also be solved by combining a number of binary LSSVMs using any of a number of strategies, such as one-versus-one, one-versus-all and one against others. In this study, OAO, OAA and OAOT methods are used.
3.3. Wavelet support vector machine
The wavelet function group can be defined as:
where x, a, c∈R, a is a dilation factor, and c is a translation factor. Assuming that ψ(x) is the wavelet function of 1D, the multi-dimensional wavelet function can be defined using tensor theory as:
where x=(x1,x2,,…,xN)∈RN and, N is the dimension number. Let ψ(x) denotes a mother kernel function. Then dot-product wavelet kernels are:
The decision function for classification is [39]:
where the xji denotes the jth component of the ith training example. The Mexican hat mother wavelet is ψ(x)=ψ(1-x2)exp(-x2/2), and the corresponding wavelet kernel function is:
Similar to Mexican hat wavelet kernel function, Morlet wavelet kernel is also an admissible SV kernel function. The Morlet function is defined as follows:
And the corresponding wavelet kernel function is:
In this paper, four kernel functions are used: wavelet Morlet, wavelet Mexican hat, Gaussian wavelet kernel and wavelet Shannon. The multi-class classification strategy, such as OAA, OAO and OAOT with different wavelet kernel functions is used for classification in this paper.
4. Experimental validation of the proposed intelligent machine fault diagnosis scheme
Rolling element bearings and gears are the most common and important components used in rotating machinery such as gearboxes. Faults occurring on the surface of these components could cause unexpected machine breakdown. Therefore, it is necessary to develop an effective intelligent gearbox fault diagnosis method. To verify the effectiveness of the proposed method, new gearbox datasets provided by the by Ottawa University in collaboration with the Prognostics and Health Management Society and the test rig experimental setup datasets collected in the Shahrekord University are analyzed.
4.1. Case 1. Ottawa gearbox vibration datasets
Data collected in this section come from Ottawa University gearbox under Prognostics and Health Management Society [40]. Data were sampled synchronously from accelerometers mounted on both the input and output shaft retaining plates of the gearbox. An attached tachometer generates one pulse per revolution providing very accurate zero crossing information. Data were collected at different variable shaft speed under high and low loading. The test runs include seven different combinations of faults and one fault-free reference run. The signals were sampled with sampling frequency 66.666 kHz and the sampling horizon was 4 s long.
4.2. Case 2. Shahrekord experimental setup
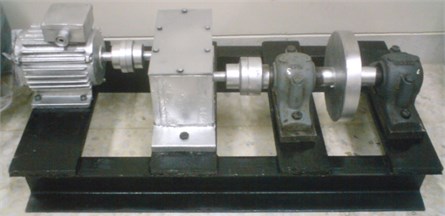
The experimental setup at Shahrekord University to collect dataset consists of a one-stage gearbox with spur gears, a flywheel and an electrical motor. The test rig has been shown in Fig. 1. Vibration signals are obtained in the radial direction by mounting the accelerometer on the top of the gearbox. “Easy Viber” data collector and its software, “SpectraPro”, are used for data acquisition. The sensitivity and dynamic range of accelerometer probe are 100 mv/g and ±50 g. The signals are sampled at 16000 Hz lasting 4 s. In the present study, four pinion wheels are used. The vibration signal from accelerometer is captured for the following conditions: good gear, gear with tooth breakage, chipped tooth gear and eccentric gear. For bearing vibration signal acquisition five self-aligning ball bearings (1209 K) are used. One new bearing is considered as good bearing. In the other three bearings, some defects are created and then various bearings are installed and the raw vibration signals acquired on the bearing housing. So the vibration signals are captured for the following conditions: good bearing, bearing with spall on inner race, bearing with spall on outer race, bearing with spall on ball and bearing with combine defect.
Fig. 1Fault simulator set up in Shahrekord University
5. Result and discussion
Based on Table 1, Daubechies wavelet (db44) and Meyer are selected as the best base wavelet among the other wavelets considered from the Maximum Relative Energy and Maximum Energy to Shannon Entropy criteria respectively. The wavelet packet coefficients of all signals with db44 and Meyer are calculated at the four eighth level of decomposition. After WPT, 2304 statistical features are extracted from the 256 nodes at eight decomposition levels. When applying wavelet transform to a signal, if the Shannon entropy measure of a particular scale is minimum then we can say that a major defect frequency component exists in the scale but, in the present study out of 256 scales considered, the scale having the Maximum Energy to Shannon Entropy of healthy condition is selected, and the statistical features of the wavelet packet coefficient corresponding to the selected level are calculated.
Table 1Comparison of parameters for wavelet selection
Wavelet type | PHM gearbox dataset | Shahrekord gearbox dataset |
Maximum relative wavelet energy | Energy to Shannon entropy ratio | |
Meyer | 0.011569 | 101.54 |
symlet 16 | 0.013278 | 90.19 |
cofi5 | 0.016934 | 67.90 |
rbio6.8 | 0.017341 | 60.73 |
bior6.8 | 0.021121 | 58.63 |
db44 | 0.104178 | 48.55 |
Statistical moments like kurtosis, skewness and standard deviation are descriptors of the shape of the amplitude distribution of vibration data, and have some advantages over traditional time and frequency analysis, such as its lower sensitivity to the variations of load and speed. In the present paper, authors’ use statistical moments like standard deviation, crest factor, absolute mean amplitude value, variance, kurtosis, skewness and fourth central moment as features to effectively indicate early faults occurring in rolling element bearings and gears. In addition, energy and Shannon entropy of the wavelet coefficients are used as two new features along with other statistical parameters as input of the classifier. These statistical features are fed as input to the soft computing techniques like SVM for fault classification. Two cases of input data and feature sets are considered for classification. In case A, statistical parameters of wavelet packet transform are considered (for each type of the gearbox fault). Case B is related to the condition that statistical features in optimal level, which has been extracted based on the criteria of Maximum Energy to Shannon Entropy ratio, are considered (for each type of gearbox fault). In addition, energy and Shannon Entropy factors are used as two new features as features sets in this case. Table 2 shows the results of classification of gearbox with Maximum Energy to Shannon Entropy criterion. In the case B, by Maximum Energy to Shannon Entropy ratio criterion (Table 2), for test set, correctly classified instances for LSSVM and WSVM are 91.11 % and 95 % respectively. While using 10-fold cross validation average classification accuracies are 90.55 % and 93.88 % for LSSVM and WSVM respectively.
Table 2Classification performance (maximum energy to Shannon entropy criterion)
Parameters | LSSVM | WSVM | |||
Test set | 10-fold cross validation | Test set | 10-fold cross validation | ||
Correctly classified | Case A | 160 (88.88 %) | 156 (86.66%) | 168 (93.33 %) | 164 (91.11 %) |
Case B | 164 (91.11 %) | 163 (90.55 %) | 171 (95 %) | 169 (93.88 %) | |
Incorrectly classified | Case A | 20 (11.11 %) | 24 (13.33 %) | 12 (6.66 %) | 16 (8.88 %) |
Case B | 16 (8.88 %) | 17 (9.44 %) | 9 (5 %) | 11 (6.11 %) | |
Total number of instances | 180 | 180 | 180 | 180 | |
Training time (s) | Case A (LSSVM) | 37.05 | |||
Case B (LSSVM) | 15.47 | ||||
Case A (WSVM) | 137.41 | ||||
Case B (WSVM) | 84.73 | ||||
Table 3 shows accuracy associated with each technique for fault classification with Maximum Relative Wavelet Energy criterion. The correctly classified instances using test set for LSSVM and WSVM are 87.77 % and 92.22 % respectively with two new features. For 10-fold cross validation, average classification accuracies for LSSVM and WSVM are 86.11 % and 90.55 % respectively, which is slightly less than the previous case.
From Tables 2 and 3, we found that the Maximum Energy to Shannon Entropy criterion with two new features is better for fault classification of gearbox with respect to Maximum Relative Wavelet Energy criterion.
Table 3Classification performance (maximum relative wavelet energy criterion)
Parameters | LSSVM | WSVM | |||
Test set | 10-fold cross validation | Test set | 10-fold cross validation | ||
Correctly classified | Case A | 154 (85.55 %) | 150 (83.33 %) | 162 (90 %) | 160 (88.88 %) |
Case B | 158 (87.77 %) | 155 (86.11 %) | 166 (92.22 %) | 163 (90.55 %) | |
Incorrectly classified | Case A | 26 (14.44 %) | 30 (16.66 %) | 18 (10 %) | 20 (11.11 %) |
Case B | 22 (12.22 %) | 25 (13.88 %) | 14 (7.77 %) | 17 (9.44 %) | |
Total number of instances | 180 | 180 | 180 | 180 | |
Training time (s) | Case A (LSSVM) | 40.94 | |||
Case B (LSSVM) | 17.79 | ||||
Case A (WSVM) | 144.28 | ||||
Case B (WSVM) | 94.05 | ||||
Table 4The classified result of experiment data using WSVM with three methods
Operating condition | Fault classification accuracy based on SVM with kernel (%) | ||||
Morlet c= 29.7, a= 0.74 | Mexican hat c= 38.7, a= 0.83 | Gaussian | Shannon | ||
Out race fault | OAOT | 95 | 94.50 | 93.10 | 88.40 |
OAA | 94.55 | 93.65 | 92.35 | 83.40 | |
OAO | 90.50 | 85.60 | 85.60 | 82.40 | |
Inner race fault | OAOT | 95.10 | 95.33 | 92.10 | 90.15 |
OAA | 94.50 | 94.50 | 91.65 | 87.12 | |
OAO | 91.50 | 88.55 | 88.50 | 85.50 | |
Roller fault | OAOT | 97.20 | 96.50 | 93.25 | 84.45 |
OAA | 95.50 | 93.50 | 92.50 | 83.52 | |
OAO | 91.60 | 90.45 | 90.50 | 82.60 | |
Combine fault | OAOT | 96.10 | 95.15 | 93.35 | 85.00 |
OAA | 96.50 | 94.50 | 91.50 | 84.74 | |
OAO | 92.75 | 92.40 | 92.40 | 82.15 | |
Average accuracy (bearing) | OAOT | 95.85 | 95.37 | 92.95 | 87.00 |
OAA | 95.26 | 94.03 | 92.00 | 84.69 | |
OAO | 91.58 | 89.25 | 89.25 | 83.16 | |
Chipped tooth gear | OAOT | 97.80 | 96.60 | 96.60 | 85.56 |
OAA | 97.50 | 91.85 | 91.44 | 85.50 | |
OAO | 86.01 | 85.52 | 85.00 | 82.50 | |
Eccentric gear | OAOT | 93.55 | 92.36 | 91.53 | 86.90 |
OAA | 92.83 | 91.52 | 90.88 | 84.51 | |
OAO | 91.50 | 90.89 | 90.63 | 81.52 | |
Broken-tooth gear | OAOT | 91.60 | 90.05 | 88.74 | 85.40 |
OAA | 90.63 | 89.90 | 86.88 | 83.49 | |
OAO | 88.90 | 86.60 | 84.67 | 80.50 | |
Good gearbox | OAOT | 93.65 | 93.30 | 92.44 | 89.42 |
OAA | 93.30 | 93.15 | 90.78 | 88.50 | |
OAO | 92.80 | 91.70 | 90.60 | 86.77 | |
Average accuracy (gear) | OAOT | 94.15 | 93.07 | 92.32 | 86.82 |
OAA | 93.56 | 91.60 | 89.99 | 85.50 | |
OAO | 89.80 | 88.67 | 87.72 | 82.82 | |
Furthermore, the accuracy comparison of WSVM with OAOT, OAA and OAO with Maximum Energy to Shannon Entropy is listed in Table 4. From Table 4, it is clear the proposed method based on wavelet support vector machine using the Morlet wavelet kernel has improved the classification accuracy by 9.97 % with respect to Haar wavelet kernel. In this case, the overall average classification accuracy is 99.67 %. From Table 4, we find that the classification accuracy with OAOT strategy is better than OAA and OAO. The classification accuracy with LSSVM and Maximum Energy to Shannon Entropy criterion is shown in Table 5. From Table 5, we find that, the classification accuracy with multi kernel by OAOT is better than RBF and polynomial kernels.
Table 5The classified result of experiment data using LSSVM with three methods
Operating condition | Fault classification accuracy based on LSSVM with kernel (%) | |||
Polynomial (d = 3) | RBF (C = 30, γ = 2) | Multi kernel | ||
Out race fault | OAOT | 86.45 | 87.55 | 88.10 |
OAA | 84.35 | 85.36 | 87.38 | |
OAO | 82.47 | 83.50 | 86.50 | |
Inner race fault | OAOT | 91.05 | 93.45 | 95.40 |
OAA | 86.15 | 90.50 | 91.62 | |
OAO | 86.03 | 88.42 | 90.55 | |
Roller fault | OAOT | 84.23 | 85.01 | 87.10 |
OAA | 83.40 | 85.14 | 90.50 | |
OAO | 82.54 | 83.08 | 87.52 | |
Combine fault | OAOT | 88.77 | 90.49 | 92.27 |
OAA | 85.60 | 88.50 | 90.50 | |
OAO | 84.46 | 86.60 | 88.53 | |
Average accuracy (bearing) | OAOT | 87.62 | 89.12 | 90.71 |
OAA | 84.87 | 87.37 | 90.00 | |
OAO | 83.87 | 85.40 | 88.27 | |
Chipped tooth gear | OAOT | 91.00 | 92.54 | 93.10 |
OAA | 90.10 | 90.25 | 91.10 | |
OAO | 85.00 | 87.57 | 89.51 | |
Eccentric gear | OAOT | 90.25 | 91.18 | 91.70 |
OAA | 88.20 | 88.75 | 89.55 | |
OAO | 85.44 | 87.47 | 89.52 | |
Broken-tooth gear | OAOT | 85.55 | 86.82 | 87.10 |
OAA | 85.42 | 86.00 | 86.50 | |
OAO | 85.46 | 85.60 | 88.33 | |
Good gearbox | OAOT | 92.50 | 93.56 | 94.15 |
OAA | 91.22 | 92.58 | 93.20 | |
OAO | 90.50 | 91.53 | 92.07 | |
Average accuracy (gear) | OAOT | 89.82 | 91.02 | 91.51 |
OAA | 88.73 | 89.39 | 90.08 | |
OAO | 86.60 | 88.04 | 89.85 | |
Fig. 2 and 3 show the testing time and training time of WSVM and LSSVM with three strategies. We can observe that the training time in OAA is bigger than in OAO and OAOT under all kernel functions. As shown in Fig. 2, the performance of the Morlet kernel for machinery fault diagnosis is acceptable. From Fig. 2, we find that the Morlet kernel has the least testing and training time with respect to other kernel functions. It is clear from Fig. 3, the multi kernel has the least training and testing time with OAOT algorithm. Therefore, the OAOT strategy is better than OAO and OAA for the problem.
In the case of polynomial kernel, d is the important parameter of polynomial kernel, and it is not known before hand how much value of d is the best for classification problem. A 10-fold cross-validation is used to find the best value of d and the one with lowest cross validation error is picked. We study the value of d from the range d={1, 2,…, 8}, the accuracy of three strategies for the multi-class classification is compared in Fig. 4. From Fig. 4, we can know that in the case of OAOT algorithm, the accuracy of classification reaches the highest point (88.72 %) when d=3 and the lowest classification rate as d=1. With the grown of parameter d, the over-fitting or under-fitting problem is caused and the recognition rate degrades. Generally, the OAOT algorithm is better than OAO algorithm and OAA algorithm under the same value of d, and their best classification rate is 85.23 % and 86.80 %, respectively. Therefore, the optimal result of the polynomial kernel parameter is d=3.
Fig. 2Training time and testing time for WSVM

a) Training time for WSVM
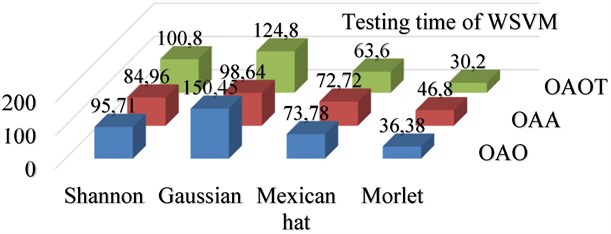
b) Testing time for WSVM
Fig. 3Training time and testing time for LSSVM
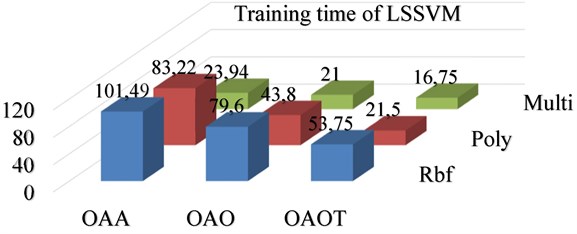
a) Training time for LSSVM
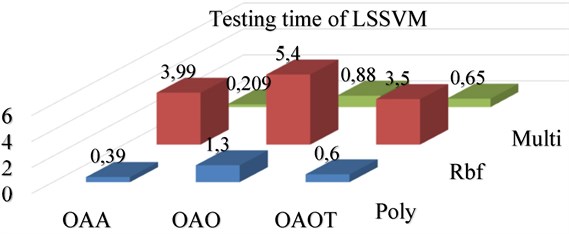
b) Testing time for LSSVM
Fig. 5 shows that the accuracy of LSSVM using OAOT algorithm with the RBF kernel reaches the highest point (90.07 %) with C=30 and γ=2. Similarly, when we apply the RBF kernel to OAO algorithm and OAA algorithm, the best classification ratio is 86.72 % and 88.38 %, respectively.
From Table 5, in the case of multi kernel at LSSVM, we observe that the highest accuracy is 91.11 % with OAOT. Fig. 6 shows that the accuracy of WSVM using OAOT algorithm with Mexican hat kernel reaches the highest point (94.22 %) with c=38.7 and a=0.83. Similarly, when we apply the Mexican hat kernel to OAO algorithm and OAA algorithm, the best classification ratio is 88.96 % and 92.81 %, respectively. Fig. 7 shows that the accuracy of WSVM using OAOT algorithm with the Morlet kernel function reaches the highest point (95 %) with c=29.7 and a=0.74. Similarly, when we apply the Morlet kernel to OAO algorithm and OAA algorithm, the best classification ratio with same a, and c is 90.69 % and 94.41 %, respectively. Fig. 8 shows that the accuracy of MSVM using OAOT algorithm with the Shannon kernel reaches the highest point (86.91 %) with C=50 and number of vanishing moment (a=0.4). Similarly, when we apply the Shannon kernel to OAO algorithm and OAA algorithm, the best classification ratio is 82.99 % and 85.09 %, respectively.
Fig. 4Comparison of accuracy of three algorithms based on WPT feature extraction with different d for polynomial kernel
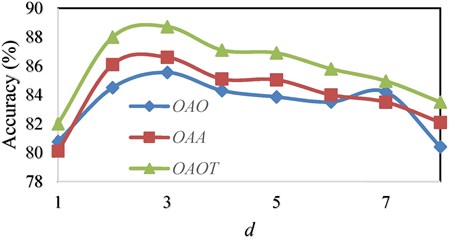
Fig. 5Comparison of accuracy using OAOT algorithm based on WPT feature extraction with RBF kernel in different (C, γ)
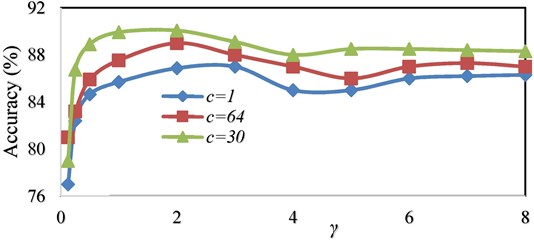
Fig. 6Comparison of accuracy using OAOT algorithm based on WPT feature extraction with Mexican hat kernel in different (c, a)
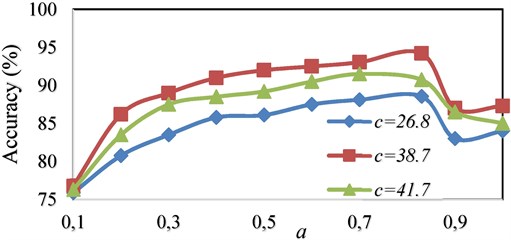
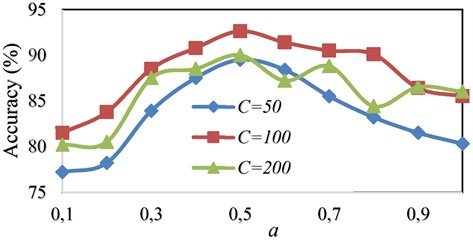
Fig. 9 shows that the accuracy of MSVM using OAOT algorithm with the Gaussian kernel reaches the highest point (92.63 %) with C=100 and a=0.5. Also, when we apply the Gaussian kernel to OAO algorithm and OAA algorithm, the best classification ratio is 88.48 % and 90.99 %, respectively.
Fig. 7Comparison of accuracy using OAOT algorithm based on WPT feature extraction with Morlet kernel in different (c, a)
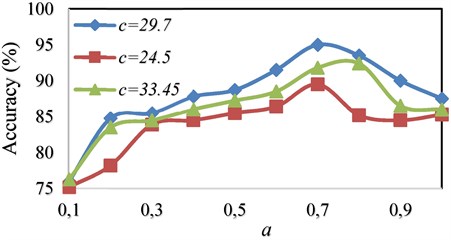
Fig. 8Comparison of accuracy using OAOT algorithm based on WPT feature extraction with Shannon kernel in different (C, a)
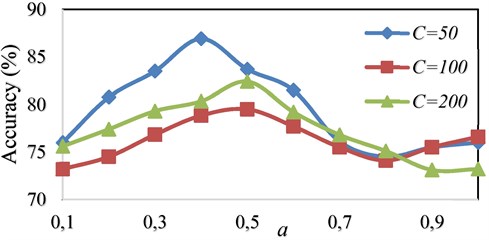
Fig. 9Comparison of accuracy using OAOT algorithm based on WPT feature extraction with Gaussian kernel in different (C, a)
The authors declare that they do not have any conflict of interests in their submitted paper.
6. Conclusions
This study presents, a methodology for detection of gearbox faults by classifying them using two SVM model like WSVM and LSSVM. First, wavelet packet transform applied over the signal, employing the six mothers wavelet. Two wavelet selection criteria Maximum Energy to Shannon Entropy ratio and Maximum Relative Wavelet Energy are used and compared to select an appropriate wavelet for feature extraction. Results obtained from the two criteria show that the wavelet selected using Maximum Energy to Shannon Entropy ratio criterion gives better classification efficiency. Two soft computing methods were good, but the results of faults classification with WSVM are better than LSSVM. To find very efficient features for classification, Maximum Energy to Shannon Entropy ratio was employed to search for the optimal level decomposition level of wavelet packet and consequently the features were reduced. In addition, the Morlet, Mexican hat, Gaussian and Shannon wavelet kernel functions are used to construct the WSVM algorithms. The results show that the Morlet kernel is more accurate and faster than other wavelet kernel function for fault classification of gearbox. As a new idea, energy and Shannon entropy have been applied as two new features along with statistical parameters as input of SVM. The obtained results indicate that the accuracy of the classifier has been increased between 1 to 4 percentage points by considering these two features but the training time of SVM increased with optimal level decomposition and two new features.
References
-
Tran V. T., Yang B. S. An intelligent condition-based maintenance platform for rotating machinery. Expert Systems with Applications, Vol. 39, 2012, p. 2977-2988.
-
Melter G., Dien N. P. Fault diagnosis in gears operating under non-stationary rotational speed using polar wavelet amplitude. Mechanical Systems and Signal Processing, Vol. 18, Issue 5, 2004, p. 985-992.
-
McFadden P. D. A revised model for the extraction of periodic waveforms by time domain averaging. Mechanical Systems and Signal Processing, Vol. 7, 1993, p. 193-203.
-
Combet F., Gelman L. An automated methodology for performing time synchronous averaging of a gearbox signal without speed sensor. Mechanical Systems and Signal Processing, Vol. 21, 2007, p. 2590-2606.
-
Minamihara H., Nishimura M., Takakuwa Y., Ohta M. A method of detection of the correlation function and frequency power spectrum for random noise or vibration with amplitude limitation. Journal of Sound and Vibration, Vol. 141, Issue 3, 1990, p. 425-434.
-
Wang W. J., McFadden P. D. Early detection of gear failure by vibration analysis I. Calculation of the time-frequency distribution. Mechanical Systems and Signal Processing, Vol. 3, Issue 7, 1993, p. 193-203.
-
Staszewski W. J., Tomlinson G. R. Application of the wavelet transform to fault detection in a spur gear. Mechanical System and Signal Processing, Vol. 8, 1994, p. 289-307.
-
Paya B. A., Esat I. I. Artificial neural network based fault diagnostics of rotating machinery using wavelet transforms as a preprocessor. Mechanical Systems and Signal Processing, Vol. 11, Issue 5, 1997, p. 751-765.
-
Tse P. W., Yang W. X., Tam H. Y. Machine fault diagnosis through an effective exact wavelet analysis. Journal of Sound and Vibration, Vol. 277, 2004, p. 1005-1024.
-
Wu J. D., Liu C. H. An expert system for fault diagnosis in internal combustion engines using wavelet packet transform and neural network. Expert Systems with Applications, Vol. 36, Issue 3, 2009, p. 4278-4286.
-
Cheng J., Yang Y., Yang Y. A rotating machinery fault diagnosis method based on local mean decomposition. Digital Signal Processing, Vol. 22, 2012, p. 356-366.
-
Vapnik V. The Nature of Statistical Learning Theory. Springer-Verlag, New York, 1995.
-
Cortes C., Vapnik V. Support vector networks. Machine Learning, Vol. 20, 1995, p. 273-297.
-
Bicego M., Figueiredo M. A. T. Soft clustering using weighted one-class support vector machines. Pattern Recognition, Vol. 42, Issue 1, 2009, p. 27-32.
-
Cao X. B., Xu Y. W., Chen D., Qiao H. Associated evolution of a support vector machine-based classifier for pedestrian detection. Information Sciences, Vol. 179, Issue 8, 2009, p. 1070-1077.
-
Lingras P., Butz C. Rough set based 1-v-1 and 1-v-r approaches to support vector machine multi-classification. Information Sciences, Vol. 177, Issue 18, 2007, p. 3782-3798.
-
Zhou S. M., Gan J. Q., Sepulved F. Classifying mental tasks based on features of higher-order statistics from EEG signals in brain-computer interface. Information Sciences, Vol. 178, Issue 6, 2008, p. 1629-1640.
-
Zhou S. M., John R. I., Wang X. Y., Garibaldi J. M. Compact fuzzy rules induction and feature extraction using SVM with particle swarms for breast cancer treatments. Proceedings of 2008 IEEE Congress on Evolutionary Computation (CEC), 2008, p. 1469-1475.
-
Bloch G., Lauer F., Colin G., Chamaillard Y. Support vector regression from simulation data and few experimental samples. Information Sciences, Vol. 178, Issue 20, 2008, p. 3813-3827.
-
Chuang C. C. Extended support vector interval regression networks for interval input-output data. Information Sciences, Vol. 178, Issue 3, 2008, p. 871-891.
-
Jayadeva, Khemchandani R., Chandra S. Regularized least squares support vector regression for the simultaneous learning of a function and its derivatives. Information Sciences, Vol. 178, Issue 17, 2008, p. 3402-3414.
-
Wong W. T., Shih F. Y., Liu J. Shape-based image retrieval using support vector machines, Fourier descriptors and self-organizing maps. Information Sciences, Vol. 177, Issue 8, 2007, p. 1878-1891.
-
Yuan S. F., Chu F. L. Fault diagnostics based on particle swarm optimization and support vector machines. Mechanical Systems and Signal Processing, Vol. 21, Issue 4, 2007, p. 1787-1798.
-
Zhang J., Wang Y. A rough margin based support vector machine. Information Sciences, Vol. 178, Issue 9, 2008, p. 2204-2214.
-
Saravanan N., Kumar Siddabattuni V. N. S., Ramachandran K. I. A comparative study on classification of features by SVM and PSVM extracted using Morlet wavelet for fault diagnosis. Expert Systems with Applications, Vol. 35, 2008, p. 1351-1366.
-
Qu J., Zuo M. J. Support vector machine based data processing algorithm for wear degree classification of slurry pump systems. Measurement, Vol. 43, 2010, p. 781-791.
-
Sun C., Zhang Z. S., He Z. J. Research on bearing life prediction based on support vector machine and its application. Journal of Physics: Conference Series, Vol. 305, 2011, p. 012028.
-
Hou S., Li Y. Short-term fault prediction based on support vector machines with parameter optimization by evolution strategy. Expert Systems with Applications, Vol. 36, 2009, p. 12383-12391.
-
Shen Z., Chen X., Zhang X., He Z. A novel intelligent gear fault diagnosis model based on EMD and multi-class TSVM. Measurement, Vol. 45, 2012, p. 30-40.
-
Xian G. M., Zeng B. Q. An intelligent fault diagnosis method based on wavelet packer analysis and hybrid support vector machines. Expert Systems with Applications, Vol. 36, 2009, p. 12131-12136.
-
Zamanian A. H., Ohadi A. Gear fault diagnosis based on Gaussian correlation of vibrations signals and wavelet coefficients. Applied Soft Computing, Vol. 11, 2011, p. 4807-4819.
-
Rosso O. A., Figliola A. Order/disorder in brain electrical activity. Revista Mexicana De Fisica, Vol. 50, 2004, p. 149-155.
-
Rosso O. A., Blanco S., Yordanova J., Kolev V., Figliola A., Schurmann M., Basar E. Wavelet entropy: a new tool for analysis of short duration brain electrical signals. Journal of Neuroscience Methods, Vol. 105, 2001, p. 65-75.
-
Yan R. Base Wavelet Selection Criteria for Non-Stationary Vibration Analysis in Bearing Health Diagnosis. Electronic Doctoral Dissertations for UMass Amherst, Paper AAI3275786, http://scholarworks.umass.edu/dissertations/AAI3275786, 2007.
-
Widodo A., Yang B. S. Support vector machine in machine condition monitoring and fault diagnosis. Mechanical Systems and Signal Processing, Vol. 21, 2007, p. 2560-2574.
-
Suykens J. A. K., Vandewalle J. Multiclass least squares support vector machines. Proceedings of the International Joint Conference on Neural Networks (IJCNN99), Washington, DC, 2002, p. 900-903.
-
Zhao S. L., Zhang Y. C. SVM classifier based fault diagnosis of the satellite attitude control system. International Conference on Intelligent Computation Technology and Automation, 2008, p. 907-911.
-
Long B., Xian W., Li M., Wang H. Improved diagnostics for the incipient faults in analog circuits using LSSVM based on PSO algorithm with Mahalanobis distance. Neurocomputing, Vol. 133, 2014, p. 237-248.
-
Liu Z., Cao H., Chen X., He Z., Shen Z. Multi-fault classification based on wavelet SVM with PSO algorithm to analyze vibration signals from rolling element bearings. Neurocomputing, Vol. 99, 2013, p. 399-410.
-
Data Analysis Competition 2009. Prognostics and Health Management Society, http://www.phmsociety.org/competition/PHM/09/apparatus, 2012.
Cited by
About this article
The authors are grateful to the Shahrekord University of Iran for supporting the experimental tests of this research.

