Abstract
Classical cubic spline interpolation is prone to overshoot and undershoot when used to interpolate the envelopes during Empirical Mode Decomposition (EMD). A new method is proposed to envelope the signal and to get the potential Intrinsic Mode Function (IMF) components, which is called Extremum Center Interpolation (ECI). In ECI, all the extrema will be connected with segments to form the envelope area and the centers of it called extremum centers will be obtained. The potential IMF component will be gotten by interpolating the extremum centers with cubic spline interpolation. When used to decompose signals whose extrema are unevenly distributed, whether it is simulation signal or real hydraulic shock signal, the newly proposed EMD will have a significant advantage over the original EMD. To evaluate the overshoot degree of the envelopes and to decide whether to use the newly proposed EMD or the original one to decompose the goal signal, an index called overshoot index is proposed and its threshold is obtained by numerical experiments.
1. Introduction
Empirical Mode Decomposition (EMD) is the core of Hilbert-Huang transformation (HHT), which is a kind of self-adaptive signal-processing method firstly proposed by Huang [1, 2] based on finite sifting process. In EMD, based on the direct extraction of the energy associated with various intrinsic time scales, the original signal will be decomposed to a number of Intrinsic Mode Function (IMF) components, and each IMF component could reflect the inherent fluctuation and represent real physical information of the signal. Because of its powerful ability to analyze the non-stationary and nonlinear signal, it has drawn great attention in the signal processing area and has had a great application in various engineering areas [3].
But there is an unavoidable deficiency of EMD, which is that it was summarized from experiments rather than based on theoretical derivation. The lack of rigorous mathematical foundation results in that most of the researches about EMD are based on numerical experiments. There are still a lot of issues worthy of further research, such as mode aliasing [4], stopping criterion [5, 6], end effect [7], and the overshoot and undershoot phenomenon [8].
In EMD, signal envelope and curve fitting are two key steps during the decomposition, and they will have great influence on the quality of the decomposition results. Due to its advantages of convergence, stability and second-order smooth character, Cubic Spline Interpolation is the most used method to fit the signal’s envelopes. However, the envelope obtained by Cubic Spline Interpolation is prone to overshoot and undershoot, which is the main reason to cause mode aliasing in EMD. In order to have a better envelope and to improve the quality of EMD, some researchers have been trying to find a better way to alleviate overshoot and undershoot. Their works mainly focused on the interpolation of the upper and lower envelopes, including the using of different interpolation method, the improvement of the existing interpolation method and the selection of the interpolation points. For example, Chen et al. [9] used B-spline interpolation algorithm to analyze EMD, but it was put forward mainly for theoretical analysis, and did not improve EMD. Xu [10] proposed Piecewise Parabola Interpolation (PPI) and Fan et al. [11] proposed Piecewise Linear Fractal Interpolation to envelope the signal. Although these methods could alleviate the overshoot and undershoot to a great extent, but the average curve of the envelopes is not smooth because the upper and lower envelopes are unsmooth. In addition, Kokes J. [12] applied constrained Cubic Spline Interpolation instead of natural Cubic Spline Interpolation to alleviate overshoot and undershoot, Qin et al. [13] proposed Piecewise Power Function interpolation method, Zhu [14] put forward a least-length constrained envelope method, Zhang [15] used Cubic Hermite Interpolation instead of Cubic Spline Interpolation for envelopes fitting, and doubly-iterative sifting method instead of local extrema for interpolation points selection, Liu et al. [16] used Piecewise Cubic Hermite Interpolating Polynomial (PCHIP), and Kopsinis Y. [17] tried doubly-iterative sifting schemes, instead of extrema to get the envelopes. Almost all of the above methods have two significant defects. The first is that these methods have a larger computational complexity than the original method, because when getting the potential IMF components, they will use some kind of interpolation method two times to get the upper and lower envelopes, which will lead to more computational time. The second is that they could not always get a satisfactory decomposition result when applied to signals with various characteristics.
This paper proposes a new method to get potential IMF components. Its main work includes:
1) In Section 2, it proposed a new method called Extremum Center Interpolation (ECI) to get the potential Intrinsic Mode Function (IMF) components.
2) In Section 3, through experimental comparison, it analyzed the advantage of the newly proposed ECI method, and it could have a better performance than the commonly used Cubic Spline Interpolation (CSI), especially when used to decompose signals whose extrema are unevenly distributed.
3) In Section 4, it proposed a new index called Overshoot Index to evaluate the overshoot degree of the envelopes get by Cubic Spline Interpolation of extrema, and determined its threshold by numerical experiments. They could help us to decide which method, the newly proposed one or the original one, should be used to decompose the goal signal.
Because of its lack of theoretical basis, the understanding of EMD came mainly from experience and experiments [17]. So in this paper, the study and the evaluation of the performance are mainly based on the experiments on typical simulation and real signals.
2. Extremum center interpolation EMD
2.1. The problem of overshoot and undershoot
The distribution of the extrema could reflect not only its shape, but also its frequency components, so when a signal is to be decomposed by EMD, all the extrema will be found out firstly. Then the upper and lower envelopes will be obtained by some method. A large amount of researches show that Cubic Spline Interpolation has a synthetically perfect performance when used to fit the extrema because of its high fitting precision and good smoothness, therefore it is widely used in EMD. But there are still two unavoidable defects of Cubic Spline Interpolation. Firstly, its property of keeping smooth will lead to distinct overshoot and undershoot when the extrema distribute unevenly. Secondly, because Cubic Spline Interpolation is a kind of globally controlled interpolation curve, so when there is an outlier among the extrema, the shape of the envelope will change totally and obviously.
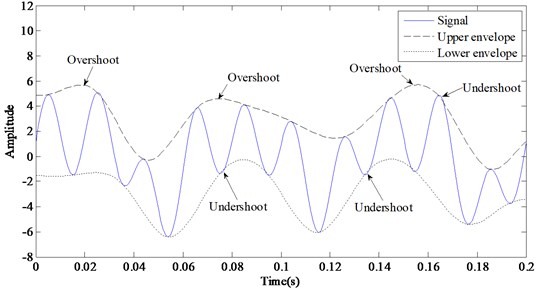
Take the signal in Fig. 1 as an example, due to the uneven distribution of the extrema, there are so many overshoots and undershoots on the upper and lower envelopes. When there is an overshoot, the envelope area will exceed the extremum and enclose more area than the signal really does. When there is an undershoot, a little part of signal will not be enclosed in the envelope area. Obviously, overshoot and undershoot, especially the former, will cause the envelope area could not rightly represent the shape of the signal, and thus results in an inaccurate decomposition of EMD.
Fig. 1Overshoot and undershoot of the envelopes got by cubic spline interpolation
2.2. Improve EMD by extremum center interpolation
To alleviate overshoot and undershoot of envelopes, this paper will propose a new interpolation method. Its core idea is to get the envelopes by connecting the extrema with segments, to find out the centers of the envelope area, and then to fit the centers by Cubic Spline Interpolation.
The processes of the new envelope method are described as following:
(1) Find out all the extrema, including maxima and minima, of signal x(t), whose horizontal coordinates are x1, x2,…, xm.
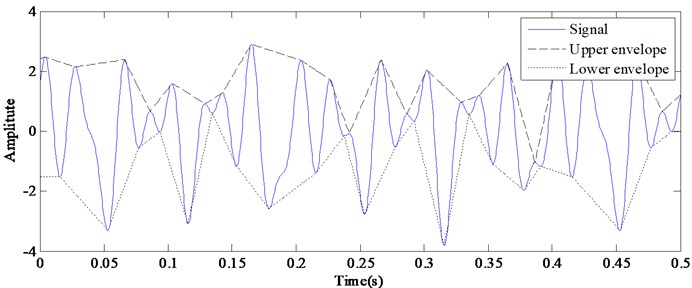
(2) Connect all the maxima with segments to form the upper envelope, and all the minima to form the lower envelope as shown in Fig. 2. The upper and lower envelopes will enclose an envelope area.
Fig. 2Connect the extrema with segments to form upper and lower envelopes
(3) Corresponding to the horizontal coordinate of each extremum xi, there is a point located on the upper envelope, whose vertical coordinate is yupi, and a point located on the lower envelope, whose vertical coordinate is ylowi. Then find out all the middle points (xi,ymi) of the envelope area by Eq. (1):
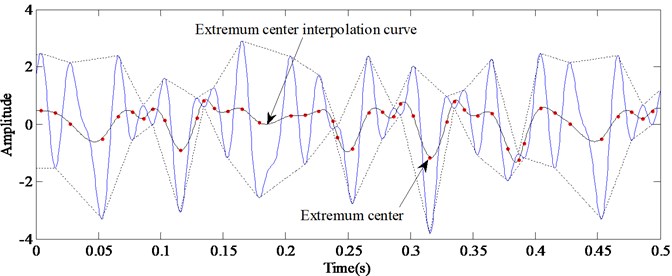
The middle points are marked as “•” in Fig. 3, and are named as Extremum Centers.
(4) Fit all the Extremum Centers with Cubic Spline Interpolation, and the Extremum Center Interpolation curve, m1(t), could be obtained as shown in Fig. 3.
(5) Get the first IMF component.
Calculate h1(t) by Eq. (2), in which, x(t) is the original signal, m1(t) is the Extremum Center Interpolation curve obtained by step (4):
If h1(t) satisfies the IMF criterion [5], let it to be the first IMF component of signal x(t), and name it as c1(x). If h1(t) does not satisfy the IMF criterion, regard h1 as a signal, and keep on process it by Eq. (3) until it satisfies the IMF criterion:
In Eq. (3), m1k(t) is the extremum center interpolation curve of h1(k-1)(t).
Fig. 3Extremum center interpolation curve obtained by cubic spline interpolation
(6) Let c1(t)=h1k(t) and calculate the residual r1(t) by Eq. (4):
Then c1(t) is the first IMF component of signal x(t), which represents the first frequency component.
(7) Repeat step (2)-(6) to get the 1st, 2nd,…, nth IMF components until rn(t) is a monotonic curve and no more IMF component could be extracted from it. The 1st, 2nd,…, nth IMF components are respectively named as c1(t), c2(t),…, cn(t).
Eq. (5) describes the relationship between the IMF and residual components of each stage. If all the IMF components and the nth residual component are reconstructed by Eq. (6), the original signal x(t) could be regained:
The newly proposed method to get mi is mainly based on the Cubic Spline Interpolation of Extremum Centers, so it is named as Extremum Center Interpolation method, and also named as ECI for short in this paper, and the new EMD based on ECI is called ECI EMD.
3. Performance of ECI EMD
Two typical simulation signals and one real hydraulic shock signal will be used to test whether ECI could effectively suppress overshoot and undershoot, and whether the decomposition ability of ECI EMD could be better than the original EMD.
3.1. Example 1 – a simulation signal prone to overshoot and undershoot
3.1.1. Signal-I
Signal-I it is an amplitude modulated signal constructed by Eq. (7), which includes 50 Hz and 15 Hz sine components and 30 Hz cosine component [18]:
0≤t≤0.5.
Fig. 4The envelopes obtained by Cubic Spline Interpolation (Signal-I)
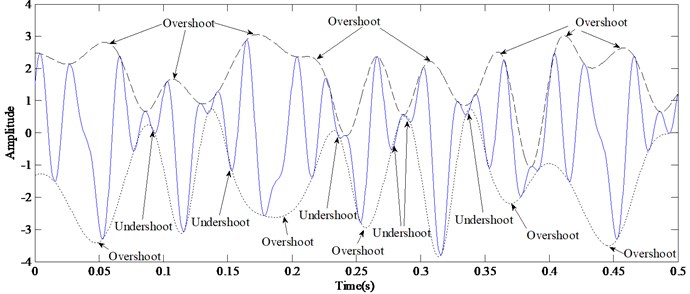
The envelops of Signal-I obtained by Cubic Spline Interpolation is shown in Fig. 4. Due to the uneven distribution of the extrema, there are so many overshoots and undershoots on the upper and lower envelopes. Obviously, overshoot is much more serious than undershoot both in degree and in number. As for overshoot, the envelope is always not monotonous between two maxima (minima), and there is inevitable to be a point whose slope is 0, which will bring additional frequency into the signal and result in frequency aliasing.
3.1.2. Analysis on the decomposition results
Fig. 5 shows the segmental envelopes of Signal-I. Compared with the Cubic Spline Interpolation envelopes, the problem of overshoot and undershoot is mitigated to a great extent, and the envelope area is more in line with the real shape of the signal.
Fig. 5The envelopes obtained by Cubic Spline Interpolation and extremum segments
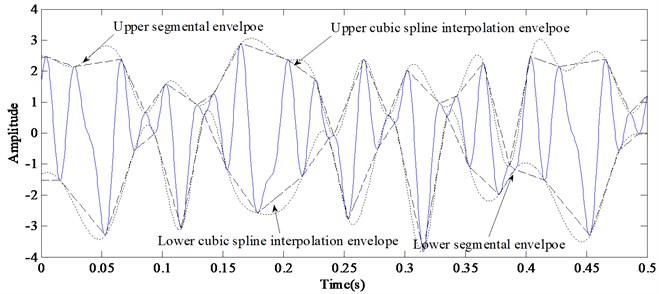
Fig. 6 shows the decomposition results obtained by the original EMD (in Fig. 6(a)) and ECI EMD (in Fig. 6(b)). There is obvious frequency aliasing in Fig. 6(a), and the components of 50 Hz, 30 Hz and 15 Hz are not effectively separated from each other. Comparatively, the frequency aliasing is mitigated greatly by ECI EMD.
Fig. 6Decomposition results of Signal-Ⅰ by EMD and ECI EMD
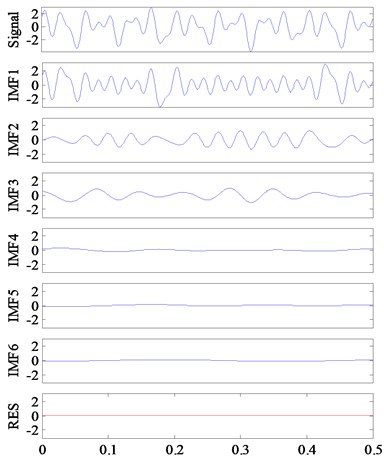
a) EMD
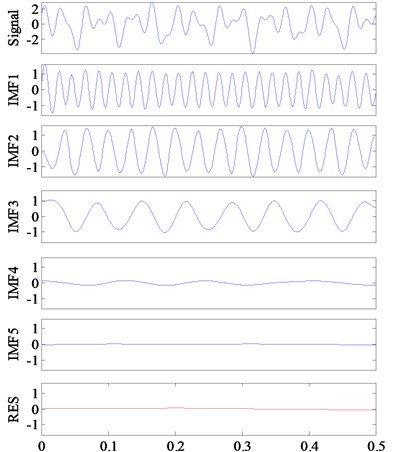
b) ECI EMD
Fig. 7 shows the energy spectrum of Signal-I’s IMF1 obtained respectively by EMD and ECI EMD. To analyze the decomposing ability of the two methods, the energy spectrum of Signal-I is also shown in Fig. 7(a).
Fig. 7Energy spectrum of IMF1 obtained by EMD and ECI EMD
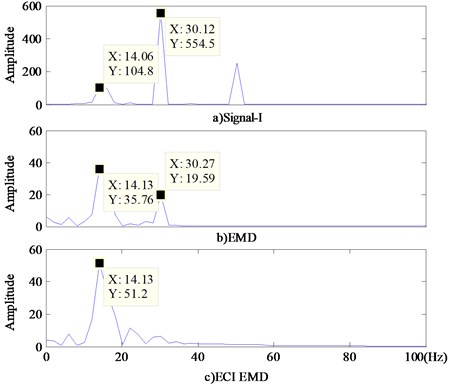
In the energy spectrum of IMF1 separated by EMD (Fig. 7(b)), there are energy of 15 Hz and a small amount of 30 Hz. At the same time, the energy of 30 Hz is weakened to a large extent. But as for the IMF1 got by ECI EMD (Fig. 7(c)), except for 15 Hz, there isn’t other obvious frequency component. The higher frequency in IMF1 means that the envelopes got by Cubic Spline Interpolation bring unnecessary frequency into the envelope area.
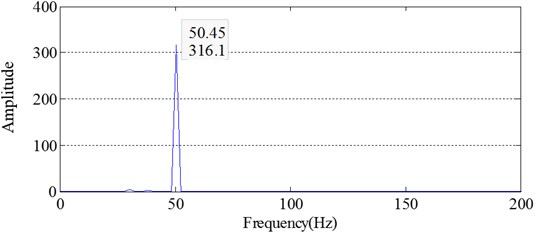
Fig. 8 and Fig. 9 are respectively the energy spectrums of IMF2 obtained by EMD and ECI EMD. IMF2 obtained by EMD still contains the components of 50 Hz and 30 Hz, frequency aliasing is obvious. Comparatively, IMF2 obtained by ECI EMD contains only the frequency of 50 Hz, and the frequency aliasing is alleviated effectively.
Fig. 8Energy spectrum of IMF2 obtained by EMD
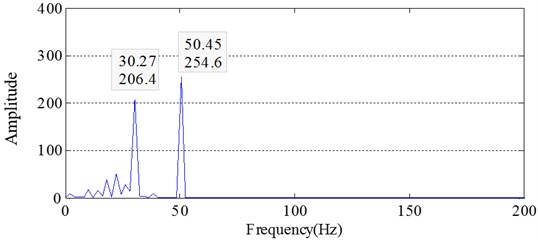
Fig. 9Energy spectrum of IMF2 obtained by ECI EMD
3.2. Example 2 – a simulation signal not prone to overshoot and undershoot
3.2.1. Signal-II
Signal-II (Eq. (8)) is a common used simulation signal [19], which contains frequency of 1/25 Hz, 1/50 Hz and 1/200 Hz:
The Cubic Spline Interpolation envelopes and the extremum segmental envelopes of Signal-II are shown in Fig. 10. The overshoot and undershoot phenomenon is not as obvious as Signal-I.
3.2.2. Analysis on the decomposition results
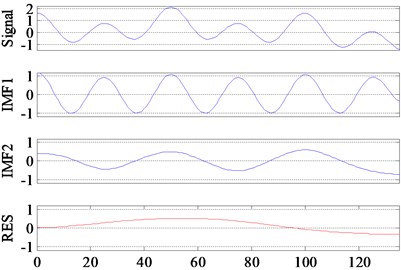
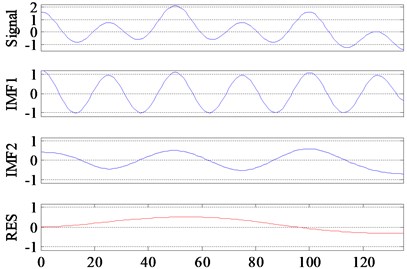
The decomposition results of Signal-II by EMD and ECI EMD are respectively shown in Fig. 11(a) and (b). Because only 135 points are intercepted from the Signal-II, which is shorter than the cycle of 1/200 Hz, so all the two methods failed to separate 1/200 Hz from the original signal.
Fig. 10Cubic spline interpolation envelopes and extremum segmental envelopes of Signal-II
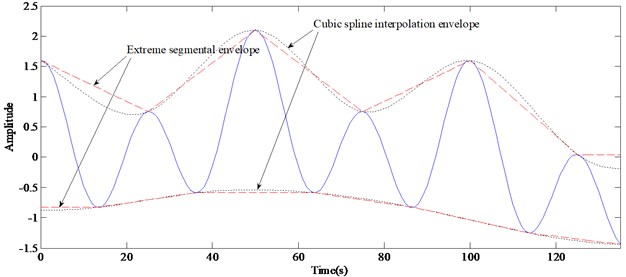
Fig. 11Decomposition results of EMD and ECI EMD
a) EMD
b) ECI EMD
Fig. 12Comparison between IMFs obtained by EMD and the corresponding components of Signal-II

a)

b)
Fig. 13Comparison between IMFs obtained by ECI EMD and the corresponding components of Signal-II

a)

b)
Regardless of the end effect, all the IMFs, no matter obtained by EMD (shown in Fig. 12) or by ECI EMD (shown in Fig. 13), could well coincide with its corresponding components, x1 and x2. So as for Signal-II, the improvement of the ECI method is not distinct.
3.3. Example 3 – a real hydraulic shock signal
3.3.1. Signal-III
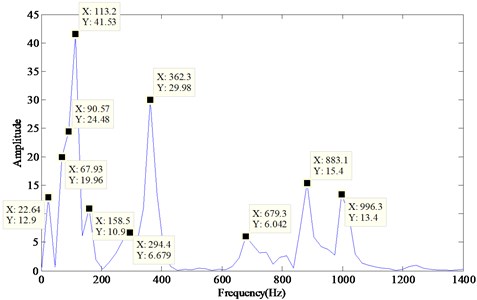
Signal-III (shown in Fig. 14(a)) is a shock signal measured from hydraulic system. It was caused by a sudden rise of hydraulic pressure. Its sampling frequency is 5000 Hz and its length is 2048. Fig. 14(b) shows the point of 780-1000 intercepted from Signal-III.
Fig. 14Hydraulic shock signal

a)

b)
Fig. 15 is the energy spectrum of Signal-III. It contains complex frequency components including obvious ones, such as 996.3 Hz, 883.1 Hz, 679.3 Hz, 362.3 Hz, 113.2 Hz, and other inconspicuous ones, such as 158.5 Hz and 22.64 Hz.
Fig. 15Energy spectrum of the hydraulic shock signal
3.3.2. Analysis on the decomposition results
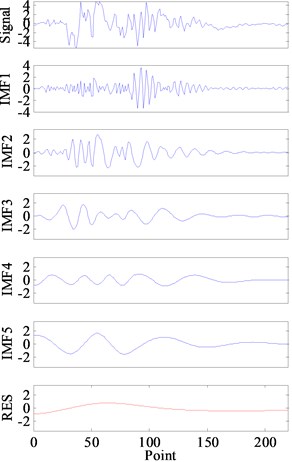
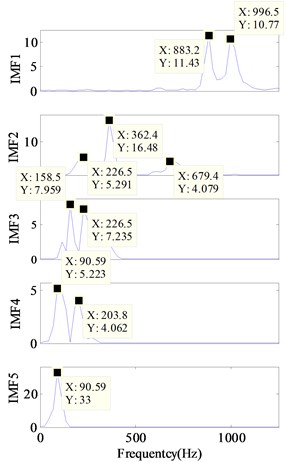
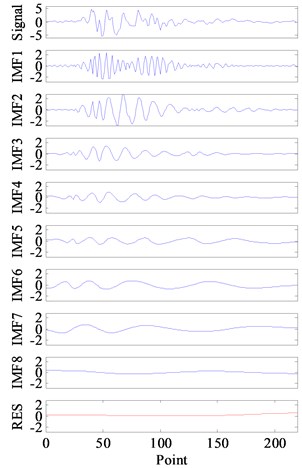
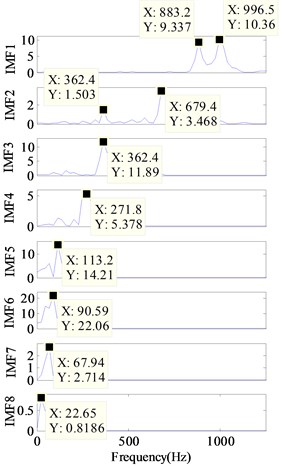
Fig. 16 and Fig. 17 show the decomposition results obtained respectively by EMD and ECI EMD. Five IMFs were obtained by EMD as shown in Fig. 16(a) and 8 IMFs were obtained by ECI EMD as shown in Fig. 17(a).The energy spectrums of all the IMFs are also shown in Fig. 16(b) and Fig. 17(b). In order to make the comparative analysis more easy, the frequency components obtained by EMD and ECI EMD are listed in Table 1. The frequency components of the real signal are sorted according to their amplitude in the first column of Table 1.
Fig. 16Hydraulic shock signal’s decomposition results by EMD
a) IMFs and RES
b) Energy spectrum
Fig. 17Hydraulic shock signal’s decomposition results by ECI EMD
a) IMFs and RES
b) Energy spectrum
Obviously, frequency aliasing of EMD is much serious than ECI EMD. As for EMD, It could be seen from Fig. 16(b) and Table 1 that: 1) there are 3 IMFs, i.e.,IMF1, IMF2 and IMF4, containing more than two frequency components, and IMF2 even contains three frequency components; 2) the most important component, 113.2 Hz, is lost by EMD, and two low frequencies, 67.93 Hz and 22.64 Hz, are lost too; 3) 294.4 Hz is replaced by two frequencies, 226.5 Hz and 203.8 Hz (which are in bold); 4) IMF4 and IMF5 contain the same frequency component, i.e., 90.59 Hz.
Comparatively, in Fig. 17(b) and Table 1, it could be seen that: 1) except for the first two IMFs, the rest IMFs contains only the one frequency component which means that the original signal is well decomposed; 2) although 294.4 Hz is also replaced by frequency, 271.8 Hz, but it is closer than 226.5 Hz and 203.8 Hz obtained by EMD; 3) only one frequency component, 158.5, are lost by ECI EMD.
Table 1Frequency components in each IMF
Importance sorting | Frequency components in Signal-III | Frequency components in each IMF | ||||||||||||
EMD | ECI EMD | |||||||||||||
IMF1 | IMF2 | IMF3 | IMF4 | IMF5 | IMF1 | IMF2 | IMF3 | IMF4 | IMF5 | IMF6 | IMF7 | IMF8 | ||
6 | 996.3 | 996.5 | 996.5 | |||||||||||
5 | 883.1 | 883.2 | 883.2 | |||||||||||
10 | 679.3 | 679.4 | 679.4 | |||||||||||
2 | 362.3 | 362.4 | 362.4 | 362.4 | ||||||||||
9 | 294.4 | 226.5 | 271.8 | |||||||||||
203.8 | ||||||||||||||
8 | 158.5 | 158.5 | lost | |||||||||||
1 | 113.2 | lost | 113.2 | |||||||||||
3 | 90.57 | 90.59 | 90.59 | 90.59 | ||||||||||
4 | 67.93 | lost | 67.94 | |||||||||||
7 | 22.64 | lost | 22.65 | |||||||||||
4. Evaluation of the overshoot degree and the selection of decomposition method
Based on the analysis in Section 3, it could be known that, as for the signals whose extrema are evenly distributed, the ECI method could not improve the decomposition significantly. It will show great advantage only when the signal’s extrema have an uneven distribution. So before we decide to select which method to decompose the goal signal, we’d better evaluate its overshoot degree firstly. Although human judgment is an alternative approach, but to a large extent, it depends on the human’s subjective judgment and experience accumulation, so we will propose an index called Overshoot Index to qualify the overshoot degree and to make the evaluation easier to be realized by computer program.
4.1. Overshoot index
Overshoot Index proposed by this paper is calculated as following:
(1) Find out all the extrema of the signal, and obtain the envelopes by Cubic Spline Interpolation. The upper and lower envelope are respectively named as yup and ylow. Then calculate the energy of the area enveloped by yup and ylow according to Eq. (11):
(2) Obtain the envelopes by connecting the extrema with segments, the upper and lower segmental envelope are respectively named as zup and zlow. Then calculate the energy of the area enveloped by zup and zlow according to Eq. (12):
(3) Overshoot Index, denoted as e, will be calculated by Eq. (13):
Now, e is a quantification of the envelope’s overshoot degree. A threshold of e could be set and to be used to judge whether the original EMD or ECI EMD should be used to decompose the goal signal. The threshold will be obtained by data experiments as described in Section 4.2.
4.2. Threshold of overshoot degree
4.2.1. Orthogonality Index
Frequency aliasing is the main reason to lead to the poor decomposition, and overshoot is the main reason to lead to frequency aliasing [20]. Theoretically, an excellent decomposition algorithm should make all of the IMF components to be orthogonal with each other [21]. And numerous studies also show that all the IMF components are locally orthogonal. Therefore, orthogonal parameters are widely used to measure the quality of EMD decomposition.
In literature [1], Huang et al. used Orthogonality Index IO (shown Eq. (14)) to evaluate the quality of decomposition:
in which, ci(t) is the ith IMF component.
They thought that the smaller IO is, the higher the orthogonality degree of the IMF components are, and the higher the quality of the decomposition is. In fact, IO could not fully reflect the quality of the decomposition, because there are two situations which will lead to frequency aliasing: 1) different IMFs may contain the same frequency component; 2) one IMF may contain different frequency components.
Fig. 18The decomposition result of the same example signal by EMD and ECI EMD
a) EMD
b) ECI EMD
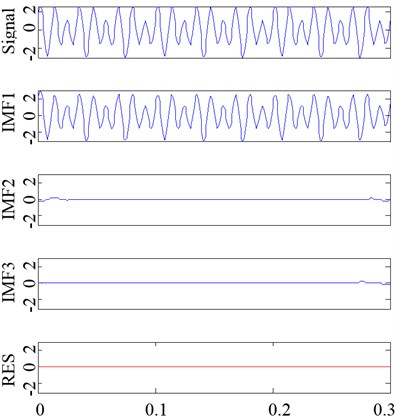
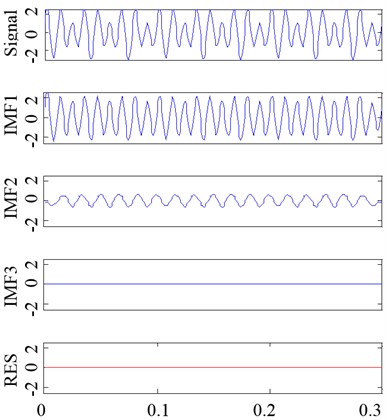
Take the signal in Fig. 18 as an example, the decomposition results obtained by the original EMD and ECI EMD are respectively shown in Fig. 18(a) and (b). If evaluated by IO, the performance of EMD is better than ECI EMD, because the IO of the former is 0.011 and the IO of the later is 0.035. But the conclusion is not consistent with the facts, and the performance of the later is obviously better than the former. EMD did not do a good decomposition because IMF1 is almost the same with the original signal and the other IMFs are almost 0. The reason cause IO to be small is that ci(t)cj(t) is almost 0 when i≠1 or j≠1. So only IO could not take a comprehensively evaluation to the degree of frequency aliasing.
4.2.2. New indexes designed to evaluate the degree of frequency aliasing
A new method to evaluate the degree of frequency aliasing will be proposed.
σ (Eq. (15) is designed to evaluate the degree of the first kind of frequency aliasing. The smaller σ is, the less the same frequency components ci(t) and ri(t) contain, and the higher the decomposition quality is:
In Eq. (15), ri(t)=x(t)-ci(t), is the ith residual.
ξi (Eq. (16) is designed to evaluate the degree of the second frequency aliasing. It could measure the correlation between ci(t) and x(t). The worse the signal is decomposed, the more the same frequency components ci(t) and x(t) contain, and the bigger ξi will be:
4.2.3. Threshold of overshoot index
Now, we will get the threshold of Overshoot Index by experiments. To simplify the analysis, a signal group is designed by Eq. (17), which contains two sine components whose frequency are f1 and f2. The shape of the signals' envelopes will change with f1, f2 and k. Here, k is the amplitude of the second sine component. Because the amplitude of the first sine component is 1, so k is also the ratio of the amplitudes of the two sine components:
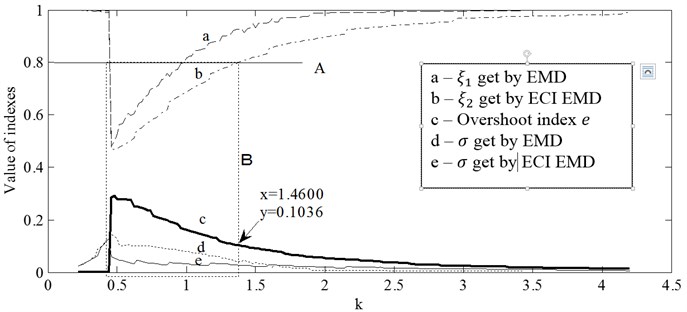
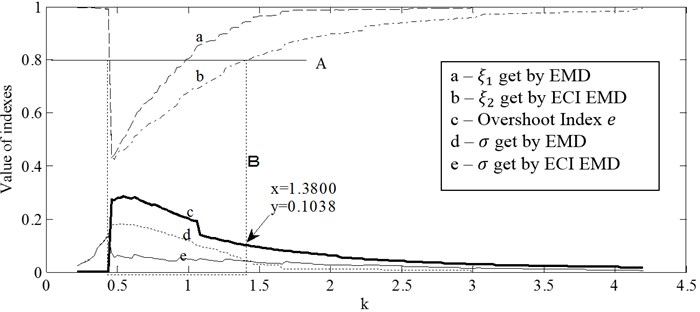
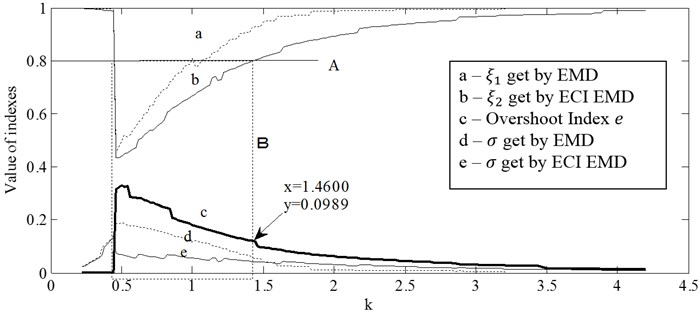
If f1 and f2 are set, the aforementioned indexes, ξ1, σ and e, will change with k. Fig. 19 shows the changing of these indexes when the signal is decomposed respectively by EMD and ECI EMD. In Fig. 19(a), (b) and (c), f1 and f2 are correspondingly (30 Hz, 45 Hz), (40 Hz, 60 Hz) and (60 Hz, 90 Hz).
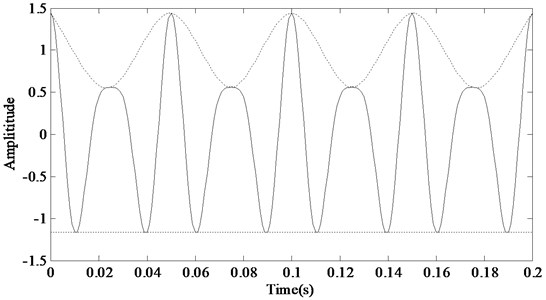
In each figure of Fig. 19, almost all indexes have a sudden change at k=0.44. It is because that the lower envelope of the signal will become a straight line when k=0.44 (as shown in Fig. 20). The place of the sudden change and the corresponding value of k is decided by the ratio between f1 and f2.
As aforementioned, ξ1 could be used to measure the similarity between c1(t) and x(t). Large amount of experiments indicated that if ξ1 is bigger than 0.8 (marked by solid line, A), it could be thought that c1(t) and x(t) are almost the same, and the original signal is almost not decomposed.
As shown in all figures of Fig. 19, in the area enclosed by dotted frame B, line b is under line a, and line e is under line d, which means the decomposition of ECI EMD is better than EMD. In figure (a), (b) and (c), there is an intersection between frame B and line c, and the horizontal coordinate of this intersection is about 0.1, so the threshold of e, named as e*, is about 0.1.
Fig. 19Indexes used to evaluate the decomposition quality and the decision of threshold e*
a)f1=30, f2=45
b)f1=40, f2=60
c)f1=60, f2=90
4.2.4. Application of overshoot index
The Es, Ez and e of Signal-I, Signal-II and Signal-III are listed out in Table 2. The Overshoot Index of Signal-I is 0.1829 and Signal-III is 0.13, which are all bigger than e*, so it could be judged that the overshoot degree of the envelopes got by Cubic Spline Interpolation is serious and ECI EMD is suggested to be used to decompose Signal-I and Signal-III. As for Signal-II, e is 0.0009, which is much smaller than e*, so the original EMD could make a satisfactory decomposition. The evaluation got by Overshoot Index is consistent with the results of the experiments described in Section 3.
Table 2Overshoot index of Signal-I, Signal-II and Signal-III
Signal | Es | Ez | e |
Signal-I | 1.429×10⁴ | 1.208×10⁴ | 0.1829 |
Signal-II | 553.07 | 552.57 | 0.0009 |
Signal-III | 137.65 | 121.81 | 0.13 |
Fig. 20Straight under envelope when k= 0.44
5. Conclusions
Overshoot is the main reason to lead to frequency aliasing when Cubic Spline Interpolation is used to interpolate the envelopes during original EMD, especially when it is used to decompose the signals whose extrema are distributed unevenly. This paper proposed a new interpolation method called Extremum Center Interpolation to alleviate the overshoot problem, and its main innovations are reflected as following:
1) It proposed a new interpolation method to get the possible IMF components. Firstly, the new method will get the upper and lower envelopes by connecting the extrema with segments rather than Cubic Spline Interpolation. Secondly, it will find the centers of the area enclosed by the segmental envelopes. Thirdly, it will get the possible IMF component by interpolating the centers with Cubic Spline Interpolation.
2) As for the signals whose extrema are distributed unevenly, this new method could display better decomposition ability than the original EMD. Its advantage mainly lies that it effectively alleviates the overshoot and undershoot phenomenon which are prone to happening when the envelopes are obtained by Cubic Spline Interpolation. At the same time, the computational complexity of the new method is lower than the original one, because the original one requires two times of Cubic Spline Interpolation, but the new method requires only one time. In fact, during the EMD, Cubic Spline Interpolation will consume a large amount of computation resources and time.
3) It proposed a new index e, called Overshoot Index, as a quantitative indicator to evaluate the degree of overshoot. To decide the threshold of the Overshoot Degree, it firstly proposed two more scientific indexes, σ and ξi, to evaluate the orthogonality between the IMF and residual components. And then, through numerical experiments, the threshold of the Overshoot Degree, e*, is determined to be about 0.1. Based on the threshold, we could easily decide to use which method, the original EMD or the newly proposed ECI EMD to decompose the goal signal.
References
-
Huang N. E., Shen Z., Long S. R., et al. The empirical mode decomposition and the hilbert spectrum for nonlinear and non-stationary time series analysis. Proceedings of the Royal Society of London. Series A: Mathematical, Physical and Engineering Sciences, 1998.
-
Huang N. E., Shen Z., Long S. R. A new view of nonlinear water waves: the Hilbert spectrum 1. Annual Review of Fluid Mechanics, Vol. 31, Issue 1, 1999, p. 417-457.
-
Xu Y., Liu B., Liu J., et al. Two-dimensional empirical mode decomposition by finite elements. Proceedings of the Royal Society A: Mathematical, Physical and Engineering Science. 2006.
-
Gao Y. C., Ge G. T., Sheng Z. Y., et al. Analysis and solution to the mode mixing phenomenon in EMD. CISP’08 Congress on Image and Signal Processing, 2008.
-
Cheng J. S., Yu D. J., Yang Y. Research on the intrinsic mode function (IMF) criterion in EMD method. Mechanical Systems and Signal Processing, Vol. 20, Issue 4, 2006, p. 817-824.
-
Boudraa A. O., Cexus J. C. EMD-based signal filtering. IEEE Transactions on Instrumentation and Measurement, Vol. 56, Issue 6, 2007, p. 2196-2202.
-
Wu F. J., Qu L. S. An improved method for restraining the end effect in empirical mode decomposition and its applications to the fault diagnosis of large rotating machinery. Journal of Sound and Vibration, Vol. 314, Issues 3-5, 2008, p. 586-602.
-
Long S. S., Zhang T. B., Long F. Causes and solutions of overshoot and undershoot and end swing in Hilbert-Huang transform. Acta Seismologica Sinica, Vol. 18, Issue 5, 2005, p. 602-610.
-
Chen Q. H., Huang N., Riemenschneider S., et al. A B-spline approach for empirical mode decompositions. Advances in Computational Mathematics, Vol. 24, Issues 1-4, 2006, p. 171-195.
-
Xu Z. G., Huang B. X., Li K. W. An alternative envelope approach for empirical mode decomposition. Digital Signal Processing, Vol. 20, Issue 1, 2010, p. 77-84.
-
Fan Z. P., Hong T. S., Liu Z. Z., et al. Improve the envelope of EMD with piecewise linear fractal interpolation. Key Engineering Materials, Vol. 439, Issue 11, 2010, p. 390-395.
-
Kokes J., Nguyen N. Using constrained cubic spline instead of natural cubic spline to eliminate overshoot and undershoot in HHT. Annals of the Faculty of Engineering Hunedoara-International Journal of Engineering, Vol. 9, Issue 3, 2011, p. 417-457.
-
Qin S. R., Zhong Y. M. A new envelope algorithm of Hilbert-Huang transform. Mechanical Systems and Signal Processing, Vol. 20, Issue 8, 2006, p. 1941-1952.
-
Zhu W. F., Zhao H. M., Chen X. P. A least length constrained envelope approach for EMD. ACTA Electronica Sinica, Vol. 40, Issue 9, 2012, p. 1909-1912.
-
Zhang J. C., Zhao L. A speech denoising method based on improved EMD. International Conference on Multimedia and Signal Processing (CMSP), 2011.
-
Liu S. L., Zhao H. F., Wang H., et al. Application of improved EMD algorithm for the fault diagnosis of reciprocating pump valves with spring failure. 9th International Symposium on Signal Processing and its Applications, 2007.
-
Kopsinis Y., Mclaughlin S. Improved EMD using doubly-iterative sifting and high order spline interpolation. Journal on Advances in Signal Processing, Vol. 31, Issue 7, 2008, p. 120-131.
-
Yang S. X., Hu J. S., Wu Z. T., et al. Study of empirical mode decomposition based on high-order spline interpolation. Journal of Zhejiang University Engineering Science, Vol. 38, Issue 3, 2004, p. 267-270.
-
Wang T., Zhang M. C., Yu Q. H., et al. Comparing the applications of EMD and EEMD on time-frequency analysis of seismic signal. Journal of Applied Geophysics, Vol. 83, Issue 6, 2012, p. 29-34.
-
Hu X. Y., Peng S. L., Hwang W. L. EMD revisited: a new understanding of the envelope and resolving the mode-mixing problem in AM-FM signals. IEEE Transactions on Signal Processing, Vol. 60, Issue 3, 1012, p. 1075-1086.
-
Cheng J. S., Yu D. J., Yu Y. Research on the intrinsic mode function (IMF) criterion in EMD method. Mechanical Systems and Signal Processing, Vol. 20, Issue 4, 2006, p. 817-824.
About this article
This project is supported by the National Natural Science Foundation of China (Grant No. 51175511) and Youth Foundation of PLA University of Science and Technology (No. 42413461A).
