Abstract
High-speed presses are forging machines which are extensively used in industrial production. The load analysis of the high-speed press’ key components is the base for the strength and reliability design. The crankshaft and connecting rod are the structural components with the most violent movement and the heaviest load, so they are the key components of the high-speed press. It is difficult to get the load on the crankshaft and the connecting rod because of the heavy load, the high rotation speed of the transmission system, and its complex structure. The simulation model (also called the virtual prototyping) can simulate real operating conditions, and then obtain a detailed time history of the load. This paper proposes a dynamic simulation model of the high-speed press that can conduct the multibody dynamic simulation and get the simulation load spectrum of the key structural components. Then, the simulation model is corrected based on the field test data to make the load spectrum from the virtual prototyping accurate. Finally the fatigue life of the key structural components is discussed under the load spectrum obtained by the corrected virtual prototyping simulation.
1. Introduction
High-speed presses are forging machines which are extensively used in industrial manufacturing and production [1]. Research on the static analysis of the forging machine was first conducted in the 1970s. Chongqing University computed the shifts and stress of the unit nodes, and then got the line stiffness and angle stiffness of the body by the finite element analysis method according to the brief diagram of the J23-80 press. The results were verified by comparing measured values with theoretically computed values [2]. Subsequently, many research papers focused on the structure optimization of the press columns, most of which were optimized by the finite element method (e.g. Baojun Shi optimized the structure of J21-160 open press) [3]. So far, research on the optimization of the key structural components of the high-speed press transmission system are far fewer. Research of the dynamic analysis on forging machines started in the 1980s and mainly focused on the open high-speed press [4, 5]. Jochen Breitling analyzed different loads and their effects on the dynamic performance of the high-speed press by experimental methods [6]. Xianfeng Lu studied the blanking curve and blanking deformation process of the press, and then measured the time history of the press blanking force [7]. Enlai Zheng, Weiqian Qing and Bingbo Feng studied the piling force, the structure optimization of the transmission system, and the bearing load [8-11].
The crankshaft and connecting rod are the key parts of the transmission system of the high-speed press and they are closely associated with the torque of the machine. As such, they have a great impact on the stability and the efficiency of motion transmission. The high-speed press bears a heavy load in practical working conditions, and the transmission system has a high rotating speed which result in a tremendous impact on loads; thus it is difficult to get the practical load in research tests. Consequently, there are many various popular multibody dynamic simulation software available such as ADAMS, Simpack, Recurdyn, and so on [12-16]. With the above-mentioned software, the stress and strain on the parts with complex shapes under heavy loads can be obtained.
This paper is devoted to virtual prototyping based multibody systems dynamic analysis. It proposes a dynamic simulation model of the high-speed press based on rigid-flexible coupling virtual prototyping. This paper is organized as follows: Section 2 presents the load analysis of the high-speed press. Section 3 demostrates the load data collection of the high-speed press. Section 4 and Section 5 present rigid-flexible coupling dynamic simulation analysis, the load statistics analysis and life prediction of the high-speed press respectively. Section 6 concludes this paper with dynamic analysis and life prediction of the high-speed press.
2. Load analysis of the high-speed press
To make the simulation model approximate to a real high-speed press, the load of the true machine needs to be measured during actual operation. Comparing the actual load with that obtained by the simulation model ensures that the simulation model is amended to reflect the real working conditions as closely as possible. Therefore the real operation conditions of the press should be studied, including taking measurements for the load of the key parts.
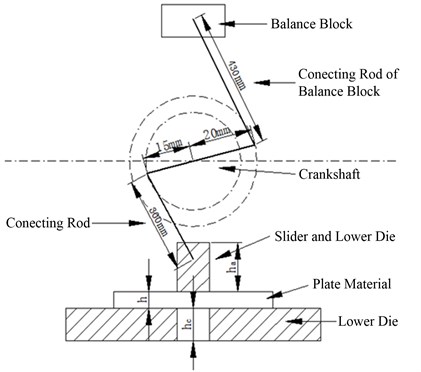
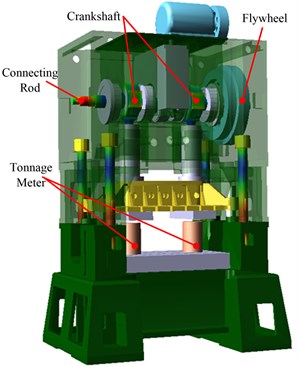
Take the transmission system of the J76-125E press as a case study in this paper. The primary structure of the transmission system is shown in Fig. 1. The stroke of the slider is 30 mm.
Fig. 1The structures of crankshaft and connecting rod
Generally, three kinds of stators and rotors are the most representative components processed by the J76-125E press, which are referred to as component A, component B and component C. The stator and rotor are processed in different work positions, but they are processed simultaneously. Take component A as an example to compute its blanking force. The width of component A is 103 mm and its thickness is 0.40 mm. The material of A is silicon steel sheet, and its elastic modulus is about 195-200 GPa, the Poisson ratio is about 0.25-0.27. The material has no orientation. The shearing modulus is estimated as follows:
The shear force is:
where is the shear modulus of the material; is the perimeter of the blanking area; is the thickness of the material.
The distance between the press lower die base and the bottom dead points is 85 mm. The piling force computed according to Eq. (3) is about 10 N/mm2.
The shearing perimeter of component A for one-time mold-making is 2014.02 mm and the hitting area is 6544.40 mm2 according to the field data. The shear force for one-time processing is 62999 N and the hitting force is 65444 N according to Eq. (1) and Eq. (2), and the total force is 128443 N. The total blanking force of components B and C obtained in the same way is 169993 N and 230200 N, respectively. The parameters measured and computed are shown in Table 1.
Table 1Summary of processing data for three kinds of components
Data categories | Component A | Component B | Component C |
Distance between the lower die table and bottom dead point (mm) | 85 | 100 | 73 |
Thickness of the lower die (mm) | 10 | 15 | 12 |
Rated rotating speed of principal axis (r/min) | 2950 | 2950 | 1475 |
Blanking force (N) | 128443 | 169993 | 230200 |
3. Load data measurement of the high-speed press
3.1. Measuring method of load data
The field test was performed for the J76-125E high-speed press, and then the load data of the J76-125E and the operational information were obtained. The main parameters are measured as follows:
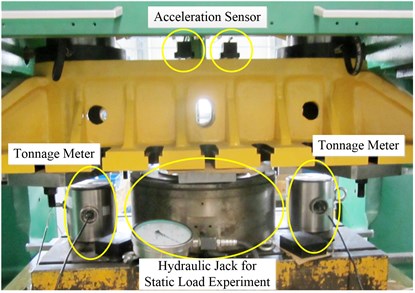
1) Acceleration. The acceleration of the upper die and slider can be measured directly by the acceleration sensor (type A104EX-100G) installed on the slider.
2) Force. The piling force on the upper die is the main force source in operation, especially the instantaneous force by the collision of the upper die and the workpiece. Generally, two tonnage meters (type Sigmar-810 H/500 t) are used to measure the piling force on the upper die. The installation of the acceleration sensor and tonnage meter are shown in Fig. 2.
Fig. 2The installation of acceleration sensor and tonnage meter
The disturbance by the other variables should be reduced as little as possible to make the test data accurate, so the test is conducted by way of piling. The maximum impact force of the upper die is 125 tons and the top blanking speed is 330 r/min, so the piling forces are divided into 0 t, 50 t, 75 t, 100 t and 125 t and the frequencies are divided into 150 r/min, 200 r/min, 250 r/min, 300 r/min, 330 r/min and 350 r/mm (In order to maintain safe operation, a frequency of 350 r/min is only tested under the piling force of 0 t and 50 t). Based on above division, 27 groups of tests are conducted.
3.2. Measured results
Take the test of piling force of 75 t and the frequency of 300 r/min as an example and this test is referred to as 75 t-300 r/min below this paper. The test results are shown in Fig. 3 and Fig. 4.
Fig. 3The piling force under 75 t-300 r/min condition
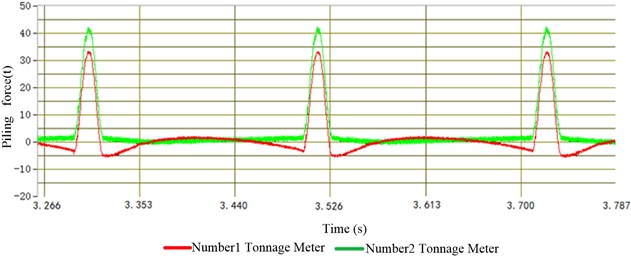
Fig. 4Slider acceleration under 75 t-300 r/min condition
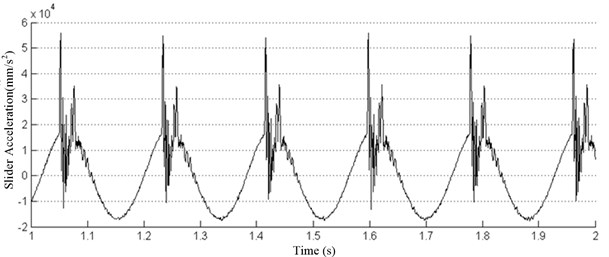
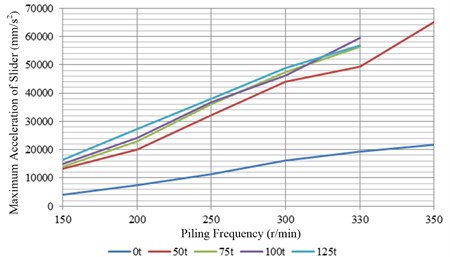
Fig. 3 and Fig. 4 show that the piling force and the slider acceleration are significantly periodic, and the return cycle is equal to the piling cycle, that is about 0.3 s. The piling force of No. 1 and No. 2 tonnage meter is slightly different, but the total force can reach the set value in the test. The peak acceleration of the slider is about 22500 mm/s2 in one cycle and it is slightly different in one working condition during each cycle. The maximum accelerations of the slider are tested in 27 different operating conditions, and shown in Table 2 and Fig. 5.
Table 2Maximum acceleration under different operating conditions (mm/s2)
Piling frequency (r/min) | 0 t | 50 t | 75 t | 100 t | 125 t |
150 | 4146.58 | 13220.89 | 14078.58 | 14892.08 | 16417.84 |
200 | 7425.75 | 20084.90 | 22885.84 | 24173.27 | 27383.16 |
250 | 11431.11 | 32036.20 | 35987.36 | 36806.38 | 38076.53 |
300 | 16171.37 | 42920.13 | 47431.20 | 46174.37 | 48758.53 |
330 | 19411.06 | 49450.41 | 56371.17 | 58391.14 | 58776.10 |
350 | 21785.40 | 65104.63 |
4. Multibody dynamic simulation
According to the multibody dynamic simulation, the stress and strain of the complex structural components under the load can be obtained. How closely the virtual prototyping model and the true high-speed press related directly decides the accuracy of the load data obtained by the multibody dynamic simulation. The previous data measured in the field test should be used to correct the simulation model.
Fig. 5The changes of maximum acceleration under different piling frequencies
4.1. Simulation model
Earlier studies show that the high-speed press needs to bear a heavy load in practical working conditions, and that the transmission system has a high rotating speed, which results in a tremendous impact on the load, thus it is difficult to test the practical load. Using the dynamic simulation method, however, can solve this problem. The 3D model of the high-speed press is modelled in a three-dimension solid (CATIA), and then the model is imported into an ADAMS enviroment. The 3D model and ADAMS model are shown in Fig. 6 and Fig. 7 respectively.
Fig. 63D model of the high-speed press
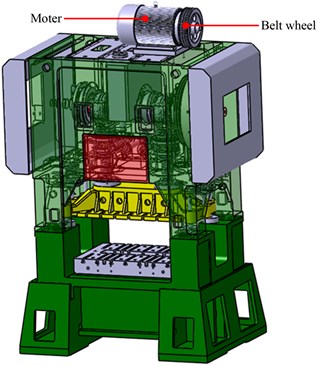
Fig. 7ADAMS model of of the high-speed press
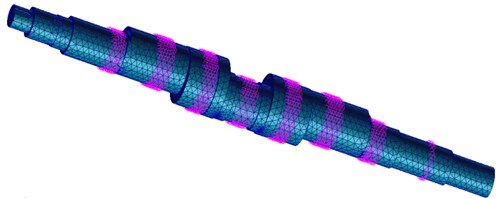
The load of the key parts can be obtained by the dynamic simulation based on the ADAMS software. The stiffness, density and Poisson’s ratio parameters of the materials should be set in the target simulation models. When the target parts are divided into meshes and made into flexible components, the deformation and internal stress approximating true conditions can be simulated through ADAMS. Before the simulation is performed in ADAMS, the established parts should be made into flexible bodies in the format file with a .mnf filename including the modal parameters of the target parts. The flexible bodies of the .mnf filename file are made as shown in Fig. 8. The .mnf filename file should be imported into ADAMS to replace the original rigid body model. The made-flexibe model of the connecting rods and crankshaft are shown in Fig. 9 and Fig. 10 respectively.
Two columns are established in ADAMS in order to simulate the tonnage meter. The position and size parameters are set according to the real high-speed press. After the parts are replaced by the flexible bodies, the parameters of the simulation model are further set, and the final ADAMS model is shown in Fig. 7.
Fig. 8Flowchart for making a .mnf filename file

Fig. 9Connecting rod mesh
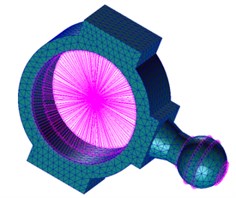
Fig. 10Crankshaft mesh
4.2. Parameter setting and simulating
The frequency of the piling is set according to the order of 150 r/min, 200 r/min, 250 r/min, 300 r/min, 330 r/min or 350 r/min, and the piling force is set according to the order of 0 t, 50 t, 75 t, 100 t or 125 t in the virtual prototyping. The frequency of piling can be set by setting initialization speed parameters of the belt wheel. The initial speed of the hinge joint of the belt wheel is set at 1800°/s, 2400°/s, 3000°/s, 3600°/s, 3960°/s or 4200°/s during simulating according to the transmission ratio of the coupling constraint of the belt wheel, flywheel, and the crankshaft rotating speed. The piling force of the press can be adjusted according to the height of the column. As shown in Table 3, the data of the piling force and the tonnage meter height can be obtained based on the parametric analysis function of ADAMS [16].
Table 3The piling force and the tonnage meter height
The tonnage meter height | Piling force | The tonnage meter height | Piling force | The tonnage meter height | Piling force |
299 | –3.91 | 300.7 | 23.62 | 302.4 | 61.70 |
299.1 | –2.68 | 300.8 | 25.55 | 302.5 | 64.26 |
299.2 | –1.24 | 300.9 | 27.58 | 302.6 | 66.88 |
299.3 | 0.17 | 301 | 29.60 | 302.7 | 69.45 |
299.4 | 1.62 | 301.1 | 31.52 | 302.8 | 72.25 |
299.5 | 3.11 | 301.2 | 33.72 | 302.9 | 74.96 |
299.6 | 4.60 | 301.3 | 35.83 | 303 | 77.71 |
299.7 | 6.24 | 301.4 | 38.02 | 303.1 | 80.45 |
299.8 | 7.73 | 301.5 | 40.21 | 303.2 | 83.30 |
299.9 | 9.36 | 301.6 | 42.37 | 303.3 | 86.08 |
300 | 11.02 | 301.7 | 44.45 | 303.4 | 89.38 |
300.1 | 12.71 | 301.8 | 47.01 | 303.5 | 91.03 |
300.2 | 14.42 | 301.9 | 49.22 | 303.6 | 94.95 |
300.3 | 16.15 | 302 | 51.78 | 303.7 | 98.03 |
300.4 | 17.99 | 302.1 | 54.25 | 303.8 | 101.16 |
300.5 | 19.80 | 302.2 | 56.63 | 303.9 | 104.10 |
300.6 | 21.72 | 302.3 | 59.16 |
Considering the data provided in Table 3, the piling force and the tonnage meter height have the following relationship:
Eq. (3) is the function relationship between the piling force and the tonnage meter height which is represented by . Obviously, the tonnage meter height has relationship with the installation of the tonnage meter in practice,what makes Eq. (3) inapplicable. In order to make Eq. (3) more applicable, we suppose the piling contact area is and the piling penetration depth is . The piling contact area in simulation is 31416 mm2 and the distance between the bottom of tonnage meter and the lower dead point is 299 mm, then .
Eq. (3) can be changed into the following one:
Simplifying the above equation:
where represents the piling force and its unit is N; represents the piling penetration depth in simulation and its unit is mm; represents the piling contact area and its unit is mm2.
The design values of the penetration depth and the height of the tonnage meter column under different piling forces obtained according to Eq. (3) and (4) are shown in Table 4 (half of the total piling force is the measured value of a single tonnage meter). After parameters are set, simulation should be performed under different work conditions. The results are summarized and analyzed in Section 5.
Table 4Tonnage meter and penetration depth setup under different piling force in simulation
Piling force of tonnage meter (t) | Penetration depth (mm) | Column height of tonnage meter (mm) |
25.00 | 1.84 | 300.84 |
37.50 | 2.50 | 301.5 |
50.00 | 3.03 | 302.03 |
62.50 | 3.50 | 302.5 |
5. Load data analysis
5.1. Data statistics
The load data obtained by simulating should be exported for further statistical analysis. The maximum stress and strain of the two kinds of components in 30 simulation working conditions are shown in Table 5 to Table 8. The data indicates that different piling frequencies have little impact on the maximum stress and strain under the same piling force. When the high-speed presses are not in loading, the maximum stress and strain increase with the increasing of frequency of piling. When the high-speed presses are in loading, the maximum stress and strain keep nearly unchanged with increasing frequency of piling, or even at a slight reduction. Taking the 300 r/min frequency of the piling as an example, the changes of the maximum value stress and strain of two components with the changes of the piling forces are shown in Fig. 11 and Fig. 12. From Fig. 11 and Fig. 12, we can see that the maximum stress and strain of components are not affected by the piling frequency, so the tendencies of the maximum stress and strain with the changes of the piling force under the other piling frequencies are similar to what is shown in Fig. 11 and Fig. 12.
The relationship between the maximum stress and the piling force can be obtained from Fig. 11 and Fig. 12 and the coefficients of Eq. (5) are listed in Table 9.
where represents the piling force in units of t; represents the maximum value stress and strain on the component in units of MPa.
According to Eq. (5), the maximum piling force the high-speed press bear can be obtained under the permissible stress, and then the maximum strain when the high-speed press are under the maximum piling force condition can be calculated. Namely, Eq. (5) can be used to calculate the maximum piling force and the maximum strain which are useful in the design of high-speed press.
Table 5Maximum value of connecting rod stress (MPa) under different working conditions
Piling frequency (r/min) | 0 t | 50 t | 75 t | 100 t | 125 t |
150 | 2.64 | 95.53 | 148.21 | 197.79 | 245.32 |
200 | 3.23 | 95.00 | 147.68 | 197.26 | 244.80 |
250 | 3.98 | 94.36 | 147.01 | 196.59 | 244.13 |
300 | 4.91 | 93.50 | 146.18 | 195.77 | 243.32 |
330 | 5.54 | 92.96 | 145.67 | 195.25 | 242.76 |
350 | 5.99 | 92.56 | 145.22 | 194.84 | 242.40 |
Table 6Maximum value of connecting rod strain (10-6) under different working conditions
Piling frequency (r/min) | 0 t | 50 t | 75 t | 100 t | 125 t |
150 | 27.33 | 988.57 | 1533.75 | 2046.72 | 2538.74 |
200 | 33.40 | 983.16 | 1528.34 | 2041.36 | 2533.39 |
250 | 41.20 | 976.53 | 1521.42 | 2034.45 | 2526.44 |
300 | 50.74 | 967.61 | 1512.78 | 2025.95 | 2518.09 |
330 | 57.30 | 962.07 | 1507.55 | 2020.65 | 2512.26 |
350 | 61.99 | 957.89 | 1502.88 | 2016.39 | 2508.55 |
Table 7Maximum value of crankshaft stress (MPa) under different working conditions
Piling frequency (r/min) | 0 t | 50 t | 75 t | 100 t | 125 t |
150 | 8.75 | 58.26 | 90.65 | 121.17 | 150.55 |
200 | 11.69 | 57.92 | 90.28 | 120.79 | 150.16 |
250 | 11.71 | 57.42 | 89.80 | 120.30 | 149.71 |
300 | 11.72 | 56.83 | 89.19 | 119.72 | 149.11 |
330 | 11.74 | 56.38 | 88.81 | 119.31 | 148.73 |
350 | 11.75 | 56.15 | 88.51 | 119.06 | 148.42 |
Table 8Maximum value of crankshaft strain (10-6) under different working conditions
Piling frequency (r/min) | 0 t | 50 t | 75 t | 100 t | 125 t |
150 | 100.38 | 544.62 | 846.29 | 1130.89 | 1404.49 |
200 | 100.57 | 540.47 | 841.97 | 1126.43 | 1399.83 |
250 | 100.75 | 535.09 | 836.51 | 1120.78 | 1394.11 |
300 | 100.94 | 529.12 | 829.98 | 1114.02 | 1387.17 |
330 | 101.04 | 525.01 | 825.54 | 1109.51 | 1382.58 |
350 | 101.15 | 521.59 | 822.78 | 1106.77 | 1379.70 |
Fig. 11Maximum value of components stress under different piling forces
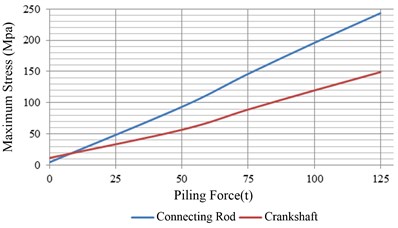
Fig. 12Maximum value of strain of components under different piling forces
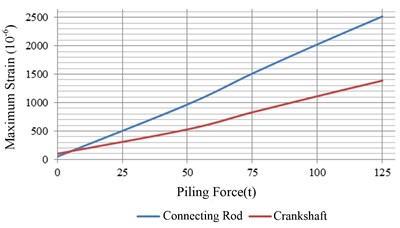
Table 9The values of a and b
The maximum stress of the connecting rod (MPa) | 1.92 | 2.23 |
The maximum stress of the crankshaft (MPa) | 1.11 | 7.512 |
The maximum strain of the connecting rod (10-6) | 19.89 | 23.10 |
The maximum strain of the crankshaft (10-6) | 10.40 | 64.12 |
5.2. Results comparison
The aim of the multibody dynamic simulation is to get the accurate load data, therefore how well the simulation model fits the real condition is of great importance. Some experimental data were measured during the high-speed press operation, and then this section presents the contrast between the measured data and the simulation data to check the accuracy of the simulation model.
5.2.1. Comparison of the piling force
The piling force of the simulation model is generated due to the collision of the model. It can be observed that the simulation piling force has a high similarity to the measured piling force by the comparison between Fig. 3 and Fig. 13 in 75 t-300 r/min working conditions. The forces of two tonnage meters may be different in the field test, but they are the same in simulation. Comparison of the piling force between simulation and measured data obtained under all working conditions is conducted, and it shows that they match well.
Fig. 13Piling force of tonnage meter in 75 t-300 r/min condition (simulation)

5.2.2. Comparison of the slider acceleration
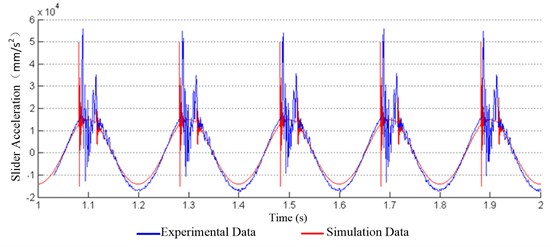
The experimental curve of Fig. 4 is compared with the simulation curve of Fig. 14 in the 75 t-300 r/min working condition. The real frequency of piling is not very precise when experimenting, and there is a deviation between the set speed and the real speed. To compare and observe two curves in detail, the frequency of the curve in Fig. 4 is slightly adjusted to match the frequency of the simulation and keep the phasees of two curves the same. The two curves are shown in Fig. 15.
The two curves have the same trend in one cycle. From the cure, two peaks occur when the slider makes contact with the tonnage meter, and they exit at the time the slider contacts the tonnage meter and leaves from the tonnage meter respectively. The first peak is relatively bigger and the second peak is smaller. The experimental curve and simulation curve of the slider acceleration are approximately the same for both the trend and the peak extreme in all other working conditions. This indicates that the simulation model can fit the piling dynamic features of the slider accurately. The rest comparison diagrams are not listed one by one.
There are several peaks in the experimental curve and simulation curve in one cycle, which obviously embody the “viscous effect.” The explanation is that the tonnage meter is not fully fixed on the base, but placed on the base by its gravity in the experiment. After the slider generates a huge impact force on the tonnage meter in the case of piling, the slider would leave from the tonnage meter, and then the tonnage meter bounces up and collides with the slider, so the change of acceleration leads to the viscous effect.
Fig. 14Slider acceleration in the 75 t-300 r/min condition (simulation)
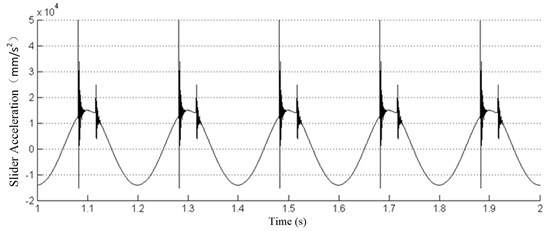
Fig. 15Comparison of slider acceleration between experiment and simulation in the 75 t-300 r/min
5.3. Life prediction
MSC. Fatigue is a function module, which is used to analyze the material fatigue in Patran software. It can read the load file of the flexible body established by ADAMS and predict the fatigue life of the flexible body. The fatigue life of the connecting rod and crankshaft can be predicted by the S-N (stress or strain life) curve method in MSC. Fatigue. The following part analyzes the data in the extreme working conditions, over-limit working conditions and real working conditions.
The material of connecting rod and crankshaft is 42CrMo, its elastic modulus is 212 GPa, the Poisson ratio is 0.28, and the density is 7.85×10⁻⁶ kg/mm3. The connecting rod and crankshaft are divided into meshes in Patran software. There are 14834 units, 23492 nodes and 29501 units and 44917 nodes, respectively.
5.3.1. Extreme working condition
Fig. 16 shows that the weakest point of the connecting rod is located at the number 6495 node on the column‘s inner surface. The life of the number 6495 node is 107.59 cycles. Based on the parameter setting in Section 3, one simulation cycle requires 3 s, then the life is 32420.5 hours, in other words, 45 months. Besides the fact that the fatigue life of the points on the column‘s inner surface with unequal forces is shorter, the circulation life in the narrow area of the column above the connecting rod hinge is less than 108.42 cycles, namely 219189 hours, about 304.5 months. When the press is operating in real time, wearing and pitting risks exist in the contact inner surface of the column between the connecting rod and bearings in several unequal surface areas during a short period of time (4 years). The narrow area above the ball head connector is easy to crack after a longer period of time (25 years).
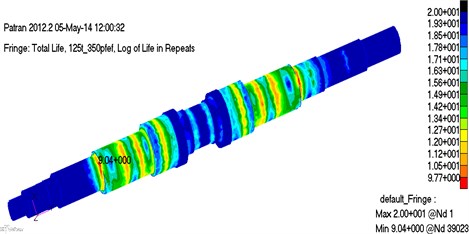
Fig. 17 shows that the minimal life point of the crankshaft is number 39023 node. Its life is 109.04, namely 913732 hours, or 1269 months. The crankshaft bears force uniformly, and its fatigue life is longer than that of the connecting rod, therefore it is safe in the operation of the press.
Fig. 16Life prediction cloud diagram of connecting rod under 125 t-350 r/min
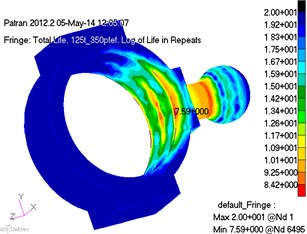
Fig. 17Life prediction cloud diagram of crankshaft under 125 t-350 r/min
5.3.2. Over-limit working conditions
The load of simulation of the connecting rod and crankshaft are exported into MSC. Fatigue, then calculate the fatigue. New life cloud diagrams are shown in Fig. 18 and Fig. 19.
Fig. 18Life prediction cloud diagram of connecting rod under 250 t-350 r/min
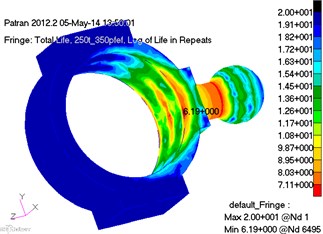
Fig. 19Life prediction cloud diagram of crankshaft under 250 t-350 r/min
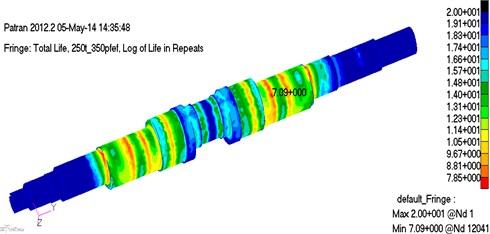
Fig. 18 and Fig. 19 show that the life of two components are almost similar in distribution but change only in their values. The position of the shortest life point of the connecting rod does not change, but its life reduces to 106.19 under over-limit working conditions, namely 1291 hours, or 1.8 months. The area above the ball hinge, which has a life span of less than 108.42, expands greatly. The shortest life point of the crankshaft is number 12041 node changing from the left to the right. The life span reduces to 107.09, namely 10252 hours, or 14 months.
All of this indicates that the load form of the high-speed press does not change. When the load increases, the life distribution of the parts continues to be roughly stable but life of almost all areas reduce. The position of the shortest life point may change.
5.3.3. True working conditions
Import the load data gained from the simulation method into MSC. Fatigue, and then calculate the fatigue life of the connecting rod and the bent axle. The new life cloud diagrams are shown in Fig. 20 and Fig. 21.
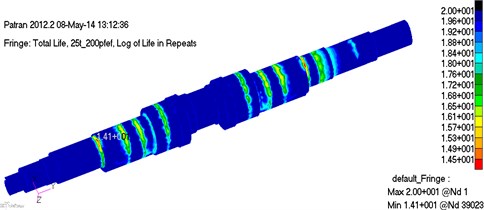
Fig. 20 and Fig. 21 show that the shortest life of the connecting rod is 1012.4 cycle time (3 s for one cycle) when the high-speed presses are under the actual operation, namely 2.09×10⁹ hours, or about 2.9×10⁶ years. The shortest life of the crankshaft is 1014.1, namely 1.05×10¹¹ hours, or about 1.2×10⁷ years. The life of the two components are very close, so the risks of fatigue failure of the two componentsis are very low.
Fig. 20Life prediction cloud diagram of connecting rod under 25 t-200 r/min
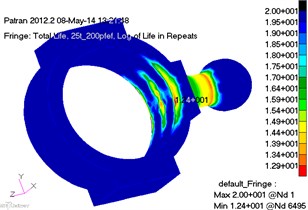
Fig. 21Life prediction cloud diagram of crankshaft under 25 t-200 r/min
As we know that the virtual prototyping simulation model of the high-speed press can conduct the multibody dynamic simulation and get the load data of the key structural components. Then, the fatigue life of the high-speed press’ key structural components can be predicted under the load spectrum obtained by the corrected virtual prototyping simulation model and then the high-speed press can be designed optimally. Furthermore, the load spectrum of the key structural components can be a reference for the reliability design of the key structural components of the high-speed press in similar size.
6. Conclusions
This paper proposed a simulation model of dynamic analysis of the high-speed press based on rigid-flexible coupling virtual prototyping, and introduced the structure and primary performance parameters of the J76-125E high-speed press. In addition, modeling methods and procedures for rigid body, flexible body and fatige life prediction were also illustrated, and the rigid-flexible coupling virtual prototyping models of the connecting rod and crankshaft were built and its validity were verified. It is concluded that:
1) The virtual protyping in this paper is correct after comparing the measured data to the simulated data. It proves that the virtual prototyping in this paper can better simulate true working conditions of the high-speed press and there is more confidence in the load data gained from the simulation.
2) Under the extreme working conditions, the maximum stress of the connecting rod is about 247 MPa and its maximum strain is about 1.84×10⁻³; the maximum stress of the crankshaft is about 148.5 MPa and its maximum strain is about 1.38×10⁻³. The maximum stress and strain are at the maximum piling force of each cycle and they have nothing to do with piling frequency, but with the piling force instead. The maximum stress and strain of the structures are linearly related to the piling force respectively.
3) The structures of the connecting rod and crankshaft meet the operation life in the maximum conditions. The internal surface of the connecting rod may fail because of the pitting in a shorter time (4 consecutive years working). The column above the ball hinge may crack after a longer period of time (25 consecutive years working). The weak areas of the crankshaft mainly include the transition areas between the shaft diameter sections, especially the contact surface with the bearing. The life of the crankshaft is longer than that of the connecting rod (96 consecutive years working). The life of the connecting rod and crankshaft would reduce dramatically under the over-limit working conditions (250-ton piling force).
4) The maximum stress and strain points are approximate to the shortest life points in the finite element cloud diagram of the structures, but they may not be located at the same node. The life distribution does not change with the changes of working conditions, but the positions of the shortest life may change.
5) Generally, the actual operation working conditions of the high-speed press are far less than the permitted working conditions in design. Under the actual working conditions, the computed maximum stress of the connecting rod is about 42.5 MPa and its maximum strain is about 4.39×10⁻⁴. The maximum stress of the crankshaft is about 25.1 MPa and its maximum strain is about 2.36×10⁻⁴. The life of the structures approximate to an unlimited lifetime under the actual operation conditions, thus they will not fail due to fault in material.
References
-
Shengdun Z., Xuelai Z., Changyu G. Current condition and its development trend of high-speed press. Forging Equipment and Manufacturing Technology, Vol. 40, Issue 1, 2005, p. 19-24.
-
Calculation of shift and stress of J23-80 press body based on finite element method. Chongqing University, Vol. 10, Issue 4, 1975, p. 10-12.
-
Baojun S., Xiaoyang L., Jing L. Computing and analysis of body rigidity and strength of J21 press. Forging Machine, Vol. 34, Issue 2, 1999, p. 34-35.
-
Bocharow Y. A., Vasow A. V. Computer aided analysis of screw press dynamic. International Journal of Machine Tools and Manufacture, Vol. 27, Issue 2, 1987, p. 23-25.
-
Lp W. Analysis of blow stages and calculation of force energy parameters for clutch screw press. Proceedings of the First International Conference on Research and Design of Metal Forming Machine, Beijing, 1989.
-
Jochen B., Darrell W., Taylan A. Investigations of different loading conditions in a high speed mechanical press. Journal of Materials Processing Technology, Vol. 59, Issue 1, 1996, p. 18-23.
-
Xianfeng L. Research on blanking curve and blanking deformation process. Forging Technology, Vol. 31, Issue 6, 1988, p. 32-36.
-
Enlai Z., Fang J., Zhisheng Zhang. Load spectrum analysis for combined frame of closed high-speed press. Journal of Southeast University (English Edition), Vol. 27, Issue 1, 2005, p. 40-46.
-
Bingbo F., Shuanhu W., Ding W. Thermal analysis on high-speed punch crankshaft based on analysis. Coal Mine Machinery, Vol. 31, Issue 7, 2010, p. 77-79.
-
Bingbo F., Shuanhu W., Wang D. Thermal analysis on whole high-speed punch based on analysis. Machine Design and Manufacturing, Vol. 49, Issue 11, 2011, p. 200-202.
-
Weiqian Q., Shuanhu W., Deqian X. Dynamic simulation analysis of high-speed punch actuator based on Adams and analysis. Forging Technologies, Vol. 36, Issue 6, p. 159-162.
-
Ryan R. R. Adams Multibody System Analysis Software, Multibody Systems Handbook. Springer-Verlag, Berlin, 1990.
-
Adams Help. http://www.mscsoftware.com/Adams/, 2013.
-
Zhiwei C., Yueliang D. MSC ADAMS Multibody Kinetic Simulation Foundation and Instance Analysis. China Water Power Press, Beijing, 2012.
-
Wang G. G. Definition clarification and review on virtual prototyping. International Design Engineering Technical Conference and Design Automation Conference, Pittsburgh, Pennsylvania, September 9-12, 2011.
-
ASME Design Technical Conference and Computers in Engineering Conference. DETC2001/CIE 21265, Pittsburgh, Pennsylvania, 2001.
About this article
Our deepest gratitude goes first to the editors and reviewers for their constructive suggestions on the paper. And thank the authors of this paper’s references whose work have contributed greatly to the completion of this thesis. Second, we would like to thank the Important National Science and Technology Specific Projects of China (2014ZX04014-011) and Special Industrial Base Construction Projects of Science and Technology Development Plan of Jilin Province (20130302009GX).
