Abstract
Investigations from recent strong earthquakes indicate most of the tunnels severely damaged are located near the causative faults. First, the dynamic response of the tunnel to the near-fault and far-field ground motions was investigated. The results show that the near-fault motions with long-period pulses especially the forward directivity pulses are more damaging than the typical far-field records, which should be reflected in the seismic design guideline for tunnels near causative faults. Furthermore, the effects of the key parameters for the simplified pulse on the dynamic response of the tunnel were also studied. Generally, the pulse with larger amplitude brings more energy and leads to larger strains in rock. Consequently, it becomes more damaging to the tunnel. The period of the pulse can remarkably influence the response of the tunnel. When the period of the pulse is less than 3.0 s, the pulse becomes less damaging to the tunnel with the increase of the period. Once the period exceeds 3.0 s, the pulse has little effect on the dynamic response of the tunnel. Thus, the earthquake with lower magnitude, which is likely to leads to lower period, may be more damaging to the tunnel. Besides, as the number of significant cycles increases, the damage potential of the ground motions increases accordingly. For the sake of security, two significant cycles in velocity-time history are recommended for the seismic design of tunnels close to ruptured faults.
1. Introduction
Increasing database of recorded ground motions from recent earthquakes have shown that the ground motions can be strongly influenced by the evolution of the rupture process (forward directivity effect) and the permanent offset of the ground (fling effect) [1-2]. Consequently, near-fault ground motions are often characterized by high amplitude, long-period velocity pulse, and they are significantly different from typical far-field motions. Generally, the long-period pulse makes the ground motion more damaging to structures. Thus, the characterizations, identification methods [3, 4], numerical simulation of near-fault ground motions [5-7], as well as their effects on engineering structures, are currently active research topics.
The seismic performances of structures (for example bridges [8], site [9], dam [10], steel moment frames [11] and multi-story buildings [12]) have been extensively investigated, and many appropriate design strategies for structures located near the ruptured faults have been proposed. However, most of these studies are mainly focused on the above-ground structures, and few studies have been conducted on the underground structures. Although the underground structures are generally less vulnerable to earthquakes compared to above-ground structures, several tunnels suffered severe damages during recent strong earthquakes (e.g., Kobe earthquake 1995, Chi-Chi earthquake 1999, and Wenchuan earthquake 2008). Furthermore, even a low level of damage to the tunnel may affect the serviceability of a wide network [13]. Observations from recent strong earthquakes indicate that most damaged tunnels are located near causative faults, and the presence of severe, long-period pulses in near-fault ground motions may be a key factor in causing damages. Thus, it is necessary to investigate the effect of the long-period pulse on tunnels in order to interpret the observed damages.
At present, there are two approaches to account for near-fault ground motions. The first is the frequency-domain approach uses empirical factors to modify acceleration response spectra for sites [2]. The second is the time-domain approach characterizes the ground motion through its velocity-time history, with the amplitude (PGV), period (Tv) and the number of significant cycles [14]. The second approach specifies design ground motion, and it can provide an adequate representation of near-fault ground motions. In order to obtain these parameters, many recent studies have developed the relationships between pulse parameters and earthquake characteristics. A frequently investigated relationship is that between the pulse period and the earthquake magnitude [15-18]. The relationship between the pulse amplitude and earthquake parameters (magnitude, epicenter distance) is also addressed [11, 19, 20]. However, in addition to the earthquake magnitude and epicenter distance, the site condition [9], local geography, slip heterogeneity on the fault plane, and source-site geometry [21] can also influence the pulse parameters. It is still very difficult to determine the pulse parameters for a specific engineering site. Therefore, parametric studies on the effects of pulse parameters on the tunnel may provide valuable insights to the design guideline for tunnels.
The main objectives of this study are to investigate the effect of near-fault ground motions on the seismic performance of tunnels and identify key parameters for pulses that may affect the response of tunnels near ruptured faults. In the first part of this paper, several pulse-type ground motions were chosen, and the seismic response of a tunnel in Tibet to near-fault and far-field ground motions was investigated. Subsequently, the effects of the pulse on the seismic performance of the tunnel were studied though the time-domain approach, and the parameters that can reasonably assess the damage potential of near-fault ground motions to tunnels were proposed. The conclusions may provide valuable insights to practice and development of seismic design guideline for tunnels close to the ruptured faults.
2. Tunnel description and simulation model
2.1. The Galongla tunnel
2.1.1. Seismicity of the region
The Galongla tunnel is located in Nyingchi, Tibet, and it is the bottleneck project of Zha-mo Highway connecting Bomi and Medog. This is a 3300 m long tunnel with a maximum cover of 833 m. There are two causative faults: Galongsi fault and Zhamu-Maniwong fault in the region. The later fault can cause strong earthquakes with the magnitude of greater than 7.5 (Mw), and the nearest distance between the tunnel and the Maniwong fault is only 300 meter. So the tunnel may be influenced by the near-fault ground motions during its service period.
2.1.2. Geological and geotechnical properties
Most of seismic damages to tunnels happen at the portals due to the poor rock mass, small rock cover, and unsymmetrical pressure [22]. Therefore, this study was conducted at Bomi portal of the Galongla tunnel. At the Bomi portal, the surrounding rock within 50 m of the ground surface consists mainly of gravel and strongly weathered schist. According to the China standard [23], the grade of the rock mass is judged to be grade V, and the mechanical parameters for the surrounding rock mass are shown in Table 1.
Table 1Mechanical parameters of the surrounding rock mass
Shear modulus (GPa) | Poisson’s ratio | Cohesion (MPa) | Friction angle (°) | Density (kg m-3) |
1.0 | 0.35 | 0.15 | 25 | 2040 |
2.1.3. Tunnel lining
The transverse section of the Galongla tunnel was shown in Fig. 1. The tunnel linings consist of initial and final lining. The thicknesses of the initial and final linings are 24 cm and 50 cm respectively. According to the China Standard [24], the shotcrete for the initial lining is classified as C20, and the reinforced concrete for the final lining is classified as C30.
Fig. 1Diagram of the Galongla tunnel
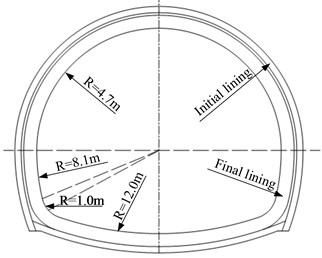
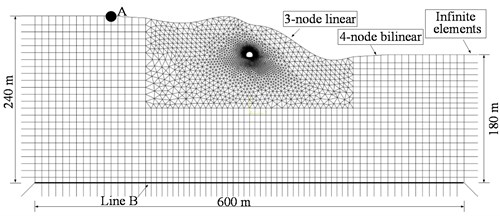
Fig. 2Meshing diagram
2.2. Simulation model
ABAQUS FEM (finite element method) software was selected to model and valuate the problem. There were 8566 elements and 5353 nodes in the meshing diagram (Fig. 2). Two types of plain strain elements (3-node linear, 4-node bilinear) were used, and the infinite elements were used as absorbing boundaries.
In the analysis, the behavior of the rock mass was assumed to be elastic-perfectly plastic, and it obeyed the Mohr-Coulomb failure criterion with tension cut-off. The damaged plasticity model was chosen to simulate the behaviors of the initial and final lining. Details of this model will be introduced in the next chapter. According to previous study [13], when the stiffness of the geomaterials where the tunnel is located is relatively large, the propagating wavefield is mainly characterized by wavelengths that are large with respect to the size of the lining. Under these conditions soil-structure interaction effects can be negligible. So the rock-structure interaction is ignored in this study.
Most of recorded ground motions are obtained at the ground surface. However, the ground motions should be applied at the bottom boundary (Line B) during the seismic analysis of underground structures. In order to obtain the ground motion at the input boundary, back analysis was carried out in this paper. First, the recorded ground motion, a(t), was chosen from the Next Generation Attenuation (NGA) ground motion library (http://peer.berkeley.edu/nga). Next, it was divided by 2 and was applied at the bottom boundary. Then the ground motion at the ground surface, a'(t), was obtained. The applied ground motion was adjusted according the difference between a'(t) and a(t). At last, the ground motion at the bottom boundary was got.
The numerical analysis consisted of two steps: the first, a static step included the application of a gravitational force and the simulation of tunnel excavation. During the first step, the bottom boundary of the model was fixed in vertical direction, and the lateral boundaries were fixed in horizontal direction. During the subsequent dynamic step, the excitation was applied on the bottom boundary of the model as a stress-time history, and the bottom boundary and the lateral boundaries of the main grid were coupled to the infinite elements.
2.3. Damaged plasticity model for concrete
Generally, concrete behaves in a brittle manner, and the main failure mechanisms are cracking in tension and crushing in compression. Damage happens to concrete associated with the failure mechanisms during earthquakes, so the concrete damaged plasticity model [25-27] was used to describe the behaviors of lining concrete. This model has the capability for the analysis of concrete structures under cyclic and dynamic loading.
2.3.1. Stress-strain relations
The failure stress corresponds to the onset of micro-cracking in the concrete material. When the concrete specimen is unloaded from any point on the yield surface, the unloading response is weakened: the elastic stiffness of the material appears to be damaged (or degraded). The scalar variable d is introduced to describe the stiffness degradation, and stress-strain relations are governed by scalar damaged elasticity:
where σ is the stress; d is the scalar stiffness degradation variable;εel is the elastic strain; ε is the total strain;εpl is the plastic strain;Del0 is the undamaged elastic stiffness of the concrete; Del is the degraded elastic stiffness;ˉσ is the effective stress which is defined as ˉσ=Del0:(ε-εpl).
For the uniaxial cyclic conditions:
sc=1-ωc(1-r*(ˉσ11)),0≤ωc≤1,
where dc is compressive damage variable; dt is tensile damage variable:
In this study, the rock cover of the tunnel is less than 50 m at the portal, so the stiffness degradation damage caused by compressive failure (crushing) of the concrete, dc, is assumed to be zero. From Eq. (2)-(4), in tension (ˉσ11>0), r*=1, thus, d=dt. In compression (ˉσ11<0), if ωc=1, then d=0; the material fully recovers the compressive stiffness. If, on the other hand, ωc=0, there is no stiffness recovery.
2.3.2. Hardening variables
Since the failure mechanisms of compression and tension are different, damaged states in tension and compression are characterized independently by two hardening variables, the equivalent plastic strains in tension ˜εplt and the equivalent plastic strains in compression ˜εplc. The evolution of the hardening variables is given by an expression of the form:
2.3.3. Yield function
The yield function F(ˉσ,˜εpl)≤0 represents a surface in effective stress space, which determines the states of failure or damage. The yield function proposed by Lubliner et al. [27] and incorporates the modifications proposed by Lee and Fenves [26] was adopted:
where α and β are dimensionless material constants;ˉp=-1/3ˉσ:I is the effective hydrostatic pressure; ˉq=√3/2ˉS:ˉS is the Mises equivalent effective stress; ˉS=ˉpI+ˉσ is the deviatoric part of the effective stress tensor; γ=3(1-Kc)/(2Kc-1), kc is the ratio of strength in equibiaxial compression to the strength in triaxial compression; ˆˉσmax is the algebraically maximum eigenvalue of ˉσ.
The function β(˜εpl) is given as:
where ˉσt and ˉσc are the effective tensile and compressive cohesion stresses, respectively. The coefficient α can be determined from the initial equibiaxial and uniaxial compressive yield stress, and the typical experimental values for concrete are in the range from 0.08 to 0.12 [27].
2.3.4. Flow rule
The model uses non-associated plasticity, and the plastic flow is governed by a flow potential G according to the flow rule:
where ˙λ is the nonnegative plastic multiplier; Ψ is the dilation angle measured in the p-q plane at high confining pressure; σt0 is the uniaxial tensile stress at failure; and ϵ is a parameter, referred to as the eccentricity, that defines the rate at which the function approaches the asymptote.
The mechanical parameters for tunnel linings used in this study are shown in Table 2.
Table 2Mechanical parameters of the tunnel linings
Material | Thickness (m) | Elastic modulus (GPa) | Poisson’s ratio | Compressive strength (MPa) | Tensile strength (MPa) | Density (kg m-3) | K |
Shot concrete | 0.24 | 25.5 | 0.20 | 9.6 | 1.1 | 2500 | 2/3 |
Precast concrete | 0.50 | 30.0 | 0.20 | 14.3 | 1.43 | 2500 | 2/3 |
3. Seismic response of the tunnel to near-fault and far-field motions
3.1. Near-fault and far-field ground motions
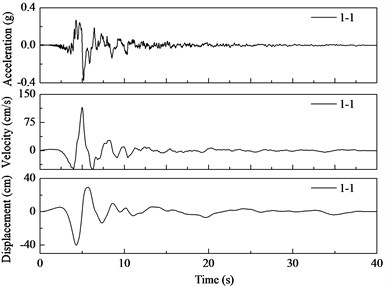
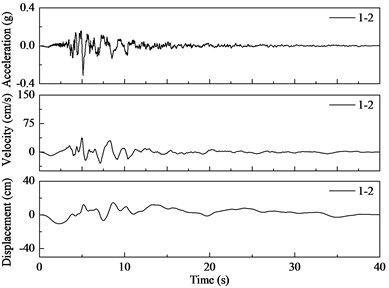
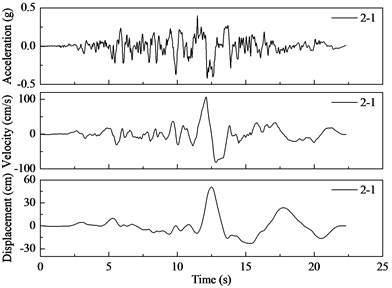
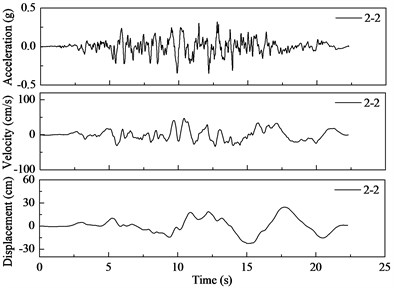
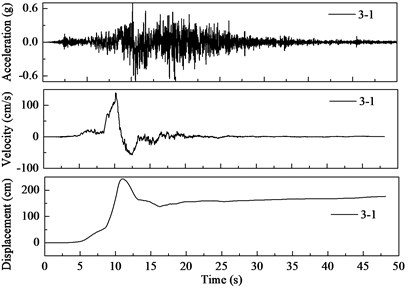
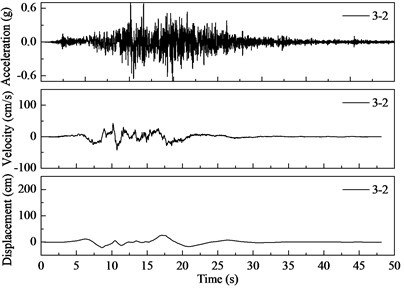
The near field ground motions are usally characterized by long-period pulses, so four pulse-type ground motions (near field) were chosen from the Next Generation Attenuation (NGA) ground motion library (http://peer.berkeley.edu/nga), and the details of these ground motions are shown in Table 3. Meanwhile, the long period pulses were extracted from the four ground motions using the method proposed by Baker [28]. Both the origin and residual ground motions were shown in Fig. 3. It can be seen that the origin ground motions (No. 1-1, 2-1, 3-1, 4-1) present distinct velocity and displacement pulses, but the residual ground motions (No. 1-2, 2-2, 3-2, 4-2) are no longer pulse-type. Thus, the residual non-pulse records were considered as the far-field ground motions. It should be noted that the extraction has little effect on the the peak ground acceleration (PGA). In order to compare the effects of near and far field ground motion on the tunnel, the near and far field ground motions were simulated in the same way mentioned in Section 2.2.
As previous mentioned, forward directivity (FD) and permanent translation are the main causes for the velocity pulses observed in near-fault regions. Generally, pulses from fling effect have different characteristics with FD pulses. Forward directivity effect is a dynamic phenomenon that produces no permanent ground displacement and hence two-sided velocity pulses, whereas fling-step is a result of a permanent ground displacement that generates one-sided velocity pulses. From Fig. 3, it is easy to find that the first two pules (No. 1-1, 2-1) are FD pulses, while the other two pulses are fling pulses.
Table 3Details of the pulse-type ground motions
Number | Event | Year | Station | Mw | Joyner-Boore distance (km) |
1-1 | Imperial Valley-06 | 1979 | EC Meloland overpass FF | 6.53 | 0.07 |
2-1 | Superstition Hills-02 | 1987 | Parachute test site | 6.54 | 0.95 |
3-1 | Landers | 1992 | Lucerne | 7.28 | 2.19 |
4-1 | Imperial Valley-06 | 1979 | Agrarias | 6.53 | 0.00 |
3.2. Response of the tunnel subjected to near-fault and far-field ground motions
Obeservations from recent stronge earthquakes indicate that the main damages suffered by tunnels in rock are concrete cracking, tunnel convergence, and local collapse. Thus, the dynamic increment of the axial force, the energy dissipated in lining by damage, the damaged concrete area of the final lining, and the tunnel convergence were chosen to assess the seismic performance of the tunnel.
3.2.1. Amplification of PGV
The relationship between the PGVtop at the top surface and the PGVbase at the bottom of the weathered layer was shown in Fig. 4. It can be seen that the ratio of the PGVtop to PGVbase is generally between 1 and 2, which agrees with the results from a study by Rodriguez et al. [9].
3.2.2. Energy dissipated in lining by damage
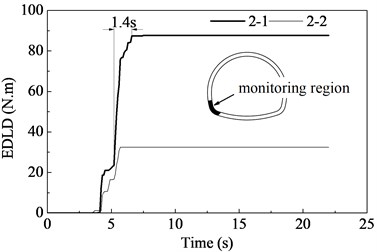
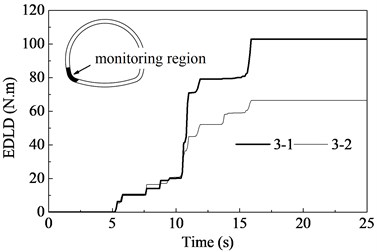
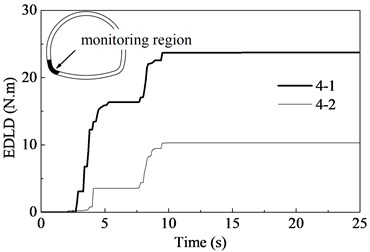
Since the tunnel is subject to unsymmetrical loads at the portal, concrete damages mainly happens at the left side of the invert and the right side of the crown. Hence, the elements located at the left side of the invert (Fig. 5) were chosen to calculate the energy dissipated in lining by damage (EDLD). It can be seen from Fig. 5, the dissipated energy increases slowly at first, and then shows a sharp increase. Finally, the EDLD almost keeps constant. This changing law is similar to that of the ground motion, so the dissipated energy is related to the intensity of the ground motion. Besides, the EDLD is also influenced by the long-period pulses. As shown in Fig. 5, compared with the non-pulse ground motions, pulse-type ground motions bring much more energy, and the dissipated energy has increased by more than 100 %. Although both two types of pulses can bring large amounts of energy, the energy from FD pulses is dissipated in relatively shorter times than that from fling pulses. Consequently, the EDLD due to FD pulses are more intense than that resulting from fling pulses, and the increments of EDLD due FD pulses are larger too.
3.2.3. Axial force in tunnel lining
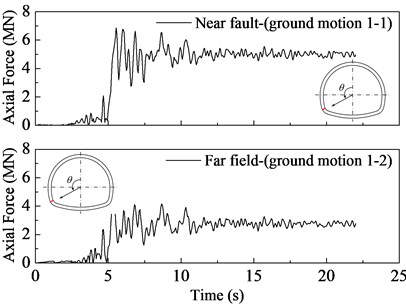
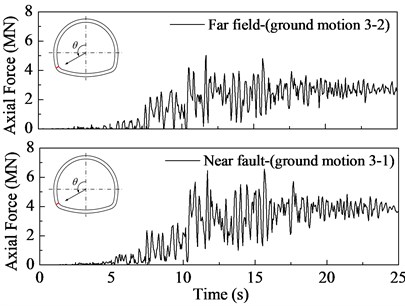
Fig. 6 shows the dynamic increments of the axial forces for the examined cross-section (located at θ= 135°) of the tunnel. From Fig. 6, it appears that failure of the surrounding rock mass brings permanent increment of axial force in tunnel lining. The maximum increase of the axial force is about 7.0 MN when the tunnel is subject to the excitation with FD pulse (No. 1-1), and this value decreases by about 40 % after the pulse is extracted. In contrast, the decrease of the axial force due to the fling pulse is much smaller. The effect of fling pulse on the axial force is much less pronounced.
Fig. 3Acceleration, velocity, and displacement time histories of the origin and residual motions
a) No. 1-1
b) No. 1-2
c) No. 2-1
d) No. 2-2
e) No. 3-1
f) No. 3-2
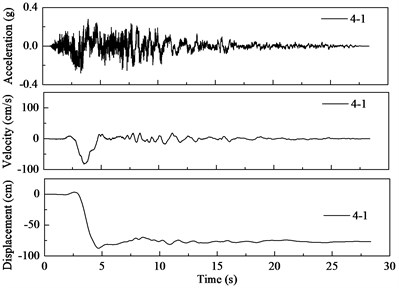
g) No. 4-1
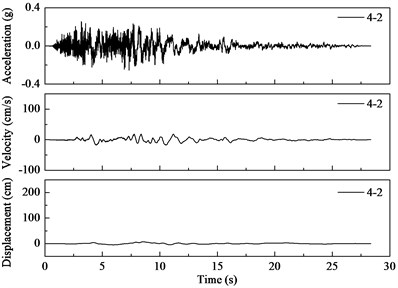
h) No. 4-2
Fig. 4PGV amplification for the weathered rock layer
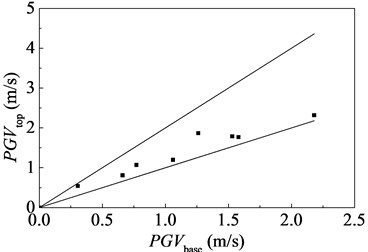
Fig. 5Energy dissipated in tunnel lining by damage
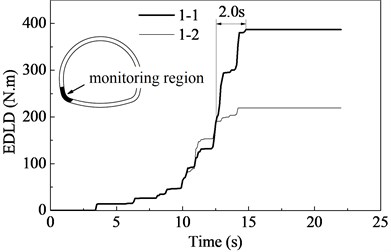
a) No. 1-1 and No. 1-2
b) No. 2-1 and No. 2-2
c) No. 3-1 and No. 3-2
d) No. 4-1 and No. 4-2
Fig. 6Dynamic increment of axial force for the examined cross-section (θ= 135°)
a) Record with FD pulse
b) Record with fling pulse
3.2.4. Convergence of the tunnel
Due to the unsymmetrical loads and poor surrounding rock mass, the tunnel undergoes plastic deformation subjected to earthquake loading. As shown in Fig. 7, the tunnel is elongated between point A and point B, and is compressed between point C and point D. Fig. 7 illustrates the convergences of the tunnel between point A and point B subjected to different ground motions. It can be found that the directivity pulses (No. 1 and No. 2) have a significant effect on the tunnel convergence. The convergence of the tunnel decreases dramatically after the FD pulses were extracted. Compared with FD pulses, the fling pulses (No. 3 and No. 4) have a much smaller influence on the tunnel convergence.
Fig. 7Convergences of the tunnel subjected to pulse-type and non-pulse motions
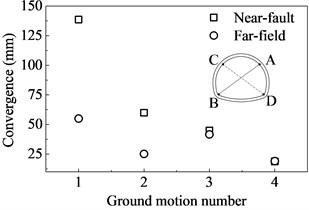
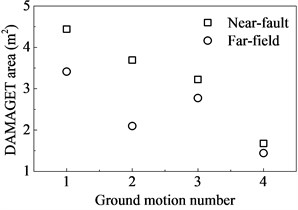
Fig. 8DAMAGET area of the tunnel lining where the tensile damage variable, dt, is greater than 0.5
3.2.5. Damaged concrete area
The concrete is a brittle material, and the cracking in tension is the most common failure mode. Therefore, the area where the tensile damage variable, dt, is greater than 0.5 (DAMAGET area) and the area where the tensile equivalent plastic strain, ˜εplt, is greater than 0.001 (PEEQT area) were chosen to assess the damaging degree of the tunnel lining. The results were shown in Fig. 8 and Fig. 9 respectively. As anticipated, part of the concrete is damaged. For the FD pulses (No. 1, No. 2), when the pulses are extracted from the origin records, the DAMAGET area decreases by more than 20 %, and the PEEQT area decreases by more than 45 %. In contrast, the damaging degree of the tunnel lining is not remarkably influenced by the fling pulses (No. 3 and No. 4).
Fig. 9Area of the tunnel lining where tensile equivalent plastic strain is greater than 0.001
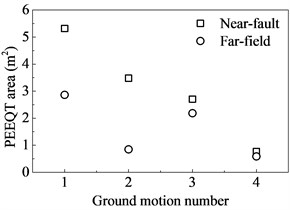
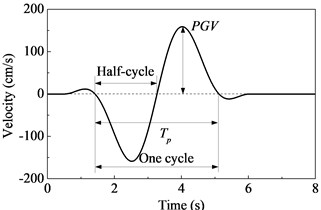
Fig. 10Simplified velocity pulse showing the amplitude (PGV), the period (Tp) and the significant cycles
From the results in Fig. 5-9, the near-fault ground motions with long-period pulses can bring large amounts of energy, and they are more damaging to tunnels than the far-field motions. The duration of the fling pulse is generally longer than that of the FD pulse, and the seismic energy is more compact. As a result, the damaging effect of the FD motions on the tunnel is more pronounced. So the velocity pulse should be also considered to provide a reasonable assessment of the damage potential of near-fault ground motion. However, the current state of practice for seismic design of tunnels is mainly based on the Peak Ground Acceleration (PGA) and response spectrum, which neglects this issue.
4. Parametric studies
In this section, the effects of key parameters for the pulse on the tunnel were investigated through the time-domain approach, which may provide valuable insights to the seismic design for tunnels close to the causative faults.
4.1. Ground motions
The near-fault ground motion can be divided into two parts: the high-frequency content and the long-period pulse. In order to exclude the influence of the high-frequency content on the tunnel, the high-frequency content keeps constant during the following studies.
4.1.1. High frequency content
The velocity pulse was extracted from the motion which was recorded during the 1971 Imperial Valley Earthquake (Table 1 No. 4-1) using the method proposed by Baker [28], and then the residual motion (Fig. 5(h)) is used as the high-frequency content. The PGA of this record is about 0.25 g.
4.1.2. Long-period pulse
According to the previous studies [1, 9, 29], equivalent pulses are capable of representing the salient observed features of the response to near-fault recorded ground motions, and simplified representations of pulse-type motions can be used to study site response to near-fault motion. Hence, the analytical model proposed by Mavroeidis et al. [15] for the velocity pulse was used in this study:
where, A controls the amplitude of the pulse; fp is the frequency of the amplitude-modulated harmonic, and it is related to the duration of the pulse; ν is the phase of the amplitude-modulated harmonic; γ is a parameter that defines the oscillatory character of the signal, and t0 specifies the epoch of the envelope’s peak.
There are three key parameters for a simplified velocity pulse, the amplitude (PGV), the period (Tp), and the significant cycles. These parameters are shown in Fig. 10. According to Mavroeidis et al. [15], the pulse amplitude (PGV) is usually in a large range from several centimeters to hundreds of centimeters. The pulse period is in the range from 0.7 s to 12 s, and the period of the fling pulse is usually larger than that of the FD pulse.
4.2. Effect of the amplitude (PGV)
Fig. 11 shows the pulses with different amplitudes used in this section. The FD pulses are similar to that was recorded at the VCT station during Mexicali Valley earthquake (1980), and they have the same period of 3.7 s. While the fling pulses are similar to that was recorded at the TCU052 station during Chi-Chi earthquake (1999), and they have the same period of 10.0 s.
From Fig. 12, all the axial forces for the examined cross-sections almost show a similar variation trend. The FD pulse with larger amplitude leads to larger strain in surrounding rock, and the axial forces for examined cross-sections increase accordingly. Moreover, as the amplitude of the pulse increases, the increasing rate of the axial force also rises, which means the axial force in tunnel lining is more sensitive to the pulse with large amplitude. Compared with the FD pulses, the fling pulses have a smaller influence on the axial forces in tunnel lining. The axial forces increase very slowly with the increase of the pulse amplitude.
Fig. 11Pulses with different amplitudes
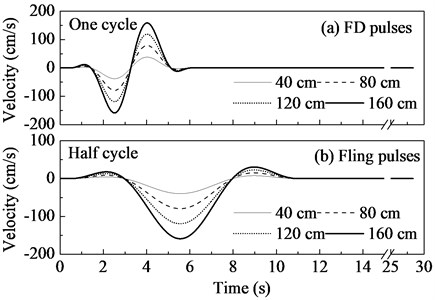
Fig. 12Axial forces for the examined cross-sections versus the pulse amplitude
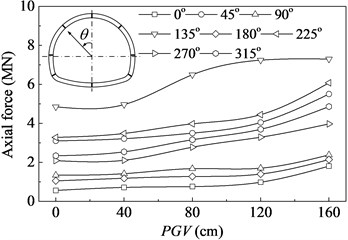
a) FD pulses
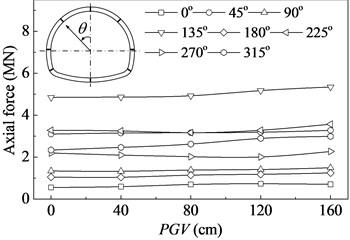
b) Fling pulses
The convergence of the tunnel is shown in Fig. 13. From Fig. 13, the tunnel convergence also shows a remarkable increase as the amplitude of the FD pulse increases. When the amplitude of the FD pulse increases from 0 cm to 160 cm, the convergence has increased by about 300 %. However, the increment of tunnel convergence is only 27 % when the amplitude of the fling pulse increases from 0 cm to 160 cm.
Fig. 13Variation of tunnel convergence with pulse amplitude
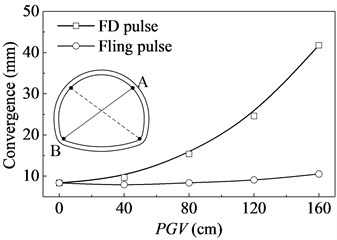
Fig. 14Variation of DAMAGET area with pulse amplitude
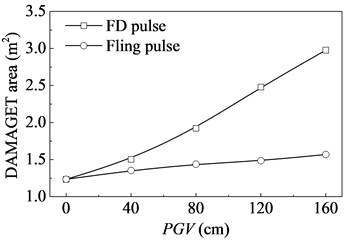
Fig. 14 illustrates the variation of the DAGAGET area with the pulse amplitude. Similar results can be concluded. The DAMAGET area increases by about 140 % when the amplitude of the FD pulse increases from 0 cm to 160 cm. While this area only increases 25 % when the tunnel is subject to the ground motion with fling pulse.
The results (Figs. 12-14) can be explained as follows: For a given period, the pulse with larger amplitude brings more energy, and leads to larger dynamic strain in rock and the tunnel lining. Consequently, the ground motion becomes more damaging to the tunnel. Meanwhile, the duration of the fling pulse is longer than that of the FD pulse. For a given pulse amplitude, the dynamic strain in rock and the tunnel lining due to the fling pulse is smaller than that due to the FD pulse, and the energy from the fling pulse is dissipated in a relatively longer time. Hence, the fling is generally less damaging than the FD pulse.
According to previous studies [9, 11, 19, 20], the pulse amplitude can be influenced by the earthquake magnitude, the nearest distance from the ruptured fault and the site condition, and the nature of the site. Besides, for the tunnels located at the mountainous areas, the effect of local geography on the pulse amplitude should also be taken into account.
4.3. Effect of the period (Tp)
In order to investigate the effect of the pulse period on the dynamic response of the tunnel, seven pulses with different periods (Fig. 15) were superimposed on the high-frequency content. It can be seen that the pulse period is in the range from 0.5 to 8.0 s, and all the pulses have the same amplitude of 80 cm/s.
Fig. 15Pulses with different periods
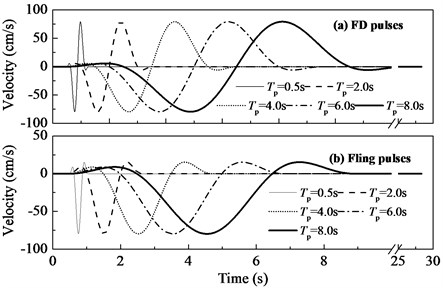
Fig. 16Axial forces for the examined cross-sections versus the pulse period
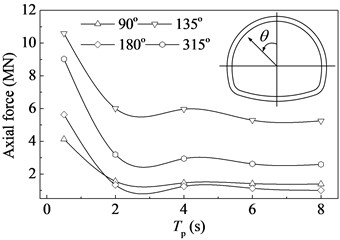
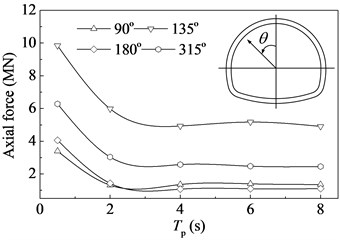
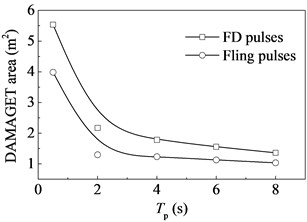
As shown in Fig. 16, as the pulse period increases, the axial forces for the examined cross-sections in tunnel lining first show a sharp decrease and then become stable. The demarcation period is about 3.0 s. From the Fig. 17 and Fig. 18, both the damaged concrete area and the convergence of the tunnel show a similar variation trend. This can be explained as follows: According to the China standard [30], the characteristic period of the site is about 0.25 s which is smaller than that of the pulse. The smaller the period of the pulse is, the closer it gets to the site period. So the effect of the pulse on the tunnel becomes more pronounced. In addition, when the PGV of the pulse is held constant, the pulse with smaller period leads to larger PGA of the synthetic ground motion. The higher PGA levels in input motions with lower pulse periods, which leads to higher strains in the rock, consequently, increased damaging. The results (Figs. 16-18) are consistent with the previous findings [15-18]. From the comparison between FD pulses and fling pulses, it can be found that the two types of pulses have different damaging effects even though they have the same period and amplitude (PGV).
Fig. 17Tunnel convergence versus the period of the pulse
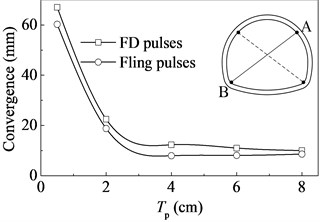
Fig. 18Damaged concrete area versus the period of the pulse
As previously mentioned, the long-period pulse is generally not readily visible in the acceleration trace, and the PGA is a dominant earthquake-resistant parameter for underground structures now. For a given acceleration intensity (PGA=0.25 g), eleven records were synthesized by superimposing eleven pulses with different periods (Fig. 19) on the high-frequency content. Then the response of the tunnel to these ground motions were studied to further investigate the effect of pulse period. All the pulses have one significant cycle. As the period increases, the amplitude of the pulse increases.
Fig. 19Pulses with different periods (for a given PGA = 0.25 g)
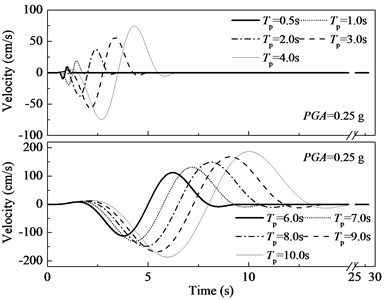
Fig. 20Axial forces in tunnel lining versus the period of the pulse
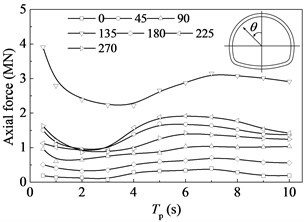
Fig. 21Tunnel convergence versus the period of the pulse
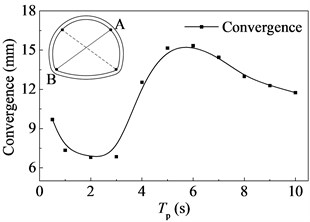
The results are shown in Fig. 20-23. It can be found that the axial forces, the tunnel convergence, the damaged concrete area, and the energy dissipated by damage show a similar variation trend. When the period is less than about 3.0 s, the pulse becomes less damaging with the increase of the period, and the damaging effect of the pulse is mainly influenced by its period. As the pulse period continues to increase, it is much larger than the characteristic period of the site, and the PGV becomes the dominant parameter influencing the damaging effect of the pulse. Thus, the damaging effect of the pulse becomes more pronounced with the increase of the period. Once the period exceeds about 7.0 s, both the period and the PGV of the pulse have little effect on the tunnel.
Fig. 22Damaged concrete area versus the period of the pulse
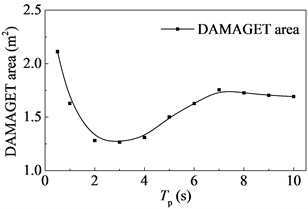
Fig. 23Energy dissipated by damage in monitoring region versus the period of the pulse
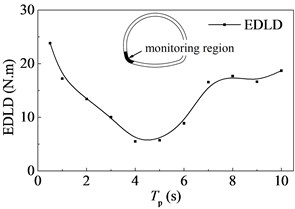
From the results (Figs. 16-18, 20-23), the period of the pulse can significantly influence the dynamic response of the tunnel. The pulses with different periods have different damage potential, even though they have the same intensity (PGA). The earthquake with lower magnitude generally produces lower pulse periods, so it might produce more damages to the tunnel. This effect should be taken into account during seismic design for the tunnels located near the ruptured faults.
4.4. Effect of significant cycles
In addition to the amplitude and the period, the number of significant cycles is another important parameter for the simplified pulse. In order to investigate its effect on dynamic response of the tunnel, four velocity pulses with different cycles were chosen. As shown in Fig. 24, the first pulse (No. 1) is similar to that was recorded at the TCU052 station during Chi-Chi earthquake (1999). The second pulse (No. 2) is similar to that was recorded at the VCT station during Mexicali Valley earthquake (1980). The third pulse (No. 3) is similar to that was recorded at the EMO station during Imperial Valley earthquake (1971). The fourth pulse (No. 4) is similar to that was recorded at the KAR station during Gazli earthquake (1971). As shown in Table 4, four pulses have different numbers of significant cycles. For a given period, the peak ground velocities of pulses are almost equal to one another. While the peak ground displacement (PGD) decreases with the increase of the number of significant cycles.
Table 4Parameters of the pulses with different numbers of significant cycles
Number | Tp (s) | Number of significant cycles | PGA (g) | PGV (cm/s) | Description |
1 | 2 | 0.5 | 0.4 | 100.0 | Fling pulse |
2 | 2 | 1.0 | 0.4 | 99.8 | FD pulse |
3 | 2 | 1.5 | 0.4 | 99.7 | FD pulse |
4 | 2 | 2.0 | 0.4 | 100.0 | FD pulse |
5 | 3 | 0.5 | 0.4 | 141.9 | Fling pulse |
6 | 3 | 1.0 | 0.4 | 134.3 | FD pulse |
7 | 3 | 1.5 | 0.4 | 141.2 | FD pulse |
8 | 3 | 2.0 | 0.4 | 136.5 | FD pulse |
Fig. 24Pulses with different numbers of significant cycles: a) Tp= 2.0 s, b) Tp= 3.0 s
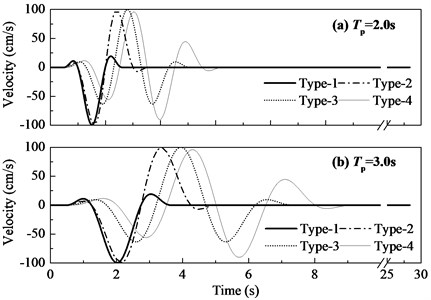
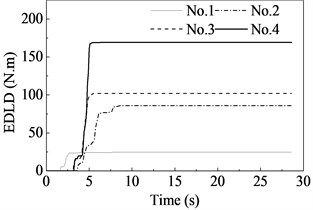
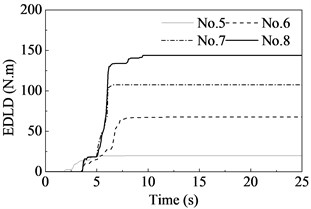
When the period is held constant, the increase of the number of significant cycles in velocity-time history means more pulses are superposed, which leads to larger amounts of energy. It can be found from Fig. 25 that as the number of significant cycles increases, the dissipated energy by damage in tunnel lining shows a remarkable increase. Similarly, the tunnel convergence (Fig. 26) and the DAGAMET area (Fig. 27) also significantly increase. When this number increases from 0.5 to 2.0, the tunnel convergence has increased by more than 180 %, and the DAGAMET area has increased by about 120 %. The ground motion becomes much more damaging to the tunnel.
Fig. 25Variation of the energy dissipated by damage in monitoring region with the number of significant cycles: a) Tp= 2.0 s, b) Tp= 3.0 s
a)
b)
Fig. 26Variation of the tunnel convergence with the number of significant cycles
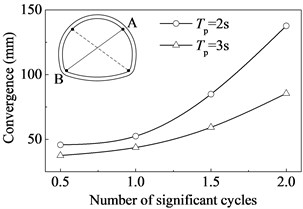
Fig. 27Variation of the DAMAGET area with the number of significant cycles
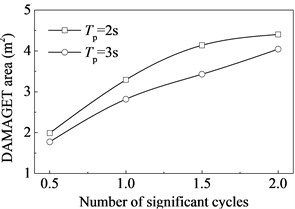
The results (Figs. 25-27) indicate multiple cycles of motion can dramatically increase the damage potential of the ground motions. So the number of significant cycles in velocity-time history is another key element which should be taken into account when designing the tunnel lining. However, the number of significant pulses in a FD motion depends on details of rupture process, such as the number of asperities of the fault and the slip distribution on the causative fault [19]. The details cannot be known a priori, so it is not possible to predict this important parameter through empirical relationships. Fortunately, the near-fault ground motions are most likely to have no more than two significant cycles [14, 15]. Hence, for the sake of the security, two significant cycles are recommended for the seismic design of tunnels close to causative faults.
5. Conclusions
In this paper, the dynamic response of a tunnel in Tibet subjected to near-fault and far-field ground motions was investigated. Furthermore, the effects of the key parameters for the simplified velocity pulse on the tunnel were also studied. The observations drawn from this study are outlined below.
1) The long-period pulse has a significant effect on the tunnel, which makes the near-fault ground motions more damaging to the tunnel than far-field ground motions. Since the duration of the fling pulse is generally longer than that of the FD pulse, the near-fault FD motions are more intense than fling records. As a result, the damaging effect of the FD pulse on the tunnel is more pronounced.
2) For a given pulse period, the pulse with larger amplitude brings more energy and leads to higher strains in rock and the tunnel lining. Consequently, the damage potential of the pulse increases.
3) The period of the pulse can significantly influence the dynamic response of the tunnel close to the ruptured fault. For a given PGV for the pulse, when the period of the pulse is less than 3.0 s, the pulse becomes less damaging to the tunnel with the increase of the pulse period. As the period of the pulse continues to increase, this effect can be negligible. For a given pulse intensity (PGA), when the period of the pulse is less than about 3.0 s, the damaging effect of the pulse is mainly influenced by the period of the pulse. The pulse with larger period brings larger strains in rock and the tunnel lining, which leads to more serious damage to the tunnel. When the period is in the range of 3.0 s to about 7.0 s, the PGV for the pulse becomes the dominant parameter influencing the damaging effect of the pulse. Larger period leads to larger PGV, consequently, the pulse is more damaging. Once the period of the pulse exceeds 7.0 s, the period has little effect on the dynamic response of the tunnel. The earthquake with lower magnitude generally produces lower pulse periods, so it might produce more damages to the tunnel. The pulse period should be determined carefully when designing the tunnel lining.
4) The number of significant cycles is another significant parameter for the pulse affecting the dynamic response of the tunnel. When the PGA and PGV are held constant, as the number of significant cycles increases, the pulse becomes more damaging to the tunnel in spite of the decreasing PGD. Given the number of significant cycles is not possible to be predicted through empirical relationships, and the near-fault ground motions are most likely to have no more than two significant cycles. For the sake of the security, two significant cycles are recommended.
It can be seen from the observations drawn from this study that pulse-type motions are critical in the design of tunnels close to the faults. However, the current state of practice for seismic design of tunnels is mainly based on the Peak Ground Acceleration (PGA) and response spectrum, which cannot adequately reflect the near-source pulse hazards. Therefore, special design code for tunnels close to ruptured faults is needed. The conclusions from this study may provide valuable insights to practice and development of design guideline for tunnels near causative faults. They may be also used by tunnel engineers to arrive at a more sound and economical design of tunnels located near active faults.
References
-
Mollaioli F., Bruno S., Decanini L. D., Panza G. F. Characterization of the dynamic response of structures to damaging pulse-type near-fault ground motions. Meccanica, Vol. 41, Issue 1, 2006, p. 23-46.
-
Somerville P. G., Smith N. F., Graves R. W., Abrahamson N. A. Modification of empirical strong ground motion attenuation relations to include the amplitude and duration effects of rupture directivity. Seismological Research Letters, Vol. 68, Issue 1, 1997, p. 199-222.
-
Hayden C. P., Bray J. D., Abrahamson N. A., Acevedo-Cabrera A. L. Selection of near-fault pulse motions for use in design. 15th World Conference on Earthquake Engineering, 2012.
-
Shahi S. K., Baker J. W. An empirically calibrated framework for including the effects of near-fault directivity in probabilistic seismic hazard analysis. Bulletin of the Seismological Society of America, Vol. 101, Issue 2, 2011, p. 742-755.
-
Hossein Tahghighi Earthquake fault-induced surface rupture – A hybrid strong ground motion simulation technique and discussion for structural design. Earthquake Engineering and Structural Dynamics, Vol.40, Issue 14, 2011, p. 1591-1608.
-
Vaez S. H., Sharbatdar M. K., Amiri G. G., Naderpour H., Kheyroddin A. Dominant pulse simulation of near fault ground motions. Earthquake Engineering and Engineering Vibration, Vol. 12, Issue 2, 2013, p. 267-278.
-
Mukhopadhyay S., Gupta V. K. Directivity pulses in near-fault ground motions-I: Identification, extraction and modeling. Soil Dynamics and Earthquake Engineering, Vol. 50, 2013, p. 1-15.
-
Ucak A., Mavroeidis G. P., Tsopelas P. Behavior of a seismically isolated bridge crossing a fault rupture zone. Soil Dynamics and Earthquake Engineering, Vol. 57, 2014, p. 164-178.
-
Rodriguez-Marek A., Bray J. D. Seismic site response for near-fault forward directivity ground motions. Journal of Geotechnical and Geoenvironmental Engineering, Vol. 132, Issue 12, 2006, p. 1611-1620.
-
Zhang S., Wang G. Effects of near-fault and far-fault ground motions on nonlinear dynamic response and seismic damage of concrete gravity dams. Soil Dynamics and Earthquake Engineering, Vol. 53, 2013, p. 217-229.
-
Kalkan E., Kunnath S. K. Effects of fling step and forward directivity on seismic response of buildings. Earthquake Spectra, Vol. 22, Issue 2, 2006, p. 367-390.
-
Sehhati R., Rodriguez-Marek A., ElGawady M., Cofer W. F. Effects of near-fault ground motions and equivalent pulses on multi-story structures. Engineering Structures, Vol. 33, Issue 3, 2011, p. 767-779.
-
Corigliano M., Scandella L., Lai C. G., Paolucci R. Seismic analysis of deep tunnels in near fault conditions: a case study in Southern Italy. Bulletin of Earthquake Engineering, Vol. 9, Issue 4, 2011, p. 975-995.
-
Bray J. D., Rodriguez-Marek A., Gillie J. L. Design ground motions near active faults. Bulletin of the New Zealand Society for Earthquake Engineering, Vol. 42, Issue 1, 2009, p. 1-8.
-
Mavroeidis G. P., Papageorgiou A. S. A mathematical representation of near-fault ground motions. Bulletin of the Seismological Society of America, Vol. 93, Issue 3, 2003, p. 1099-1131.
-
Somerville P. G. Magnitude scaling of the near fault rupture directivity pulse. Physics of the earth and planetary interiors, Vol. 137, Issue 1, 2003, p. 201-212.
-
Bray J. D., Rodriguez-Marek A. Characterization of forward-directivity ground motions in the near-fault region. Soil Dynamics and Earthquake Engineering, Vol. 24, Issue 11, 2004, p. 815-828.
-
Farid Ghahari S., Jahankhah H., Ghannad M. A. Study on elastic response of structures to near-fault ground motions through record decomposition. Soil Dynamics and Earthquake Engineering, Vol. 30, Issue 7, 2010, p. 536-546.
-
Somerville P. G. Development of an improved representation of near fault ground motions. Proceedings of the SMIP98 Seminar on Utilization of Strong Ground Motion Data, California Division of Mines and Geology, Sacramento, 1998, p. 1-20.
-
Joyner W. B., Boore D. M. Peak horizontal acceleration and velocity from strong motion records including records from the 1979 Imperial Valley, California, earthquake. Bulletin of the Seismological Society of America, Vol. 71, Issue 6, 1987, p. 2011-2038.
-
Mena B., Mai P. M. Selection and quantification of near-fault velocity pulses owing to source directivity. Georisk, Vol. 5, Issue 1, 2011, p. 25-43.
-
Geniş M. Assessment of the dynamic stability of the portals of the Dorukhan tunnel using numerical analysis. International Journal of Rock Mechanics and Mining Sciences, Vol. 47, Issue 8, 2010, p. 1231-1241.
-
Ministry of Transport of the People’s Republic of China. Code for design of road tunnel, JTG D70-2004. China Architecture and Building Press, Beijing, 2004, (in Chinese).
-
Ministry of Housing and Urban-Rural Development of the People’s Republic of China. Code for design of concrete structures, GB 50010-2002. China Architecture and Building Press, Beijing, 2002, (in Chinese).
-
Hillerborg A., Modéer M., Petersson P. E. Analysis of crack formation and crack growth in concrete by means of fracture mechanics and finite elements. Cement and Concrete Research, Vol. 6, Issue 6, 1976, p. 773-781.
-
Lee J., Fenves G. L. Plastic-damage model for cyclic loading of concrete structures. Journal of Engineering Mechanics, Vol. 124, Issue 8, 1998, p. 892-900.
-
Lubliner J., Oliver J., Oller S., Onate E. A plastic-damage model for concrete. International Journal of Solids and Structures, Vol. 25, Issue 3, 1989, p. 299-326.
-
Baker J. W. Quantitative classification of near-fault ground motions using wavelet analysis. Bulletin of the Seismological Society of America, Vol. 97, Issue 5, 2007, p. 1486-1501.
-
Alavi B., Krawinkler H. Consideration of near-fault ground motion effects in seismic design. Proceedings of the 12th World Conference on Earthquake Engineering, 2000.
-
Ministry of Housing and Urban-Rural Development of the People’s Republic of China. Code for seismic design of buildings, GB 50011-2010. China Architecture and Building Press, Beijing, 2010, (in Chinese).
About this article
This work was financially supported by the National Natural Science Foundation of China (Grant No. 51409245) and the 973 Program of China (Grant No. 2015CB057900).
