Abstract
Roller bearings are widely used elements in rotary machines. How to monitor the working conditions of roller bearings are focus study in the world. Monitoring the vibration signals of roller bearings is important indirect mean for that they reveal the characteristics and feature of roller bearing faults. Therefore, monitor the vibration signals and diagnose the working states of roller bearings are widely used to ensure the safety operation of the machines. This paper studies a novel roller bearing faults discrimination method with harmonic wavelet packet and Multi-classification Relevance Vector Machine (MRVM). Indeed, the fault discrimination is a pattern recognition process including feature extraction and faulty patterns recognition. Therefore, this paper collects vibration signals and decomposes them with harmonic wavelet packet. After the wavelet coefficients of each node are available, compute the vector energy by corresponding coefficients. The feature vector is prepared after the vector energy has been standardized. With MRVM, the paper proposes three fault discrimination methods in order to identify good bearing, bearing with inner race fault, bearing with outer race fault and bearing with roller fault. The Decision Tree (DT) model, One Against Rest (OAR) model and One Against One (OAO) model are used to propose the classification methods respectively. The proposed OAO model is simplified in order to improve the computation efficiency and simplify the architecture of the model. Finally, capture the vibration signal from the roller bearing stand of electric engineering lab and the roller bearing fault simulation stand QPZZ-II to illustrate the proposed methods. The proposed feature extraction method with harmonic wavelet packet is compared with conventional wavelet packet. With the previous feature vectors, the accuracy and efficiency of the three fault discrimination methods are compared. The accuracy and efficiency of three fault discrimination methods are compared under different conditions including developing faults, noise involving and several faults developing simultaneously. Experiment results show that the proposed feature extraction method is more effective than conventional method and the simplified OAO-RVM model possess the best fault discrimination accuracy and DT-RVM model possesses the better computation efficiency.
1. Introduction
Roller substitutes sliding friction between the shaft and the shaft holder by rolling friction to reduce friction losses. As a precise component, rolling shaft is widely used in rotating machine. Its working condition directly affects the performance and safety of the machine. Once roller bearing fault occurs, serious results may emerge. Hence, studying fault discrimination method target towards roller bearing faults is very meaningful.
Vibration signals are widely used in condition monitoring for the roller bearings. By comparing the signals in normal condition and the signals in faulty condition, discriminating the roller bearing fault is possible. Many researchers around the world study time-frequency method to extract feature from vibration signals for the roller bearing vibration signals’ non-stationary characteristics. Because the Hilbert-Huang transform could implement the adaptive time-frequency domain analysis, literature [1-3] process roller vibration signals to extract faulty feature with Empirical Mode Decomposition (EMD). Compared with EMD, wavelet transform also possesses good performance for time-frequency domain analysis. Therefore, morphological wavelet is used to extract energy feature from roller bearing vibration signals [4]. Furthermore, harmonic wavelet transform possesses better filter performance compared with conventional wavelet transform when decompose signals into interested time-frequency domain. Meanwhile, the signals after transformation possesses the same resolution as the original signals so as to overcome the limitation of Mallat algorithm in conventional wavelet transform [4]. The time-frequency profile of harmonic wavelet is performed to analyze the signals of gear fault for harmonic wavelet analysis is effective to extract the singular components in the non-stationary signals [5]. Without arbitrarily selected band, the harmonic wavelet analysis band will gradually tend to lower frequency or higher frequency with the increase of harmonic wavelet decomposition level. However, harmonic wavelet packet overcomes the preceding limitation for it can adaptively subdivide the whole interested band and is the better tool to extract interested feature from the roller bearing vibration signals. Therefore, literature [6, 7] use harmonic wavelet packet to decompose roller bearing signals into different frequency domain and compute energy to form the feature vector.
Because the roller bearing fault diagnosis is the process of pattern recognition, a multiple classifier is necessary to discriminate the faults after the feature vectors are available. With Back Propagation (BP) neural network, literature [6] establishes a multiple classifier to implement roller bearing faults recognition for neural network possesses the better performance of nonlinear mapping. Literature [8, 9] establish the fuzzy classifier to diagnose the roller bearing faults after the necessary rule set is obtained by intuition and domain knowledge. If only a smaller number of samples are available, Support Vector Machine (SVM) possesses the better nonlinear mapping performance. Based on decision tree architecture, a multiple SVMs classifier is proposed to diagnose roller bearing faults [3, 7]. For the purpose of classifying efficiently, Proximal Support Vector Machine (PSVM) is used to discriminate good bearing, bearing with inner race fault, bearing with outer race fault, and inner and outer race fault [10, 11]. Just the same as SVM, Relevance Vector Machine (RVM) projects the nonlinear mapping in low-dimensional space into the linear mapping in high-dimensional space. As RVM’s training process is within Bays architecture, it removes the irrelevant points with Automation Relevance Decision (ARD) principle premising a priori parameters to achieve sparse model [12, 13]. Meanwhile, RVM overcomes such limitations of SVM as error parameters determination, model sparse and kernel function satisfying Mercer condition. Therefore, RVM possesses similar or better accuracy for regression prediction, classification and identification compared with conventional SVM model.
This paper proposes the roller bearing fault extraction method with harmonic wavelet packet. Then, three novel faults discrimination methods are proposed with MRVM including Decision-Tree architecture, One-Against-Rest architecture and One-Against-One architecture for the purpose of identifying good bearing, bearing with inner race fault, bearing with outer race fault, bearing with roller fault and bearing with roller fault and outer race fault simultaneously.
2. Feature extraction with harmonic wavelet packet
Newland proposes harmonic wavelet from the spectrum of wavelet packet and creates a novel wavelet formation approach [14]. As a kind of complex spectrum wavelet with box-shape, harmonic wavelet’s expression in frequency domain is:
where m and n determine the wavelet transform level just the same as j from 2-j in the binary wavelet. Harmonic wavelet possesses better locking phase and filter performances for that it is a complex wavelet with real part and imaginary part compared with the conventional binary wavelet. Its transformation reserves the interested frequencies while shields other frequencies [15]. However, harmonic wavelet analysis cannot arbitrarily choose interested frequency without infinite subdivision performance. Based on the idea of binary wavelet packet, adaptive and infinite subdivision may satisfy this requirement. Suppose interested frequency band is B=2-jfh, in which fh is the high frequency and:
Therefore, any decomposition layer can be subdivided to achieve the interested frequency band. The frequency analysis result with harmonic wavelet packet is shown in Fig. 1.
Fig. 1Harmonic wavelet packet distribution in the frequency domain

Fig. 1 presents the idea that the signals can be decomposed into specified layer corresponding to the interested frequency after m and n get the specified value.
2.1. Process of harmonic wavelet packet decomposition
The process of harmonic wavelet packet decomposition is shown in detail as below [16].
1) Specify the decomposition layer and frequency band of the interested frequency based on the analysis band and the frequency domain. So, specify the decomposition layer and frequency band with B=2-jfh and Eq. (3) firstly:
2) Achieve the frequency representation of harmonic wavelet as Eq. (4):
3) Based on the FFT of the discrete vibration signal fd(r), achieve he frequency discrete representation ˆfd(ω).
4) Base on the specified frequency band, compute the wavelet transform from Eq. (5):
If needed, reverse FFT from Eq. (5) will achieve the signal in time domain after harmonic wavelet packet decomposition.
2.2. Extracting feature with harmonic wavelet packet
With harmonic wavelet packet, conventional feature extraction method standardizes the testing signals in order to eliminate the effects from different units. The standardizing process is described as Eq. (6):
where the sum function computes the sum of X and σ indicates the standard deviation of X. However, conventional standardization method is not appropriate for vibration signal for the contradiction of vibration signals between positive signal and negative signal. As this contradiction, the conventional method results that the sum of vibration signals approaches zero. Therefore, this paper improves the standardization method. Firstly, compute the sum of square of wavelet coefficients in each frequency domain. Secondly, compute the square root of the sum. Finally, the feature vectors are achieved after the square root has been standardized. The detail process of feature extraction method with harmonic wavelet packet is described as below.
1) With harmonic wavelet packet, decompose roller bearing vibration signals into multiple scales and achieve coefficients from each scale.
2) Based on the coefficients from each scale, compute the energy feature with Eq. (7):
where N indicates the number of frequency bands after decomposition and M indicates the number of wavelet coefficients in each band.
3) Standardize the energy of wavelet coefficients with Eq. (8):
where the function mean is the average function which computes the average energy of each band. Dσ indicates the standard deviation of the energy of each band.
4) Finally, the standard fault features are described with Eq. (9):
3. Multi-fault discriminating method with MRVM
Tipping M. E. proposes Relevance Vector Machine (RVM) based on Sparse Bayesian learning theory, which ensures sparse performance by assigning eigenvector with zero mean Gaussian prior distribution after introducing ultra-parameter [12, 13]. By the maximizing edge likelihood function, RVM estimates ultra-parameter and automatically adjusts the rule coefficients in the process of ultra-parameter estimation [17]. Besides those good performances like Support Vector Machine (SVM), RVM overcomes intrinsic limitation of SVM such as the Mercer condition [18, 19]. Meanwhile, RVM improves the computation efficiency significantly compared with SVM.
This paper considers four bearing states including good bearing, bearing with inner race fault, bearing with roller fault and bearing with outer race fault. The situation when the roller fault and outer race fault are simultaneously developing is also considered in this paper. Based on the idea of Multi-classification Support Vector Machine (MSVM), this paper proposes Decision Tree RVM model, One-Against-Rest RVM model and One-Against-One model for the purpose of discriminating the roller bearing states. To improve the computation efficiency and simplify the architecture, this paper proposes an improved One-Against-One model.
3.1. Decision tree model with RVM
This paper proposes Decision Tree model with RVM from the idea of DT-SVM model in literature [7]. Suppose the classification number is k, the principle of Decision Tree (DT) is to establish k- 1 two-classifications. The target output of ith classification is 1 for the ith samples, is 0 for the rest (i+1)th samples, (i+2)th samples,…, kth samples. And the target output of (i+1)th classification is 1 for the (i+1)th samples, is 0 for the rest (i+2)th samples, (i+3)th samples,…, kth samples, and so on. After the process of one classification, the number of classes decreases until all classes have been classified. With DT RVM, the proposed DT model for roller bearing state discrimination is shown in Fig. 2 when considering good bearing, bearing with inner race fault, bearing with roller fault and bearing with outer race fault.
Fig. 2Decision Tree discrimination model with RVM

In the process of classification, DT model discriminates the good bearing firstly because it is easy to classify the good bearing and the faulty bearing. Then, it discriminates the bearing with roller fault which is different from the bearing with race fault. Finally, it discriminates the bearing with inner race fault and the bearing with outer race fault.
Fig. 3OAR discrimination model with RVM
3.2. One-Against-Rest model with RVM
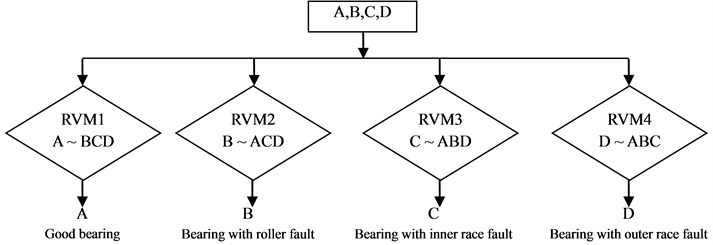
Just as the model with SVM in literature [20], this paper proposes One-Against-Rest (OAR) model with RVM. Suppose the classification number is k, the principle of OAR model is to establish k two-classifications. The target output of the ith classification is 1 for the ith samples, is 0 for the rest samples including the first samples, the second samples,…, (i- 1)th samples, (i+ 1)th samples, (i+ 2)th samples,…, kth samples. This paper proposes the roller bearing discrimination method with OAR model which is shown in Fig. 3 when considering good bearing, bearing with inner race fault, bearing with roller fault and bearing with outer race fault.
Suppose four classes A, B, C and D corresponding good bearing, bearing with roller fault, bearing with inner race fault and bearing with outer race fault. Therefore, the RVM1 classification discriminates the good bearing against rest, the RVM2 classification discriminates the bearing with roller fault against rest, the RVM3 classification discriminates the bearing with inner race fault against rest and the RVM4 classification discriminates the bearing with outer race fault against rest.
3.3. One-Against-One model with RVM
This paper proposes One-Against-One model with RVM as the SVM model described in literature [21]. When supposing the classification number is k, the One-Against-One (OAO) establishes [k(k+1)]/2 two-classifications to discriminate one state against each one of the other states. Therefore, every two-classification is trained by the corresponding feature samples with less repetition training compared with the DT model and the OAR model. For the testing feature samples, each sample is discriminated by [k(k+1)]/2 two-classifications. If it belongs to the ith class, the voting number of the ith class pluses 1. Until every two-classification finishes voting, the maximal voting number indicates the corresponding state. The proposed OAO model is shown in Fig. 4 when considering good bearing, bearing with inner race fault, bearing with roller fault and bearing with outer race fault.
Fig. 4OAO discrimination model with RVM

Fig. 5Improved OAO discrimination model with RVM
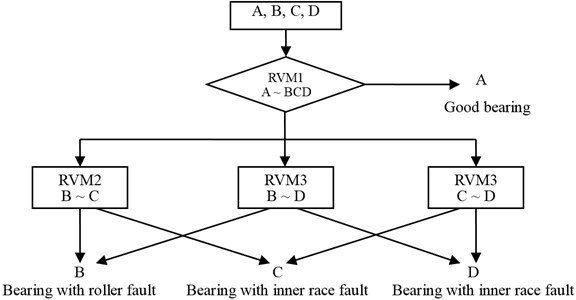
After the process of OAO RVM model, the voting results determine the state that the sample belongs to. Yet, the RVM classification number significantly increases with the number of states considered. To simplify the architecture of OAO model and improve the computation efficiency, this paper incorporates OAO and OAR to propose the improved OAO model which is shown in Fig. 5.
Where only four two-classifications left compared with the conventional OAO-RVM mode. Based on the improved OAR-RVM model, the first two-classification discriminates the good bearing. Then, three two-classifications discriminate the bearing state based on the voting results. Therefore, the number of voting classifications is 3 which is less than the number of conventional OAO model. With the increasing of the classification number, the number of voting classifications will significantly decrease.
4. Experimental result
To verify the effectiveness of the proposed roller bearing fault discrimination method, the vibration signals are acquired from electrical engineering lab of the rolling bearing fault simulation in Case Western Reserve University [22]. Single point faults have been introduced into the SKF bearings with fault diameters of 7 mils, 14 mils, 21 mils. At 12,000 samples per second, vibration signals are collected using a 16 channel DAT recorder and have been post processed in a Matlab environment. Therefore, all data files are in Matlab (*.mat) format. Among these vibration signals, four waveforms are shown in Fig. 6 corresponding to the good bearing, the bearing with roller fault, the bearing with inner race fault and the bearing with outer race fault while fault diameter is 7 mils at 1797 RPM.
Fig. 6Waveforms from different bearing

a) Good bearing

b) Bearing with inner race fault

c) Bearing with roller fault

d) Bearing with outer race fault
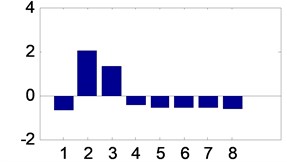
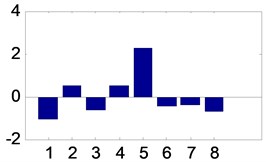
For one bearing state, this paper collects 1024×100 groups. After the vibration signals have been decomposed into three layers with harmonic wavelet packet, the 8×100 vectors are prepared based on the process in Section 2.1. Together, 8×400 vectors are prepared after each bearing feature has been extracted. Among them, the former 8×50 vectors of each bearing state are used to train the proposed models and the latter 8×50 vectors of each bearing state are used to test the proposed models. Four vectors are shown in Fig. 7 corresponding the four roller bearing sates.
Fig. 7Energy distribution after feature extraction
a) Vector from good bearing
b) Vector from bearing with roller fault
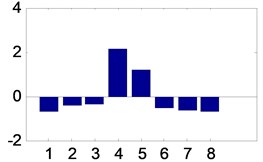
c) Vector from bearing with inner race fault
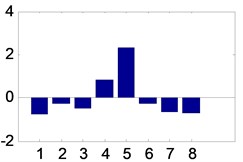
d) Vector from bearing with outer race fault
4.1. Fault identification comparisons of the proposed methods
To compare the performance of feature extraction, the comparisons between harmonic wavelet packet and wavelet packet are shown in Table 1, Table 2 and Table 3. With wavelet packet, 8×100 vectors have been achieved after three layer decomposition based on the wavelet function db10. And the accuracy and time-consuming of each model are shown in the tables, too. Here, Table 1, Table 2 and Table 3 present the comparisons when fault diameters are 7 mils, 14 mils 21 miles respectively.
From the comparison results, the feature extraction with harmonic wavelet packet is better than wavelet packet because the former’s accuracy is always greater than the latter.
Table 1Comparison results when fault diameter is 7 mils
Rotation speed (RPM) | Signals | Sample rate (K) | OAO-RVM accuracy time-consuming (S) | DT-RVM accuracy time-consuming (S) | OAR-RVM accuracy time-consuming (S) |
1797 | X097_DE_time X105_DE_time X118_DE_time X130_DE_time | 12 | HP 100 % 0.26 WP 99 % 0.33 | HP 100 % 0.27 WP 100 % 0.32 | HP 99.5 % 0.32 WP 99.5 % 0.37 |
1772 | X098_DE_time X106_DE_time X119_DE_time X131_DE_time | 12 | HP 100 % 0.33 WP 99.5 % 0.37 | HP 100 % 0.32 WP 100 % 0.31 | HP 100 % 0.32 WP 98 % 0.37 |
1750 | X099_DE_time X107_DE_time X120_DE_time X132_DE_time | 12 | HP 100 % 0.27 WP 100 % 0.27 | HP 100 % 0.26 WP 99 % 0.29 | HP 100 % 0.33 WP 97 % 0.34 |
1730 | X100_DE_time X108_DE_time X121_DE_time X133_DE_time | 12 | HP 100 % 0.27 WP 100 % 0.26 | HP 100 % 0.27 WP 100 % 0.26 | HP 100 % 0.40 WP 100 % 0.26 |
* HP: harmonic wavelet packet * WP: wavelet packet | |||||
Table 2Comparison results when fault diameter is 14 mils
Rotation speed (RPM) | Signals | Sample rate (K) | OAO-RVM accuracy time-consuming (S) | DT-RVM accuracy time-consuming (S) | OAR-RVM accuracy time-consuming (S) |
1797 | X097_DE_time X169_DE_time X185_DE_time X197_DE_time | 12 | HP 100 % 0.30 WP 100 % 0.26 | HP 100 % 0.32 WP 100 % 0.27 | HP 100 % 0.36 WP 100 % 0.33 |
1772 | X098_DE_time X170_DE_time X186_DE_time X198_DE_time | 12 | HP 100 % 0.27 WP 99.5 % 0.27 | HP 100 % 0.26 WP 99.5 % 0.26 | HP 100 % 0.41 WP 99.5 % 0.26 |
1750 | X099_DE_time X171_DE_time X187_DE_time X199_DE_time | 12 | HP 100 % 0.27 WP 100 % 0.28 | HP 100 % 0.27 WP 100 % 0.28 | HP 100 % 0.32 WP 100 % 0.30 |
1730 | X100_DE_time X172_DE_time X188_DE_time X200_DE_time | 12 | HP 100 % 0.27 WP 99.5 % 0.26 | HP 100 % 0.28 WP 100 % 0.28 | HP 100 % 0.36 WP 97.5 % 0.35 |
Table 3Comparison results when fault diameter is 21 mils
Rotation speed (RPM) | Signals | Sample rate (K) | OAO-RVM accuracy time-consuming (S) | DT-RVM accuracy time-consuming (S) | OAR-RVM accuracy time-consuming (S) |
1797 | X097_DE_time X209_DE_time X222_DE_time X234_DE_time | 12 | HP 100 % 0.28 WP 99 % 0.38 | HP 100 % 0.27 WP 99.5 % 0.36 | HP 100 % 0.36 WP 98.5 % 9 |
1772 | X098_DE_time X210_DE_time X223_DE_time X235_DE_time | 12 | HP 100 % 0.26 WP 100 % 0.27 | HP 100 % 0.27 WP 98 % 0.28 | HP 100 % 0.27 WP 100 % 0.29 |
1750 | X099_DE_time X211_DE_time X224_DE_time X236_DE_time | 12 | HP 100 % 0.31 WP 100 % 0.31 | HP 100 % 0.33 WP 100 % 0.32 | HP 100 % 0.36 WP 100 % 0.34 |
1730 | X100_DE_time X212_DE_time X225_DE_time X237_DE_time | 12 | HP 100 % 0.31 WP 100 % 0.30 | HP 100 % 0.27 WP 100 % 0.33 | HP 100 % 0.34 WP 100 % 0.35 |
4.2. Developing fault identification comparisons of the proposed methods
Because the situation in a real life monitoring process is that faults develop gradually, it is meaningful to test the sensitivity of the proposed method and determine how early it can detect the developing fault. The discrimination model is trained with the dataset while fault diameter is 21 mils, and then tested with dataset while fault diameters are 7 mils and 14 mils respectively. The comparison results from three RVM methods are shown in Table 4 and Table 5 when the harmonic wavelet packet extracts fault features from vibration signals.
From Table 4 and Table 5, the proposed methods can identify fault patterns with lower accuracy while training the models with dataset of larger fault diameter and testing the models with dataset of smaller fault diameters. OAO-RVM model improves the rate of accurately classifying when rotation speeds are 1750 RPM and 1730 RPM. DT-RVM model improves the rate of accurately classifying when rotation speed is 1797 RPM. OAR-RVM model improves the rate of accurately classifying when rotation speed is 1730 RPM. And the accuracy of the OAR-RVM model is higher than that of OAO-RVM model and DT-RVM model.
Table 4Comparison results while training with 21 mils fault diameter and testing with 7 mils fault diameter
Rotation speed (RPM) | Training signals (fault diameter 21 mils) | Testing signal (fault diameter 7 mils) | OAO-RVM accuracy time-consuming (S) | DT-RVM accuracy time-consuming (S) | OAR-RVM accuracy time-consuming (S) |
1797 | X097_DE_time X209_DE_time X222_DE_time X234_DE_time | X097_DE_time X105_DE_time X118_DE_time X156_DE_time | 71.4 % 0.27 | 68.22 % 0.26 | 81.13 % 0.27 |
1772 | X098_DE_time X210_DE_time X223_DE_time X235_DE_time | X098_DE_time X106_DE_time X119_DE_time X131_DE_time | 70.40 % 0.25 | 68.67 % 0.23 | 74.63 % 0.29 |
1750 | X099_DE_time X211_DE_time X224_DE_time X236_DE_time | X099_DE_time X107_DE_time X120_DE_time X132_DE_time | 58.60 % 0.27 | 66.89 % 0.26 | 69.00 % 0.29 |
1730 | X100_DE_time X212_DE_time X225_DE_time X237_DE_time | X100_DE_time X108_DE_time X121_DE_time X133_DE_time | 70.40 % 0.26 | 84.00 % 0.26 | 76.12 % 0.30 |
Table 5Comparison results while training with 21 mils fault diameter and testing with 14 mils fault diameter
Rotation speed (RPM) | Training signals (fault diameter 21 mils) | Testing signal (fault diameter 7 mils) | OAO-RVM accuracy time-consuming (S) | DT-RVM accuracy time-consuming (S) | OAR-RVM accuracy time-consuming (S) |
1797 | X097_DE_time X209_DE_time X222_DE_time X234_DE_time | X097_DE_time X105_DE_time X118_DE_time X156_DE_time | 69.40 % 0.26 | 77.33 % 0.26 | 80.75 % 0.27 |
1772 | X098_DE_time X210_DE_time X223_DE_time X235_DE_time | X098_DE_time X170_DE_time X186_DE_time X198_DE_time | 67.20 % 0.24 | 64 % 0.23 | 65.13 % 0.29 |
1750 | X099_DE_time X211_DE_time X224_DE_time X236_DE_time | X099_DE_time X171_DE_time X187_DE_time X199_DE_time | 65.40 % 0.27 | 65.78 % 0.27 | 71.62 % 0.29 |
1730 | X100_DE_time X212_DE_time X225_DE_time X237_DE_time | X100_DE_time X172_DE_time X188_DE_time X200_DE_time | 71.60 % 0.27 | 65.78 % 0.27 | 73.75 % 0.30 |
4.3. Fault identification comparisons of the proposed methods when noise involved
Because the situation is much more complex in real life situations, lots of external noise and parasitic vibration sources may be involved into the vibration signals. This paper also consider such cases while noise involved into the vibration signals. Based on the data set of 21 mils fault diameter, the performances of the proposed methods are compared in Table 6 and Table 7 when different SNR (Signal-Noise-Ratio) is considered.
When SNR is 10 dB, the rates of accurately classifying by OAO-RVM and DT-RVM are always greater than 97 %, the rate of accurately classifying by OAR-RVM is always greater than 92 %. When SNR is 5 dB, the rate of accurately classifying by OAO-RVM and DT-RVM are always greater than 93 %, the rate of accurately classifying by OAR-RVM is always greater than 87 %. From the comparison results, three methods show good performances when noise involved.
Table 6Comparison results when SNR is 10 dB
Rotation speed (RPM) | Training signals (fault diameter 21 mils) | SNR | OAO-RVM accuracy time-consuming (S) | DT-RVM accuracy time-consuming (S) | OAR-RVM accuracy time-consuming (S) |
1797 | X097_DE_time X209_DE_time X222_DE_time X234_DE_time | 10 dB | 98.20 % 0.30 | 98.00 % 0.31 | 94.38 0.34 |
1772 | X098_DE_time X210_DE_time X223_DE_time X235_DE_time | 10 dB | 99.40 % 0.30 | 99.33 % 0.29 | 93.88 % 0.31 |
1750 | X099_DE_time X211_DE_time X224_DE_time X236_DE_time | 10 dB | 97.60 % 0.32 | 97.33 % 0.31 | 92.63 % 0.34 |
1730 | X100_DE_time X212_DE_time X225_DE_time X237_DE_time | 10 dB | 98.40 % 0.38 | 98.22 % 0.36 | 94.00 % 0.32 |
Table 7Comparison results when SNR is 5 dB
Rotation speed (RPM) | Training signals (fault diameter 21 mils) | SNR | OAO-RVM accuracy time-consuming (S) | DT-RVM accuracy time-consuming (S) | OAR-RVM accuracy time-consuming (S) |
1797 | X097_DE_time X209_DE_time X222_DE_time X234_DE_time | 5 dB | 93.80 % 0.30 | 93.11 % 0.31 | 87.25 % 0.34 |
1772 | X098_DE_time X210_DE_time X223_DE_time X235_DE_time | 5 dB | 94.20 % 0.31 | 93.56 % 0.30 | 89.38 % 0.30 |
1750 | X099_DE_time X211_DE_time X224_DE_time X236_DE_time | 5 dB | 94.40 % 0.31 | 93.78 % 0.32 | 89.13 % 0.29 |
1730 | X100_DE_time X212_DE_time X225_DE_time X237_DE_time | 5 dB | 94.00 % 0.33 | 93.56 % 0.33 | 89.63 % 0.33 |
4.4. Fault identification comparisons of the proposed methods when several faults developing simultaneously
Sometimes, it is urgent situation when several faults are developing simultaneously. The proposed methods in this paper also considers such emergent case. Because the dataset from [22] cannot provide signals when several faults are developing simultaneously. Target this case, this paper uses the dataset from the roller bearing fault simulation stand QPZZ-II in Fig. 8, which can provide the roller fault and outer race fault simultaneously (RO faults) besides inner race fault, out race fault and roller fault.
Fig. 8The roller bearing simulation stand QPZZ-II
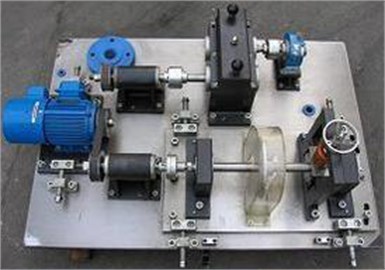
The QPZZ-II is manufactured by Jiangsu Qiang Peng Diagnosis Engineering Co., Ltd. It simulates different roller bearing faults including the inner race fault, the outer race fault and the roller fault. Moreover, it can simulate the roller fault and outer race fault simultaneously. In this stand, fault diameter is 20 mils and the vibration signals are collected at 10 K sampling rate. Three waveforms are shown in Fig. 9 corresponding to the bearing with roller fault, the bearing with outer race fault and the bearing with RO faults while the rotation speed is 1450 RPM.
Fig. 9Waveforms from different bearing

a) Bearing with outer race fault

b) Bearing with roller fault

c) Bearing with outer RO faults
In this case, one more state is considered when proposing the faults classification methods. Therefore, the DT-RVM models needs one more classification which is added at the final node of the previous DT-RVM in Fig. 2. The added classification will identify the outer race fault and RO faults. The OAO-RVM model needs three more classifications and one state will be determined by the voting of three classifications. The OAR-RVM model need one more classification to identify the RO faults from the rest states. Four different rotation speeds are considered and the performances of the proposed methods are compared in Table 8.
The comparison results show that the proposed methods can identify the roller bearing state even when the roller fault and the outer race fault occur simultaneously accurately. The OAO-RVM possesses the higher accuracy compared with DT-RVM and OAR-RVM. Because more classifications and more training samples are involved into the proposed models, much more time is consumed in the process of testing the models. Meanwhile, DT-RVM model consumes less time compared with OAO-RVM model and OAR-RVM model because DT-RVM uses relative few classifications.
Table 8Comparison results when several fault developing simultaneously
Rotation speed (RPM) | Fault diameter (mils) | Sample rate (K) | OAO-RVM accuracy time-consuming (S) | DT-RVM accuracy time-consuming (S) | OAR-RVM accuracy time-consuming (S) |
1150 | 20 | 10 | 99.76 % 12.37 | 99.14 % 12.25 | 98.32 % 12.32 |
1250 | 20 | 10 | 99.65 % 9.32 | 99.00 % 9.31 | 98.80 % 9.33 |
1350 | 20 | 10 | 99.88 % 8.97 | 99.86 % 8.86 | 99.28 % 8.87 |
1450 | 20 | 10 | 98.71 % 8.32 | 98.43 % 8.30 | 97.76 % 8.33 |
5. Conclusions
This paper incorporates harmonic wavelet packet and RVM to propose the novel the roller bearing fault discrimination method. Harmonic wavelet packet possesses better feature extraction performance due to its box-shape frequency analysis. By the contrasts of two feature extraction methods, the discrimination accuracy with Harmonic wavelet packet is always greater than or equals conventional wavelet packet in the cases of different rotation speeds. Meanwhile, the same conclusion can be drawn in the cases of different fault diameters. Therefore, harmonic wavelet packet possesses better performance than wavelet packet.
Three discrimination models with RVM are proposed including DT-RVM, OAR-RVM and OAO-RVM which is simplified in this paper. From the characteristics of three models, the simplified OAO-RVM model possesses good discrimination accuracy and computation efficiency. After the three discrimination models are compared with those dataset from different rotation speed and different fault diameter, the accuracy of OAO-RVM nearly equals that of DT-RVM and is greater than that of OAR-RVM in most cases. By the comparison of time-consuming of three discrimination models, it is very clear that the computation efficiency of the simplified OAO-RVM is the best one. Therefore, the proposed discrimination methods are effective for the roller bearing fault classification.
To illustrate the sensitivity of the proposed methods, this paper trains the models with the dataset from the larger size fault diameter and tests the models with the dataset from the smaller size fault diameters. Comparison results show that the OAO-RVM model, the OAR-RVM model and the DT-RVM model can identify the fault patterns with lower accuracy. OAO-RVM improves accuracy at lower rotation speeds, DT-RVM improves accuracy at the highest rotation speed and OAR-RVM improves accuracy at the lowest rotation speed.
When different SNR is considered, the performances of the proposed methods are compared in this paper. Comparison results show good performances of the proposed methods even when noise is involved. Among them, the accuracy of the OAO-RVM model and the accuracy of the DT-RVM model are greater than that of the OAR-RVM model. And the accuracy of the OAO-RVM model is the best one compared with the DT-RVM model and the OAR-RVM model.
This paper also considers the situation when several faults develop simultaneously. The performances of the proposed methods are compared while the roller fault and the outer race fault develop simultaneously besides the inner race fault, the outer race fault and the roller fault. The comparison results show that the proposed models possess good identification accuracy even when several faults developing simultaneously. Meanwhile, the results present the higher accuracy of OAO-RVM and the efficient computation of DT-RVM.
References
-
Yu Dejie, Cheng Junsheng, Yang Yu Application of EMD method and Hilbert spectrum to the fault diagnosis of roller bearings. Mechanical Systems and Signal Processing, Vol. 19, Issue 2, 2005, p. 259-270.
-
Cheng Junsheng, Yu Dijie, Yang Yu a fault diagnosis approach for roller bearings based on EMD method and AR model. Mechanical Systems and Signal Processing, Vol. 20, Issue 2, 2006, p. 350-362.
-
Yang Yu, Yu Dejie, Cheng Junsheng A fault diagnosis approach for roller bearing based on IMF envelope spectrum and SVM. Measurement, Vol. 40, Issue 9-10, 2007, p. 943-950.
-
Han Xing, Xiong Jingqi, Sun Rui, et al. Research on the roller bearing fault diagnosis based on morphological wavelet and LSSVM algorithm. Proceedings of International Conference on Quality, Reliability, Risk, Maintenance, and Safety Engineering. EMingShan City, China, 2013, p. 1888-1892.
-
Wang Zhigang, Li Yourong, Li Fang fault diagnosis method based on harmonic wavelet analysis. Journal of Vibration and Shock, Vol. 25, Issue 2, 2006, p. 125-128.
-
Zhao Yuan-xi, Xu Yong-gang, Gao Li-xin, et al. Fault pattern recognition technique for roller bearing acoustic emission based on harmonic wavelet packet and BP neural network. Journal of Vibration and Shock, Vol. 29, Issue 10, 2010, p. 162-165.
-
Yu Jintao, Ding Mingli, Meng Fangang, et al. Acoustic emission source identification based on harmonic wavelet packet and support vector machine. Journal of Southeast University (English Edition), Vol. 27, Issue 3, 2011, p. 300-304.
-
Sugumaran V., Ramachandran K. I. Automatic rule learning using decision tree for fuzzy classifier in fault diagnosis of roller bearing. Mechanical Systems and Signal Processing, Vol. 21, Issue 5, 2007, p. 2237-2247.
-
Sugumaran V., Ramachandran K. I. Fault diagnosis of roller bearing using fuzzy classifier and histogram features with focus on automatic rule learning. Expert Systems with Applications, Vol. 38, Issue 5, 2011, p. 4901-4907.
-
Sugumaran V., Muralidharan V., Ramachandran K. I. Feature selection using decision tree and classification through proximal support vector machine for fault diagnostics of roller bearing. Mechanical Systems and Signal Processing, Vol. 21, Issue 2, 2007, p. 930-942.
-
Sugumaran V., Sabareesh G. R., Ramachandran K. I. Fault diagnostics of roller bearing using kernel based neighborhood score multi-class support vector machine. Expert Systems with Applications, Vol. 34, Issue 4, 2008, p. 3090-3098.
-
Tipping M. E. Sparse Bayesian learning the relevance vector machine. Journal of Machine Learning Research, Vol. 1, Issue 3, 2001, p. 211-244.
-
Tipping M. E., Faul A. C. Fast marginal likelihood maximization for sparse Bayesian models. Proceedings of the Ninth International Workshop on Artificial Intelligence and Statistics, 2003, p. 3-6.
-
Newland D. E. Harmonic wavelet analysis. Proceedings of the Royal Society A, Vol. 443, 1993, p. 203-225.
-
Newland D. E. Wavelet analysis of vibration, part 1: theory. Journal of Vibration and Acoustics, Vol. 116, 1994, p. 409-416.
-
Li Shunming, Li Xianglian Modern Analysis Techniques and Application of Vibration Signals. National Defense Industry Press, Beijing, 2008, p. 141-142.
-
Mackay J. C. the evidence framework applied to classification networks. Neural Computation, Vol. 4, Issue 5, 1992, p. 720-736.
-
Begüm Demir, Sarp Ertürk Hyperspectral image classification using relevance vector machines. IEEE Geoscience and Remote Sensing Letters, Vol. 4, Issue 4, 2007, p. 586-590.
-
Gholami B., Haddad W. M., Tannenbaum A. R. Relevance vector machine learning for neonate pain intensity assessment using digital imaging. IEEE Transactions on Biomedical Engineering, Vol. 57, Issue 6, 2010, p. 1457-1466.
-
Bottou L., Cortes C., Denker J., Drucker H., et al. Comparison of classifier methods: a case study in handwriting digit recognition. International Conference on Pattern Recognition, 1994, p. 77-87.
-
Knerr S., Personnaz L., Dreyfus G. Single-Layer Learning Revisited: a Stepwise Procedure for Building and Training a Neural Network. Neurocomputing, Vol. 68, Springer-Verlag, New York, 1990.
-
The Case Western Reserve University Bearing Data Center Website. Bearing data center seeded fault test data. http://csegroups.case.edu/bearingdatacenter/pages/welcome-case-western-reserve-university-bearing-data-center-website.
About this article
The authors gratefully acknowledge the financial supports by the Liaoning Provincial Department of Education Project under Grant Numbers L2013070 and L2014069.
