Abstract
Diffraction efficiency of grating, created by hot imprint process on the surface of polycarbonate is one of the parameters, which determines the quality of microstructure. Gratings are created by using hot imprint process with and without high frequency excitation and during the quality investigation, diffraction efficiencies were measured on purpose to find microstructure of best possible optical quality, as well determine whether high frequency excitation and other process parameters during the process affect this parameter. Process parameters include: temperature, excitation frequency, force of mechanical load and duration of hot imprint process, the purpose is to determine the collection of parameters, which influences the diffraction efficiency most positively. Paper discusses production of diffraction gratings and method of investigation of diffraction efficiency after all this results of this investigation are being presented and generalized.
1. Introduction
Precise periodical microstructure (DOE), created by the process of mechanical hot imprint is for the purpose of biosensing in the field of medicine. Hot imprint process with high frequency excitation was chosen for the production of microstructure after the thorough evaluation of all pros and cons over the other replication techniques [1]. There exists lots of parameters (temperature, time, mechanical load) which, when combined perfectly can cause best possible quality of microstructure. High frequency excitation during the process is another factor, which when applied properly helps to enhance surface quality by: decreasing surface roughness, allowing avoid distortions, enhancing diffraction efficiency, filling empty gaps between master mold and polymer etc. [2-8]. Vibroactive pad, based on stack type piezoactuator, generating longitudinal vibrations is employed during the experiment [9].
As it is mentioned before high frequency excitation enhances diffraction efficiency, thus the purpose of the paper is to determine how diffraction efficiency depends on the resonant mode, as well as on other process parameters (temperature and force), when pursuing to find working regime, allowing to obtain highest diffraction efficiency, especially in +1 and –1 maxima.
2. Experimental setup
Experiment of hot imprint process (Fig. 1) consists from three major steps. In the beginning heating plate with master mold (Fig. 2) (lamellar periodic microstructure of 4 µm period, made from nickel) are being preheated until the temperature of 148°C, this step is called preheating. Second stage of the process is hot imprint, during which master mold is being impressed onto the surface of polycarbonate, this step lasts for 10 s., since it is established as minimal optimal imprint time. The last stage is demolding, during this stage heating plate together with master mold are withdrawn, thus accomplishing the process.
Hot imprint experiment on the surface of polycarbonate was performed under established experimental matrix (Table 1). Process temperature of 148°C corresponds to glass transition temperature of polycarbonate, another option of temperature is 152°C, what is slightly more than glass transition temperature. Earlier it was established, that quality (from e-conference) of the surface is influenced positively, when vibroactive pad generates ultrasonic excitation, now the task is to determine which one of resonant modes (first or second) (Figs. 3-4) is more beneficial, when pursuing higher diffraction efficiency. Mechanical load is another influencing parameter, which determines the quality, load values vary from 1 to 5 Atmospheres (Atm).
Fig. 1Computational scheme of mechanical hot imprint
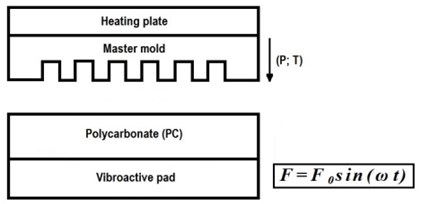
Fig. 2Image of master mold, done with scanning electron microscope
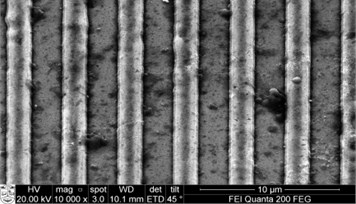
Fig. 3First vibration mode of vibroactive pad (f= 12.910 kHz; U= 3.5676 V)
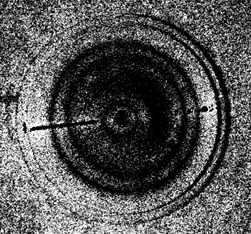
Fig. 4Second vibration mode of vibroactive pad (f= 13.601 kHz; U= 4.4416 V)
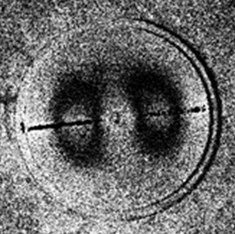
Table 1Experimental matrix
Run | Temperature, °C | Mechanical load, Atm | Frequency of excitation, kHz |
1 | 148 | 1 | 12,910 |
2 | 148 | 1 | 13,601 |
3 | 148 | 2 | 12,910 |
4 | 148 | 2 | 13,601 |
5 | 148 | 3 | 12,910 |
6 | 148 | 3 | 13,601 |
7 | 148 | 4 | 12,910 |
8 | 148 | 4 | 13,601 |
9 | 148 | 5 | 12,910 |
10 | 148 | 5 | 13,601 |
11 | 152 | 1 | 12,910 |
12 | 152 | 1 | 13,601 |
13 | 152 | 2 | 12,910 |
14 | 152 | 2 | 13,601 |
15 | 152 | 3 | 12,910 |
16 | 152 | 3 | 13,601 |
17 | 152 | 4 | 12,910 |
18 | 152 | 4 | 13,601 |
19 | 152 | 5 | 12,910 |
20 | 152 | 5 | 13,601 |
3. Optical investigation setup
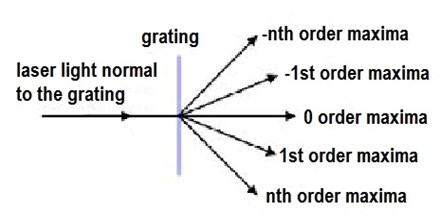
Optical investigation setup and simplified scheme, used in order to determine diffraction efficiencies are shown in the Figs. 5-6, consists of three major parts: sample, photodiode, ammeter. The laser (λ=632.8 nm) and photodiode BPW-34 were used in order to measure diffraction efficiency. Scheme is connected to tester.
Fig. 5Measurement of diffraction efficiency: 1 – sample; 2 – photodiode, connected to ampermeter; 3 – distribution of diffraction maxima; 4 – ammeter
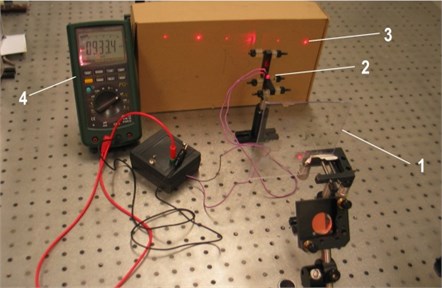
Fig. 6Simplified scheme of distribution of diffraction maxima
In order to eliminate material optical properties and evaluate the geometry the relative diffraction efficiency (SEi,j) is calculated by using following formulas:
here Ii,j– intensity of diffraction maxima of i-th reflection under the j-th angle of illumination; Ij– sum of all intensities of diffraction maxima under the j-th angle of illumination.
The current, which passes through photodiode is being registered by the ammeter, the magnitude of the current is directly proportional to the amount of photons of the light, which strike the photodiode. According to the Eq. (2), sum (Ij) of all currents (different diffraction angles) is being calculated, then particular current (value of particular maxima), is being divided from this sum and the relative value (%) of diffraction efficiency is thus obtained. The most important indicator, which determines optical quality of the grating after the measurement of diffraction efficiency is +1 and –1 maxima, this property (bigger value of these maxima) is strongly desirable in various applications [10]. Thus the main attention is being paid to these maxima and main goal is to find regime, which causes them to be higher.
4. Results and discussions
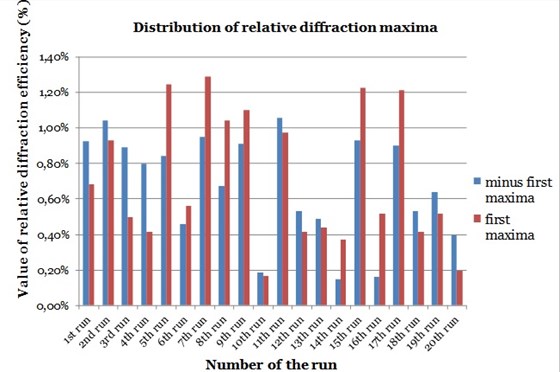
After the investigation of diffraction efficiencies results can be discussed. Results are presented in Fig. 7. After the measurement values of diffraction efficiencies were calculated, thus determining which one of them has better diffraction efficiency.
It is obvious, that vibration form plays crucial role. It can be observed the trend, that microstructures, created under the first vibration mode (maintaining other conditions the same) have higher diffraction efficiency (for example 5th (0.84 % minus first maxima and 1.24 % first maxima) vs 6th (0.46 % minus first maxima and 0.56 % first maxima)run; 7th (0,95 % minus first maxima and 1.29 % first maxima) vs 8thrun (0.67 % minus first maxima and 1.04 % first maxima)etc.). This can be explained because of higher amplitudes, which are obtained under this mode [7]. Higher amplitudes force preheated polymer flow, thus filling empty gaps and obtaining microstructure, which is more analogous to master mold.
The next important factor is mechanical load, it can be seen, that microstructures of 5th, 7th, 15th (0.93 % minus first maxima and 1.23 % first maxima) and 17th (0.9 % minus first maxima and 1.21 % first maxima) runs (mechanical load was 3 or 4 Atm) have higher diffraction efficiencies, than others. This can be explained by the fact, that higher mechanical load (5 Atm) inhibits the excitation, thus diminishing positive effect of high frequency excitation during the process [11]. Whereas mechanical loads of 1 and 2 Atm are insufficient for both processes (with and without excitation).
Fig. 7Distribution of relative diffraction maxima
5. Conclusions
According to results, obtained after the investigation of diffraction efficiency, conclusions and benchmarks for the future investigations can be made. During the investigation was revealed, that first vibration mode influences diffraction efficiency more beneficially than second, since under the same conditions diffraction efficiency is always higher in the specimen, created under the first vibration mode.
Another parameter, which allowed obtain positive results was the magnitude of mechanical load, 3 and 4 Atm allowed to extract most positive results. Under the temperature of 148°C higher diffraction efficiencies are higher as well. Thus it is possible to state, that combination of parameters, when temperature is 148 °C, mechanical load is 4 Atm and vibration frequency of 12,910 kHz is the most suitable, when pursuing obtain highest diffraction efficiency of the microstructure, since during the experiment it was obtained (0,95 % minus first maxima and 1.29 % first maxima).
References
-
Lee L. J., et al. Design and fabrication of CD-like microfluidic platforms for diagnostics: Polymer based micro fabrication. Biomedical Microdevice, Vol. 3, Issue 4, 2001, p. 339-351.
-
Benatar A., Gutowski T. G. Ultrasonic welding of PEEK graphite APC-2 composites. Polymer Engineering and Science, Vol. 29, Issue 23, 1989, p. 1705-1721.
-
Nonhof C. J., Luiten G. A. Estimates for process conditions during the ultrasonic welding of thermoplastics. Polymer Engineering and Science, Vol. 36, 1996, p. 1177-1183.
-
Liu S. J., et al. Development of weldability diagrams for ultrasonic welding of thermoplastics in far-field. Plastic Rubber Composite Processing and Applications, Vol. 27, Issue 6, 1998, p. 279-286.
-
Liu S. J., Chang I. T., Hung S. W. Factors affecting the joint strength of ultrasonically welded polypropylene composites. Polymer Composites, Vol. 22, Issue 1, 2001, p. 132-141.
-
Narijauskaitė B., Palevičius A., Narmontas P., Ragulskis M., JanušasG. High-frequency excitation for thermal imprint of microstructures into a polymer. Experimental Techniques, Malden, Wiley-Blackwell Publishing, 2012, p. 1-7.
-
Šakalys R., Janušas G., Palevičius A. Vibroactive pad for replication of microstructure and its experimental analysis. Proceedings of 19th International Conference Mechanika, 2014, p. 225-227.
-
Sakalys R., Janusas G., Palevicius A. Quality analysis of periodical microstructures, created by using high frequency vibration excitation. Proceedings of the 1st International Electronic Conference on Senssors and Applications, 2014.
-
Šakalys R., Palevičius A., Janušas G. Vibroactive pad improvement using stack type piezoactuator. Vibroengineering Procedia, Vol. 2, 2013, p. 109-112.
-
Popov E. Gratings: Theory and Numeric Applications. Institut Fresnel, 2012, p. 23.
-
Mekaru H., Hiroshi G., Takahashi M. Development of ultrasonic micro hot embossing technology. Microelectronic Engineering, Vol. 84, 2007, p. 1282-1287.
About this article
This research was funded by a grant (No. MIP-026/2014) from the Research Council of Lithuania.
