Abstract
Dispersed micro cracks are widely found in engineer materials, e.g. concrete, ceramic and composite. Specific damping capacity (SDC) caused by friction on micro crack surfaces (FSDC) was investigated in this study. Firstly, frictional energy dissipation (FED) of individual micro crack was modeled analytically and it was further validated by unit cell FE approach. Then, the model was employed in macro-scale cantilever beams involving regular and random multi micro cracks respectively. FEDs and FSDCs of the beams with different micro crack angles and densities are predicted. The study indicated that FED (and FSDC) depends on crack angle and stress state in structure. FSDC is independent to magnitudes of load and modulus of material in elastic scope. To materials with low viscosity, damping might increase significantly with the presence of multi micro cracks of high density.
1. Introduction
Dynamic properties, including damping, are concerned in design and analysis of engineering structural and mechanical systems in order to control of vibration and noise. The damping of the structure is possibly caused by the resistance of external, e.g. air drag and support friction. It also possibly comes from the interior energy dissipation of structure, including the viscidity of material, friction of interior contact surfaces, heat and sound production and damage evolution. Macromolecule material, high damping alloy material and smart damping material have been widely used in engineering currently. Each sort of damping material has different dominating damping mechanism. For instance, interpenetrating polymer network (IPN) is one important damping source for polymers [1]; energy dissipation in coherent twin boundaries contributes to damping capacity for TiNi-based shape memory alloys [2]; dissipation of heat which transformed from vibration offers damping for piezoelectric material [3]. For a composite material, damping is possibly introduced from the viscoelasticity of components as well as from the interphase between them [4-6]. The damping properties of composites are usually more complicated than homogenous material due to their local in-homogeneities [4]. Numbers of experimental, theoretical and numerical researches can be found in literatures on damping of composites under various conditions, e.g. temperature, moisture, loading frequency and waveform [7, 8].
Defects and damages which characterized by micro cracks are often found in engineer materials and structures during both manufacturing and service. For example, microscopic defects are likely to be caused by crystallization, transformation, thermal treatment or other reasons in metals. Rocks and concretes intrinsically have huge amounts of dispersive micro scale cracks, holes and inclusions inside [9]. For fiber composites, cracking might happen in matrix, fiber, interfaces both between fiber/matrix and neighbor plies [10].
Friction of crack surfaces and damage development consume energy. For instance, Chong du Cho [11] presented an estimation of interfacial friction in fiber-reinforced ceramics via increasing temperature during cyclic loading. David B. [12] used an indentation method to obtain the fiber/matrix interfacial frictional sliding stress and debond energy of a SiC/glass-ceramic composite. One of the macro phenomena of these energy dissipations manifests of damping under cycle loads. Birman [13, 14] analytically modeled the relation between damping and micro matrix crack of ceramic matrix unidirectional and cross-ply composites. Damping is also used to figure out damage level of structure. D. A. Saravanos [15] correlated crack size and modal damping of delaminated laminates and beams analytically and experimentally. Andreas T. Echtermeyer [16] found that damping variation can indicate the onset of rapid degradation of the material in their research on the fatigue life of glass-reinforced polyester and phenolic laminates. Balasubramaniam [17] demonstrated the loss factor measurement is an effective way to detect manufacture introduced contaminations in unidirectional glass/epoxy pultrusion composites. Contamination degrades fiber/matrix bounding strength. C. Kyriazoglou [18] and Z. Zhang [19] measured the damping of unidirectional composites, cross-ply laminates and woven laminates after fatigue cycles and found the damping was sensitive to damage. Damping is recommended as an effective representation of damage evaluation.
Among researches in literatures mentioned above, though some have taken into account of the frictional energy dissipation [11, 15], the quantitative relation between damping and micro cracks is still absent, however it might be interested in damage evaluation using dynamic way. In this study, a quantitative prediction of specific damping capacity (SDC), one indicator of damping behavior, for structures or solids with multi micro cracks was approached (it is abbreviated as FSDC in this paper). The model was developed based upon detailed frictional energy dissipation (FED) analysis of one individual micro crack.
2. FED and SDC models of individual micro crack
When a structure or solid vibrates, its kinetic and strain energies transform mutually. The largest strain energy, equaling the entire energy driving vibration, determines the intensities of deformation or vibration of the structure. The proportion of energy consumed during one vibration cycle directly associates to the vibration attenuation rate, this phenomenon also known as damping. Therefore, damping can be characterized quantitatively by SDC, which was defined by Adams [20-22] as expression of:
here Zdiss and Zstra denote the dissipated energy and largest strain energy respectively in one load cycle. In general, Zdiss in Eq. (1) might include several kinds of energy dissipations in a vibration process. In this study only frictional energy dissipation caused by micro cracks was concerned and it was investigated separately. Thus, Eq. (1) here is actually a particular case for SDC, i.e. FSDC. The proportion of FSDC in total SDC for some often used engineering materials were roughly assessed in the last section of this paper.
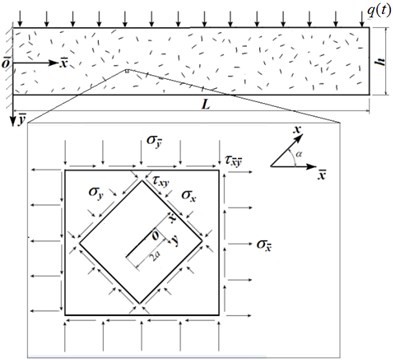
Damping caused by micro cracks is partly due to FED on the micro crack surfaces under cycle load. Some engineering material, e.g. concrete or ceramic, might involve a mass of micro cracks with irregular three-dimensional shape, size and distribution. In this study a simplified plane model was employed in which micro cracks are postulated as straight shape and far apart scattering, so a dilute model is employed to calculate FED and FSDC in individual micro crack scale level. Stress and damage of one point in macro structure (or solid) is represented by a unit cell containing one micro crack if the point is viewed with an imaginary magnifying glass, as schematically demonstrated in Fig. 1(a). For convenience, the local coordinates of the micro unit cell (x-y) are parallel and vertical to the crack surface.
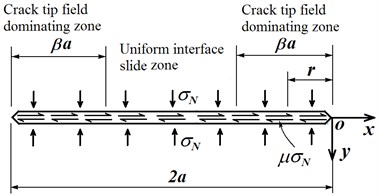
The macro stresses in this point is considered as uniform tractions applied on the boundaries of the unit cell, they are denoted as σˉx, σˉy and τˉxˉy in global coordinate (ˉx-ˉy) and as σx, σy and τxy in local one. σN is compression on crack surface. It is assumed uniform and equal to normal compressive force applied on unit cell boundary. Under cycling load, this micro crack will open and close alternatively. The relative tangent displacement of the two crack surfaces is obtained from the crack tip domain displacements of mode II fracture:
here is the shear module, for plane strain state and for plane stress state, is the Poisson’s ratio, is the distance from a point on crack surface to the crack tip (seeing Fig. 1(b)), is the half length of crack, is the stress intensity factor combining loads of far field uniform shear traction and crack surface frictional force, as shown in Fig. 1. The quantity of relative shear displacement is symmetrical to the crack center.
Fig. 1a) Macro scale structure and micro scale unit cell, b) local illustration of a closed micro crack
a)
b)
When the crack is closed, the normal stress on crack surface is simplified as a uniform pressure just equaling to the compressive load applied on the boundary of unit cell. If the structure is supposed experience periodic load, the compressive stress on crack surface also alternates with the same frequency. For example, if far field stress of a micro crack is applied symmetrical cycle sinusoid, the compressive stress of the micro crack surface is expressed as:
The symbol of ‘’ is of one-side condition, i.e. left side equals the value in right side bracket if it is positive otherwise left side equals zero. is the amplitude of pressure on crack surface. If the shear stress on micro crack surface has overcome the static frictional resistance, the two surfaces of micro crack will have relative shear displacement and frictional force does work. The frictional force is the product of compression and slide friction coefficient . The stress intensity factor (SIF) at crack tip can be obtained by the superposition of two SIFs corresponding to two individual load conditions, i.e. far field uniform shear load and crack surface frictional force, as expressed below:
The surface friction reduces degree of singularity at crack tip. varies periodically corresponding to the cycle load. If the value in right side bracket of Eq. (4) is negative, the crack surface is in static friction state.
The FED for a micro crack in one stress cycle can be expressed as:
When the micro crack length is greater than the crack tip singularity dominating range, the relative shear displacement of the crack surface out of this range is assumed constant and is continuous at the intersection point with the crack tip zones. The complete expression of the relative shear displacement is:
where is the radius of zone dominated by crack tip singular field, . The applicable scopes for the two separated expression in Eq. (6) are illustrated schematically in Fig. 1(b). By substituting Eq. (6), Eq. (5) is rewritten as:
Open and relative slide of crack surface promote whole tensile and shear deformation respectively of unit cell. Opening of crack under far field tension is assumed convex lens shape and its maximum open area during one load cycle is:
Integrating Eq. (6) along the crack surface, the whole relative slide area (or distance) of crack surface is obtained. The maximum one is:
If the cycling normal and shear tractions on unit cell boundary are synchronous, the peak opening and relative slide of crack also happen synchronously and at that moment the unit cell possesses maximum strain energy. Merging the opening and relative slide of crack in tensile and shear strain components in unit cell averagely, in other words stresses and strains in unit cell are simplified as still uniform, the equivalent tensile and shear moduli for this unit cell in local coordinate system at maximum energy moment are:
Here is Young’s modulus and is the ratio of half crack length to unit cell side length. The largest strain energy restored in unit cell is expressed as:
In real material, micro cracks are often found of fractal or zig-zag shape meanwhile usually being spatial irregular. Verisimilar simulations of their complicated shapes and deformations of crack would using more refined approaches, e.g. three dimensional FEM.
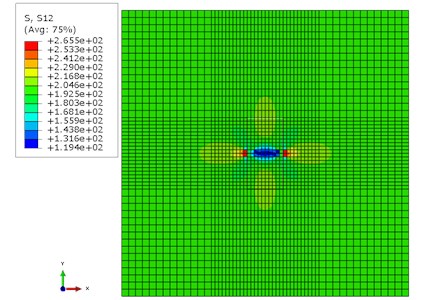
In order to verify the accuracy of the theoretical model developed above, finite element unit cell model is established via ABAQUS. For the comparison example, Young’s modulus and Poisson ratio are adopted as 150 GPa and 0.3 (similar to those of cast iron) and friction coefficient used is 0.4. Crack length is employed as 10 mm and unit cell side length as . If crack density of unit cell is defined as , it is 1.227 % in this case. Normal and tangent symmetrical sinusoidal loads, and , were applied uniformly to the unit cell boundaries and they fluctuate synchronously. In FE model, tangential friction formulation is chosen Lagrange multiplier algorithm and normal directional contact constraint is set Augmented Lagrange method. The mesh and shear stress distribution are illustrated in Fig. 2.
Fig. 2Mesh and shear stress in finite element unit cell model
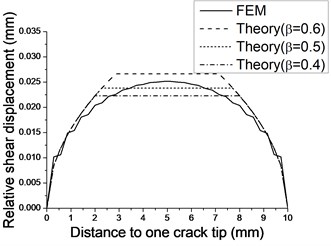
The numerical normal compress stress distributes along crack surface is found in shallow saddle shape which described in Fig. 3. It is slightly higher near crack tip than in the middle and this disparity can be neglected. Thus the assumption of constant normal pressure on the crack surface made in theoretical model is proven reasonable. Fig. 4 is the comparison of relative shear displacements on crack surface predicted by theoretical model and FEM model. The two predictions are found in good agreement near crack tips, however the discrepancy increases when approaching to middle part. When parameter in Eq. (6) is assigned value of 0.5, the theoretical relative shear displacement fits well with numerical prediction in average. FEDs of different length cracks predicted theoretically (with various value of ) and numerically are compared in Fig. 5. Value of 0.5 for is proven appropriate for a wide range of crack length.
Fig. 3Normal contact pressure on crack surface (a=5 mm)
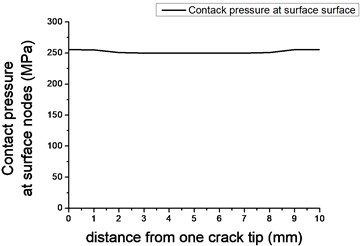
Fig. 4Relative shear displacement over crack surfaces (a=5 mm)
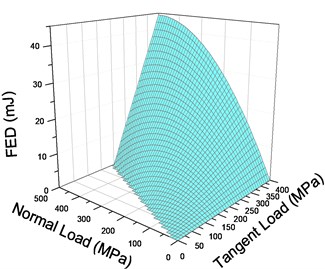
Changes of FEDs with normal and tangent loads are graphed in Fig. 6. FED linearly relates to shear load and nonlinearly to normal load, as demonstrated by the two intersecting lines of curved FED surface and axial planes in Fig. 6. Elevating normal compressive stress of crack surface has two opposite effects on FED, it raises the friction force and meanwhile, decreases the relative shear displacement of crack surfaces. Under some of stress states, e.g. stresses in the zero height triangular region in Fig. 6, FED will be zero for the crack surface is under static friction state.
Fig. 5Variation of FEDs predicted with various β and crack length
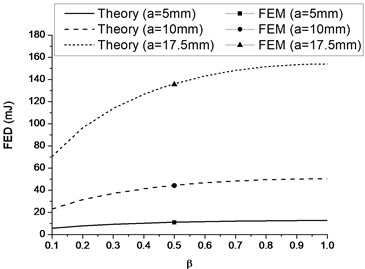
Fig. 6FED of single crack under various normal and tangent loads (a=5 mm)
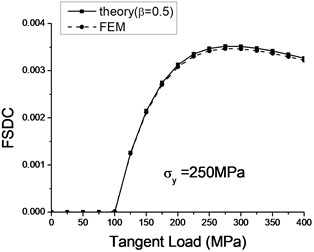
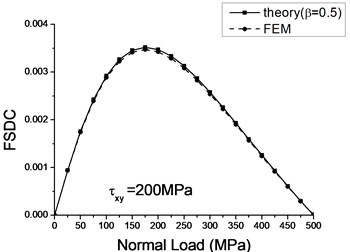
FSDCs predicted by theoretical model and FEM model are compared in Fig. 7. They are proven in good agreement.
Fig. 7Theoretical and numerical FSDCs with varied a) tangent load and b) normal load
a)
b)
Here only plane problem is concerned, this approach can be developed to three-dimension model further. Apart from FDSC, crack nucleation and propagation also consume energy to generate new surface, and this will offer extra damping. Actually, damping increasing has used as the indirect indicator of damage development in material or in structure [16, 18, 19]. This is an interesting issue and will be studied in our following research.
3. FED and SDC models for structure with multi cracks
3.1. Cantilever beam with regular cracks
FED and FSDC models for single micro crack developed in last section were employed in scenario of structure with multi micro cracks in this section. The local status of micro crack in a macro scale spot in structure is represented by a unit cell. The loads applied uniformly on the boundaries of this unit cell are just the macro-scale stresses at this point. The macro stresses of a cantilever beam carrying uniform pressure on top side of beam, as schematically illustrated in Fig. 1(a), is formulated with elastic theory ignoring the existence of damage, as following:
here, is the magnitude of the load. and are length and height of the beam respectively. Transposing Eqs. (12)-(14) to local coordinate system and then substituting to Eq. (7), one will have FED of a micro crack locates any site of the beam. By superposition, total FED of beam within one stress cycle is expressed as:
here, is the number of micro cracks. is the correction factor considering the interactions between adjacent micro cracks and its value can be found in SIF handbook [23]. The subscript ‘’ denotes the th crack. The largest strain energy of the beam is calculated by integrating strain energy density over the whole beam.
Regular cracks are modeled in the cantilever beam to investigate the relations between FSDC (FED) and crack configuration. Two rows of cracks uniform in inclined angle, length and interval spaces are arranged symmetrical to the neutral plane of cantilever beams. In order to avoid possible errors introduced from macro stresses calculation (by Eqs. (12)-(14)) close to clamped end of beam, the first column cracks are set apart from clamped end with distance of double beam height. Each row contains 16 cracks and three crack lengths of 10 mm, 20 mm and 35 mm have been adopted respectively. The beam’s dimension is 1600 mm in length and 160 mm in height, so the crack densities are 0.982 %, 3.93 % and 12.0 % for the three crack lengths, meanwhile the crack interaction correction factors are adopted 1.01, 1.02 and 1.04 for these three crack densities.
If material parameters used are the same as unit cell model, FSDCs for different crack angle and length (density) are illustrated in Fig. 8. One can found that FSDC reaches the peak value when micro cracks near angle of while close to zero at angle of 0 and , the two latter are corresponding to directions parallel to and perpendicular to the axial line of beam. In slender beam is approximately two and one order greater than and . For horizontal crack, stress contributes little to the FSDC (FED). The vertical cracks have little relative shear displacement and three-quarter of them (in lamped end) are in static friction state. This explains why the FSDCs (FEDs) for horizontal and vertical cracks are ignorable.
Fig. 8Variation of FSDC with crack angle for cantilever beam
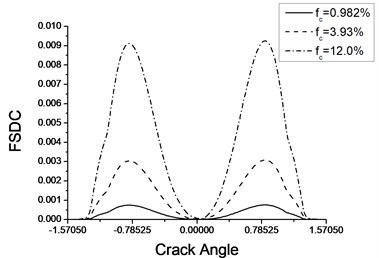
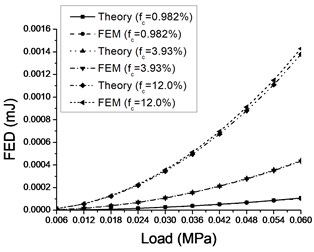
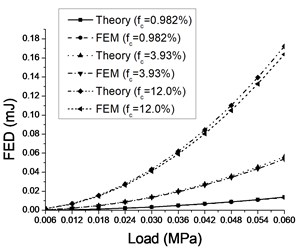
Fig. 9 is comparisons of FEDs predicted by theoretical and numerical models with increasing load. They are found in good agreement for the both two crack angles of and which corresponding to minimum and maximum FEDs respectively. FED is also observed increasing with load in quadratic way in this figure.
Fig. 9Comparisons of theoretical and numerical FEDs with various crack length (density) and load amplitude when cracks angle a) α=0 and b) α=π/4
a)
b)
3.2. Cantilever beam with random micro cracks
In case of diffusive random micro cracks, stress states and relative shear displacements on crack surfaces are un-uniform at any moment depending on their angles and locations. In one given moment some cracks might do friction work and others have no contributions to FSDC (FED), e.g. they are in open status or under static friction conditions. In a macro scale spot of structure the macro stress is postulated uniform. So from Eq. (15) one can see FED is direct proportional to density in this macro spot. If the length of micro crack is identical (as ), crack density in this sport is . Parameter is defined as the number of micro crack in unit area of the spot. If the length of crack equally distribute from zero to the maximum size of , crack density will be . If micro cracks are assumed homogenously distribute overall the beam and their angles are equally distribute from zero to , the FED of the whole structure can be calculated via triple integrating FED of single micro crack overall structure and full angle in space in one load cycle:
The largest strain energy of the beam is calculated in similar way as case of regular crack.
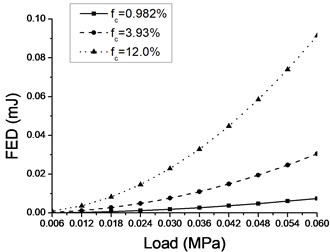
When material parameters and dimensions of the beam used here are the same with previous models, FEDs with different densities random distributed micro cracks are shown in Fig. 10. Quadratic increase of FED with load amplitude is also observed.
Fig. 10Variation of FED with external load for different crack densities
FSDCs of cantilever beams involving different crack configurations and crack densities are listed in Table 1. The FSDCs are found to be linear with crack density.
In real materials, micro cracks usually possess complicated three dimensional geometries and locate both on surface and inside. Characterizing them and distinguishing damping generated by them from total damping in experiment need well study and have not yet been reported in literatures. Experimental validation has neither been included in this paper. Numerical simulation to some degree can also validate the theoretical approach. Three dimensional finite element approach can offer more verisimilar description of real micro cracks.
Table 1FSDC of cantilever beams containing regular and random diffuse distributed cracks with different crack densities
0 | Random | ||||||||
Crack density | 0.982 % | 3.93 % | 12.0 % | 0.982 % | 3.93 % | 12.0 % | 0.982 % | 3.93 % | 12.0 % |
FSDC | 5.8E-6 | 2.3E-5 | 7.4E-5 | 7.5E-4 | 3.1E-3 | 9.3E-3 | 4.1E-04 | 1.7E-03 | 5.0E-03 |
Apart from FSDC, SDCs can also be generated by other damping factors. Followings are comparisons of predicted FSDC by models containing 12 % density random micro cracks with that from experiment for some engineering materials for which defeats are ignored, in other word. FSDCs are excluded in SDCs for these scenarios. Considering that FSDC depends only on crack configuration and stress state but independent to amplitude of load and material modulus under elastic scope, predicted FSDCs for the follow materials are postulated a same value of 5.0E-3. SDCs of Nodular cast iron [24], Mg-Zn-Y-Zralloy (strain is less than 1.0E-4) [25], polymer concrete [26] and polymer NVC 73 [1] have been tested as 8.4E-3, 1.3E-2, 1.4E-1 and 5.0, respectively. Micro cracks are estimated put additional SDCs of 59 %, 38 %, 3.6 % and 0.1 % to those undamaged materials, respectively. This means FSDC might be non-ignorable for materials with low viscosity. It need to emphasis that experimental SDCs listed above were obtained with different test methods. So, the comparisons are only in sense of rough estimation. Apart from FED, stress concentration at crack tip might cause additional local visco-deformation, further local plastic deformation or damage evolution. These might introduce more other damping mechanisms contributing to SDC at crack tip region. Further study on these sophisticated topics is the later aims.
4. Conclusions
In this paper frictional energy dissipation (FED) and specific damping capacity (SDC) caused by FED from micro cracks (FSDC) were investigated. Local stress and relative slide displacement of single micro crack was modeled theoretically and verified by unit cell finite element approach. The FED expression obtained, Eq. (7), tells that far filed tangent stress contributes to FED in linear way because relative displacement of crack surfaces is in direct proportion to it. The normal stress plays two opposite roles to FED, it promotes friction force and so FED linearly however it abates slide of crack surface linearly and so FED in quadratic way. FED and FSDC are also found proportional to square of crack length. So if area of a circle whose diameter being crack length is used to define crack density, FSDC (FED) will direct proportional to crack density.
The single crack FED and FSDC model was then used in cantilever beam model with regular and random micro cracks, respectively. Regular crack model demonstrates that in bending structure, micro crack’s FSDC contribution is biggest when its angle to axial line of beam being near , while to be smallest when its angle being parallel to or perpendicular to axial line. FE approaches also support these conclusions and valid the precisions of analytical FED and FSDC predictions. Case of random micro cracks (both length and angle) was modeled from single crack approach by integrating and averaging random parameters. So, it is conceivable that random crack FED (and FSDC) possesses the similar relations with load condition and crack density. Though only the simplest equal distribution random pattern for crack length, crack angle and crack spatial position have been studied in this paper, it will not meet great difficulty to expand it to various distribution patterns of these parameters. It is also proven that the FSDC is independent of load magnitude and material modulus in the elasticity scope for a given load. Comparing roughly with some often used engineering materials demonstrates that for low viscosity material, e.g. cast iron, damping caused by FED of high density of micro cracks is not ignorable.
References
-
Mathew A., Chakraborty B. C., Deb P. C. Studies on interpenetrating polymer networks based on nitrile rubber-poly (vinyl chloride) blends and poly (alkyl methacrylates). Journal of Applied Polymer Science, Vol. 53, 1994, p. 1107-1114.
-
Cai W., Lu X. L., Zhao L. C. Damping behavior of TiNi-based shape memory alloys. Materials Science and Engineering A, Vol. 394, 2005, p. 78-82.
-
Ray M. C., Mallik N. Performance of smart damping treatment using piezoelectric fiber – reinforced composites. AIAA Journal, Vol. 43, Issue 1, 2005, p. 184-193.
-
Chandra R., Singh S. P., Gupta K. Damping studies in fiber-reinforced composites – a review. Composite Structures, Vol. 46, 1999, p. 41-51.
-
Zhang P. Q. Influence of some factors on the damping property of fiber-reinforced epoxy composites at low temperature. Cryogenics, Vol. 41, 2001, p. 245-251.
-
Kubat J., Rigdahl M., Welander M. Characterization of interfacial interactions in high density polyethylene filled with glass spheres using dynamic-mechanical analysis. Journal of Applied Polymer Science, Vol. 39, Issue 7, 1990, p. 527-1539.
-
Jose Daniel D. Melo Time and temperature dependence of the viscoelastic properties of CFRP by dynamic mechanical analysis. Composite Structures, Vol. 70, 2005, p. 240-253.
-
Rabindra Kumar Patel, Bishakh Bhattacharya, Sumit Basu A finite element based investigation on obtaining high material damping over a large frequency range in viscoelastic composites. Journal of Sound and Vibration, Vol. 303, 2007, p. 753-766.
-
Kawamoto T., Ichikawa Y. Kyoya T. Deformation and fracturing behavior of discontinuous rock mass and damage mechanics theory. International Journal for Numerical and Analytical Methods in Geomechanics, Vol. 12, 1988, p. 1-30.
-
Hassan N. M., Batrar R. C. Modeling damage in polymeric composites. Composites, Part B, Vol. 39, 2008, p. 66-82.
-
Chongdu Cho, John W. Holmes, James R. Barber Estimation of interfacial shear in ceramic composites from frictional heating measurements. Journal of the American Ceramic Society, Vol. 74, Issue 11, 1991, p. 2802-2808.
-
Marshall D. B., Oliver W. C. Measurement of interfacial mechanical properties in fiber-reinforced ceramic composites. Journal of the American Ceramic Society, Vol. 70, Issue 8, 1987, p. 542-548.
-
Victor Birman, Larry W. Byrd Effect of matrix cracks on damping in unidirectional and cross-Ply ceramic matrix composites. Journal of Composite Materials, Vol. 36, 2002, p. 1858-1878.
-
Victor Birman, Larry W. Byrd Damping in ceramic matrix composites with matrix cracks. International Journal of Solids and Structures, Vol. 40, 2003, p. 4239-4256.
-
Saravanos D. A., Hopkins D. A. Effects of delaminations on the damped dynamic characteristics of composite laminates: analysis and experiments. Journal of Sound and Vibration, Vol. 192, Issue 5, 1996, p. 977-993.
-
Echtermeyer A., Engh B., Buene L. Lifetime and Young’s modulus changes of glass/phenolic and glass/polyester composites under fatigue. Composites, Vol. 26, Issue 1, 1995, p. 10-16.
-
Balasubramaniam K., Alluri S., Nidumolu P., et al. Ultrasonic and vibration methods for the characterization of pultruded composites. Composites Engineering, Vol. 5, Issue 12, 1995, p. 1433-1451.
-
Kyriazoglou C., Le Page B. H., Guild F. J. Vibration damping for crack detection in composite laminates. Composites: Part A, Vol. 35, 2004, p. 945-953.
-
Zhang Z., Hartwig G. Relation of damping and fatigue damage of unidirectional fiber composites. International Journal of Fatigue, Vol. 24, 2002, p. 713-718.
-
Adams R. D., Fox M. A. O., Flood R. J. L., et al. The dynamic properties of unidirectional carbon and glass fibre reinforced plastics in torsion and flexure. Journal of Composite Materials, Vol. 3, Issue 4, 1969, p. 594-603.
-
Adams R. D., Bacon D. G. C. Measurement of the flexural damping capacity and dynamic Young’s modulus of metals and reinforced plastics. Journal of Physics D: Applied Physics, Vol. 6, Issue 1, 1973, p. 27.
-
Ni R. G., Adams R. D. The damping and dynamic moduli of symmetric laminated composite beams – theoretical and experimental results. Journal of Composite Materials, Vol. 18, Issue 2, 1984, p. 104-121.
-
Handbook of Intensity Factor (Revised). Chinese Aeronautical Establishment, Science Press, Beijing, 1993, (in Chinese).
-
Shi Reihe, Shen Jiayou, Hua Reiqi, et al. Research on the damping property of cast iron. Foundry, Vol. 11, 1989, p. 9-12, (in Chinese).
-
Wang J., Gao S., Song P., et al. Effects of phase composition on the mechanical properties and damping capacities of as-extruded Mg-Zn-Y-Zr alloys. Journal of Alloys and Compounds, Vol. 509, Issue 34, 2011, p. 8567-8572.
-
Cortes F., Castillo G. Comparison between the dynamical properties of polymer concrete and grey cast iron for machine tool applications. Materials and Design, Vol. 28, Issue 5, 2007, p. 1461-1466.
About this article
This work was supported by the National Natural Science Foundation of China (Grant No. 11272147, 10772078), Chinese Aviation Science Fund (2013ZF52074), Fund of State Key Laboratory of Mechanical Structural Mechanics and Control (0214G02), SKL Open Fund (MCMS-0213G01), Priority Academic Program Development of Jiangsu Higher Education Institutions and Foundation of Graduate Innovation Center in NUAA (kfjj130101).
