Abstract
Different faults in internal combustion engines leads to excessive fuel consumption, pollution, acoustic emission and wear of engine components. Detection of fault is also difficult for maintenance technicians due to broad range of faults and combination of the faults. In this research the faults due to malfunction of manifold absolute pressure, knock sensor and misfire are detected and classified by analyzing vibration signals. The vibration signals acquired from engine block were preprocessed by wavelet analysis, and signal energy is considered as a distinguishing property to classify these faults by a Multi-Layer Perceptron Neural Network (MLPNN). The designed MLPNN can classify these faults with almost 100 % efficiency.
1. Introduction
Fault detection and diagnosing techniques are used in machineries to prevent human and financial losses, quality improvement, increase production rate, etc. Internal combustion engine, which are widely used in vehicles, are subjected to the implementation of these methods. The need for reduction of maintenance costs, as well as automation of industrial processes leads to new techniques for fault detection including: methods based on dynamical model, Multivariable Statistical Analysis, Fuzzy Logic, Genetic Algorithm, Artificial Neural Network, etc. Artificial Neural Networks (ANN) are inspired from human biological and neural system. ANN as a nonlinear dynamical system has the capability of mapping nonlinear functions. It has found numerous applications in technical and engineering applications. ANN like human brain needs training. ANN needs a huge amount of data to be trained. To recognize and classify different faults of IC engine ANN should be feed with one or more distinguishing features of the faults. The feature vector which is feed to the network represents the most distinguishing feature of the faults. In this research vibration signal is used as the ANN input since this signal has the following properties:
1. Providing huge amount of data;
2. Ease of measurement and data acquisition;
3. Providing effective data like natural frequency.
In 2001 Weidong Li et al. used acoustic emission and Self Organizing Map Networks to monitor valve looseness of an internal combustion engine. To analyze measured acoustic signals a two dimensional Self Organizing Map Network is used to extract features. The results showed the extracted features could distinguish between normal state of engine performance and faulty engine states [2].
In 2004 Geng and Chen presented a method for condition monitoring of IC engine based on vibration from piston slap. In this research using data from simulation and experimental data, wavelet packet decomposition used for analyzing piston slap [3].
In 2007 shirazi and mahjoob used discrete wavelet analysis for predicting IC engine faults. In this research vibration signals which are acquired from a 4 cylinder IC engine have been denoised by Time Synchronous Averaging (TSA) method. Then wavelet transform used to transfer signals from time domain to time-frequency domain. Results showed wavelet transform is a powerful tool for fault detection and denoising in IC engines with non stationary dynamics [4].
In 2007 Bao-Jia Chen et al. used wavelet scale power spectrum, rough sets and Neural Network. In their research the acquired signals were analyzed with continuous wavelet and feature vectors were developed by rough sets. Neural Networks were used to classify the faults with 100 % efficiency. The results showed wavelet power is very sensitive to signals [5].
In 2009 Junxing Hou et al. analyzed knocking combustion in HCCI engine with Dimethyl Ether fuel by wavelet packet. In their research capability of wavelet packet in knock detection has been demonstrated [6].
In 2009 Jian-Da Wua et al. presented a method to detect injector malfunction, lack of intake air and throttle shut off by Neural Network. They used a system which extracts manifold pressure as the feature which was preprocessed by discrete wavelet transform. The results showed that the proposed method which used manifold pressure as input is good for fault detection in laboratory [7].
In 2009 Yujun Li et al. used Empirical Mode Decomposition (EMD) for detection of abnormal looseness between rubbing parts of a diesel engine and showed this method is appropriate for looseness detection of engine parts [8].
In 2010 Meng-Hui Wang et al. compared a developed Neural Network for IC engines fault detection with two other methods namely multi-layer perceptron and K-means clustering. The result showed efficiency of 100 % for the new method and 85 % and 97 % efficiency for the other two methods respectively [9].
In 2010 Li Fang Kong et al. used Adaptive Neuro-Fuzzy Inference System (ANFIS) to detect IC engine faults. They showed improved performance of ANFIS to the previous Neuro-Fuzzy method in fault detection from 88 % to 99 % [10].
In 2011 Vong et al. analyzed fault detection of ignition signal by wavelet packet transform and Multi Class Least Squares Support Vector Machine (MCLS-SVM). They first acquired engine signals by oscilloscope and then decomposed them with wavelet packet. DB6 was used as mother wavelet function and the signal was decomposed to level 3. Then the resulted signals were fed to MLPNN and MCLS-SVM and clustering done with these two tools. Results showed that SVM was better than MLPNN for fault detection [11].
In 2011 Jian-Da Wu et al. presented an IC engine fault detection method based on intake manifold pressure; wigner-ville distribution was used for feature extraction and Neural Network for fault classification. Wigner-ville distribution used features extracted as input to ANN. Two different kinds of ANN were tested for classification namely: Radial Basis Function Network (RBFN) and Generalized Recurrent Neural Network (GRNN), the results showed GRNN was faster and performs better in classification than RBFN [12].
In the current research an IC engine is chosen and its normal operating condition was compared to engine operation with various single faults including: misfire, malfunction of intake manifold pressure sensor and knock sensor. More realistic and practical situations in which various combinations of the aforementioned single faults occur has been considered. Vibration signals acquired from engine block were preprocessed by wavelet. Energy content of signals was used as the feature vector to be fed to ANN. The designed ANN was capable of predicting 8 different faulty condition of motor as well as normal condition of motor with 100 % accuracy.
2. Experimental data acquisition
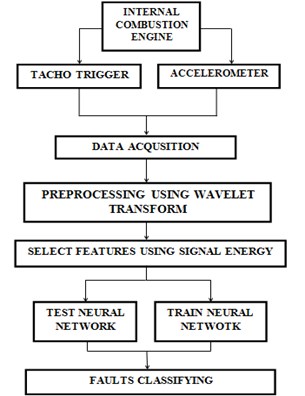
The algorithm used for fault detection which is composed of the following steps is shown in Fig. 1.
1. Data acquisition from normal and abnormal motor;
2. Decomposition of vibration signal acquired from motor block by wavelet analysis;
3. Determination of signal energy as the feature vector;
4. Design and determination of network parameters for obtaining a highly efficent network for fault classification.
Fig. 1The algorithm used for fault detection
Data acquisition for condition monitoring and fault detection of systems involves sensor selection, determination of sensor mount location and selection of software and hardware for data acquisition and analyze.
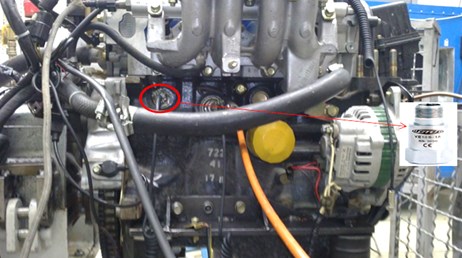
In this research an ADASH 4400 data analyzer has been used with 4 AC channels, 4 DC channels, capability of recording and displaying time waveform, spectrum, orbit, etc. In this research 4 one directional piezoelectric accelerometer were used. Schematic of data acquisition system and the sensor mounting location has been shown in Figs. 2 and 3 respectively.
Fig. 2Schematic of data acquisition equipment
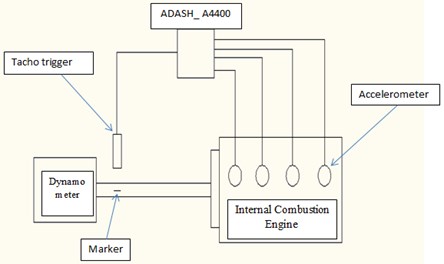
Fig. 3IC engine with location of mounted sensor
The experimental tests of this research have been done with collaboration of R&D motor laboratory of MEGA MOTOR Company. The specification of the motor under test is shown in Table 1.
Table 1Specification of the motor under test
1342 cm3 | |
9.7 cm | |
71 mm | Bore |
83.6 mm | Stroke |
50 kW at 5250 rpm | Max power |
107 Nm at 3000 rpm | Max torque |
8 | Number of valves |
7° | Ignition advance at idle speed |
9° before TDC | IVO |
52° after BDC | IVC |
52° before BDC | EVO |
14° after TDC | EVC |
1-3-4-2 | Firing order |
Gasoline | Type of fuel |
0.3 mm | Normal clearance of valves (both intake and exhaust) |
The test procedure is as follows: Motor would be run for 10 minutes for reaching its steady state condition. The accelerometers are already mounted on the engine block. Vibration signals were acquired for 3 minutes at the 1500 rpm of motor speed. The resulted signals were transferred to the personal computer and then analyzes by DDS software. Fig. 4 shows a sample of vibration signals extracted by the accelerometer before and after using a high frequency filter. The frequency range of all the important faults and malfunctions are between 8 Hz to 100 Hz. Hence, all the signals with higher frequency can be considered as noise and should be filtered. Fig. 4 shows the primary signal which is extracted by the accelerometer and also the smoothed filtered signal after discarding signals with frequency higher than 100 Hz. This high frequency filtering is done for all the signals through this research.
Fig. 4A sample of vibration signals before and after using a high frequency filter
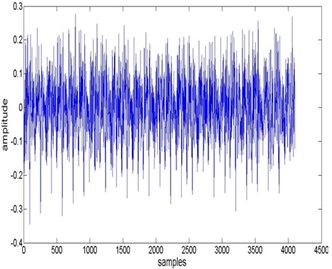
a) Before applying high frequency filter
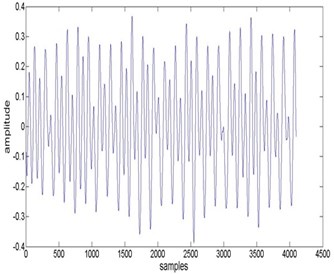
a) After applying high frequency filter
3. Preprocessing of vibration signals
Wavelet transform is an analysis method in time-frequency domain and is capable to detect non stationary features of a signal. By developing wavelet methods analyzing non stationary signals, which were not possible by traditional methods like FFT, has become possible. Non stationary signals are those signals whose statistical properties vary with time. Wavelet decomposes the signal and shows the correlation between wavelet function and signal with wavelet coefficients.
Wavelet analysis involves two concepts of transfer and scale. Transfer moves the wavelet function along the time axis, which can be stated mathematically as follows:
Transfer doesn’t alter wavelet function shape, and only translate it along time axis. Scale which is a one dimensional function, can be expressed, for function as , as follows:
In continuous wavelet transform, scale and transfer vary continuously and in discrete wavelet transform they vary discretely. Thus mathematical computation in continuous wavelet transform analysis is high. Decomposition of the signal is carried out by two high pass and low pass filters. The signal passing these filters decomposes to two high frequency signal (Detail) and low frequency signal (Approximation).
The filtering action is done by convolution of signal and filter. Then the samples of the resulted signal will be decomposed and sampled [1].
Determination of wavelet function type depends on data and specific kind of problem at hand. This determination for fault detection application is based on trial and error and will be done experimentally. Daubechies function from degree N "DB N" is used extensively in fault detection and monitoring problems [3-7, 10, 13].
In this research DB 5 is used based on trial and error. Among many characteristics possess by a signal, energy of the signal is chosen in this research as the fault distinguishing feature by trial and error.
Energy of a signal is defined as:
This is related to the energy that the signal carries. In this research energy of normal and abnormal signal is chosen as the feature vector to be feed to neural network. Fig. 5 illustrates the filtered acceleration signal of a faulty and normal engine vibration.
Fig. 5Comparison of normal and faulty signals

a) Faulty signal

b) Healthy signal
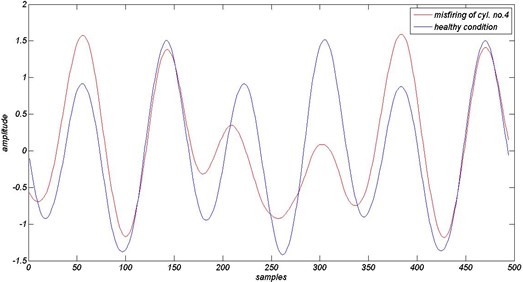
Fig. 6-8 draw a comparison between normal and faulty signals associated with MAP sensor and Knock sensor conditions as well as when misfiring occurs in engine. According to Fig. 6, there is a considerable difference between vibration signals of engine when MAP sensor has a malfunction relative to normal vibration signal of engine. Moreover, as can be seen in Fig. 7, if Knock sensor has a defect, the vibration signals of engine will increase relative to normal vibration signals of engine. In regard to misfiring, as Fig. 8 illustrates, there is a significant difference between normal and faulty vibration signals of engine which shows an irregularity in engine vibration behavior.
Fig. 6Comparison of normal and faulty signals in regard to MAP sensor status
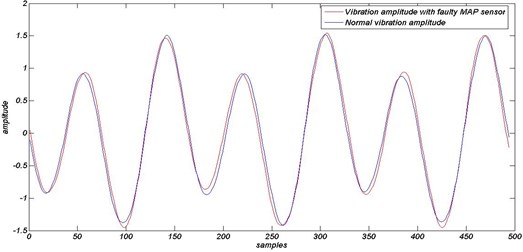
Fig. 7Comparison of normal and faulty signals associated with Knock sensor conditions
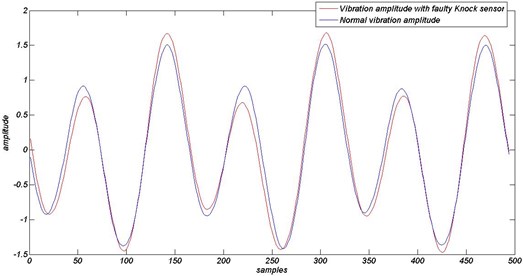
Fig. 8Comparison of normal signal and signal traced to misfiring in cylinder No. 4
4. Artificial neural network
Application of neural networks for fault detection and classification divides in two groups:
1) Systems to detect fault with high efficiency and low error;
2) Systems to classify different faults with lower efficiency and higher errors.
For designing a classifier system with high efficiency selection of proper feature vector is of critical importance. The other parameters of the Network should also be chosen precisely for high performance of the system [1].
Also there is no limitation in selection of hidden layers, they are usually considered as one or two. An ANN with 3 hidden layers has the capability to solve any complex problem [13].
The parameters which should be considered for designing an efficient ANN are briefly as follows:
1) Practical parameters, like Network precision, Network stability and capability of actual realization;
2) Network training parameters like input and output variables, choosing right size of input data set, initial;
3) Training parameters of the Network like determination of input and output, proper choice of training data set, initialization of Network weights and choosing appropriate criteria for training termination;
4) Network adjusting parameters, like determining number of neurons in each layer, number of hidden layers [13].
Fig. 9Schematic of designed MLPNN structure
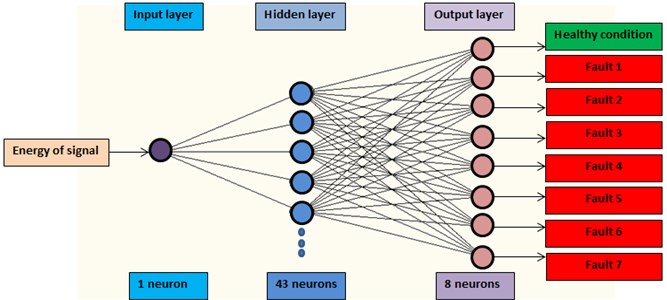
Fig. 10Diagram of detection performance of the network
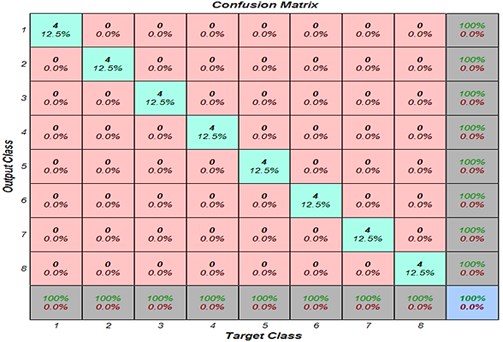
Although there are some rules of the thumb for determination of the aforementioned parameters, but design parameters were selected by trial and error in this research. MLPNN has been used widely for Machine fault classification in scientific literature. So MLPNN was used as fault classifier in this research. Among many different features a signal poses, only energy of signal was selected by trial and error for fault classification. So the designed MLPNN has one input neuron. There are eight different faults including the healthy condition of the engine so the designed MLPNN has eight output neurons. The designed MLPNN has three layers namely input layer, output layer and one hidden layer. The numbers of neurons in hidden layer were determined by trial and error. Different networks with different number of hidden layer neurons had been built and tested for minimum error. The number of hidden layer neurons varied from 1 to 100 neurons. The network with 43 neurons in hidden layer turned out to have the minimum error so the best structure for the designed MLPNN was found to be 1:43:8. Fig. 9 shows the structure of the MLPNN used in this research. The accuracy of the designed network is 100 % that is the network was managed to classify all the inputs to it correctly. Fig. 10 shows the confusion matrix of the network performance. From this figure it is clear that the designed MLPNN has managed to classify different faults correctly with 100 % accuracy.
Table 2 shows seven different fault conditions together with the target matrix for each fault.
Table 2Analyzed faults
Target matrix | Used conditions |
[0 0 1 0 0 0 0 0] | Misfiring in cylinder 1 |
[0 0 0 0 0 0 0 1] | Misfiring in cylinders 1 and 4 |
[0 1 0 0 0 0 0 0] | Normal condition – speed 1500 rpm |
[1 0 0 0 0 0 0 0] | No operation of knock sensor |
[0 0 0 0 1 0 0 0] | No operation of knock sensor and misfiring of cylinder No. 4 |
[0 0 0 0 0 1 0 0] | No operation of knock and MAP sensors and misfiring of cylinder No. 4 |
[0 0 0 0 0 0 1 0] | No operation of MAP sensor and misfiring of cylinder No. 4 |
[0 0 0 1 0 0 0 0] | No operation of MAP sensor |
5. Results and discussion
Processed vibration signals where divided in to three groups as follows: 70 % for network training, 15 % for validation and the remaining 15 % for testing. So 22 samples were used for training, 5 samples for validation and 5 samples for testing. The ANN design has been done by the use of M-file in MATLAB software package.
To extract different faulty signals from the engine the faults were made deliberately on the engine and then the signals were extracted by vibration analyzer. It must be emphasized that this network is only applicable to the engine type which it was trained for and it cannot be expanded to other engine types. But because this kind of engine is very popular in the country and it is used by many families in their vehicles, the designed fault classifier is comprehensive. It should be pointed out that it is possible to use the designed network for other types of engines if the signals were extracted from those different engines.
Fig. 11Performance of the network
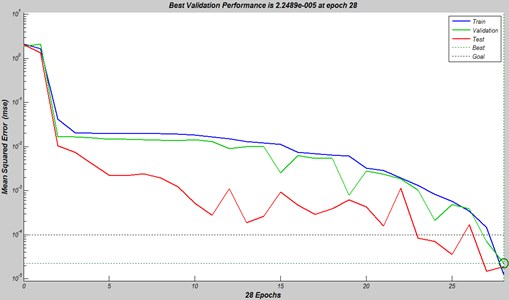
Fig. 11 shows performance of the ANN in terms of Mean Squared Error (MSE). This figure shows after 28 epochs the network error will reach its minimum value. This means the difference between output matrix and target matrix will reach its lowest value.
Table 3 shows some of the characteristic features of the designed network.
Table 3Characteristic features of the network
RMSE train | R2 train | MSE train |
2.25e-05 | 0.9999 | 1.50e-05 |
Values of MSE and RMSE near zero represent high performance of the network. R2 shows good correlation between actual data and network output which should be one for perfect correlation.
Considering Figs. 9 and 10 as well as Table 3 shows perfect performance for the designed network. The designed network is capable of detecting and classifying the different aforementioned faults perfectly.
6. Conclusions
Usage of ANN had an increasing trend for fault detection and monitoring in recent years. In this research a MLPNN has been designed and tuned for some common faults of internal combustion engines such as: malfunction of knock and manifold absolute pressure sensors, misfire and combination of these faults. The ANN with 1:43:8 structure with 100 % efficiency has been resulted. Since the aforementioned faults have considerable influence on increasing fuel consumption, pollution and engine damage, therefore using advanced techniques can have a tremendous effect in detecting the faults and preventing of the adverse effects of the faults. Also technician energy and time can be saved in maintenance affairs.
References
-
Rafiee J., Arvani F., Harifi A., Sadeghi M. H. Intelligent condition monitoring of a gearbox using artificial neural network. Mechanical Systems and Signal Processing, Vol. 21, 2007, p. 1746-1754.
-
Weidong Li, Robert M. Parkin, Joanne Coy, Fengshou Gu Acoustic based condition monitoring of a diesel engine using self-organizing map networks. Applied Acoustics, Vol. 63, 2001, p. 699-711.
-
Geng Z., Chen J. Investigation into piston-slap-induced vibration for engine condition simulation and monitoring. Journal of Sound and Vibration, Vol. 282, 2004, p. 735-751.
-
Shirazi F. A., Mahjoob M. J. Application of discrete wavelet transform (DWT) in combustion failure detection of IC engines. Proceedings of the 5th International Symposium on image and Signal Processing and Analysis, 2007.
-
Bao-jia Chen, Li Li, Xin-ze Zhao Fault diagnosis method integrated on scale-wavelet power spectrum, rough set and neural network. Proceedings of the International Conference on Wavelet Analysis and Pattern Recognition, Beijing, China, 2007.
-
Junxing Hou, Xinqi Qiao, Zhen Wang, Wei Liu, Zhen Huang Characterization of knocking combustion in HCCI DME engine using wavelet packet transform. Applied Energy, Vol. 87, 2009, p. 1239-1246.
-
Jian-Da Wua, Cheng-Kai Huang, Yo-Wei Chang, Yao-Jung Shiao Fault diagnosis for internal combustion engines using intake manifold pressure and artificial neural network. Expert Systems with Applications, Vol. 37, 2009, p. 949-958.
-
Yujun Li, Peter W.Tse, Xin Yang, Jianguo Yang EMD-based fault diagnosis for abnormal clearance between contacting components in a diesel engine. Mechanical Systems and Signal Processing, Vol. 24, 2009, p. 193-210.
-
Meng-Hui Wang, Kuei-Hsiang Chao, Wen-Tsai Sung, Guan-Jie Huang Using ENN-1 for fault recognition of automotive engine. Expert Systems with Applications, Vol. 37, 2010, p. 2943-2947.
-
Li-Fang Kong, Rong-Ling Shi, Zhang Tian, Wei Hao The vibration parameter fault diagnosis cloud model for automobile engine based on ANFIS. International Conference on Computational Intelligence and Software Engineering, Wuhan, 2010.
-
Vong C. M., Wong P. K. Engine ignition signal diagnosis with wavelet packet transform and multi-class least squares support vector machines. Expert Systems with Applications, Vol. 38, 2011, p. 8563-8570.
-
Jian-Da Wu, Cheng-Kai Huang An engine fault diagnosis system using intake manifold pressure signal and Wigner-Ville distribution technique. Expert Systems with Applications, Vol. 38, 2011, p. 536-544.
-
Brian D. Ripley Pattern Recognition and Neural Networks. Cambridge University Press, 2008.
About this article
Authors wish to express their gratitude to the personnel of R&D department of MEGA MOTOR Company for their cooperation. Especially Dr. Azadi the head of R&D department and engineers Mr. Tagharrobi, Mr. Hajari, Mr. Omidi and Mr. Mohammadi in the R&D laboratory.
