Abstract
Currently, much interior sound field research in car is based on the car body that many parts are missed, which is not consistent with the actual condition. In addition, the research results have not been verified by experiment; few things have been done in air tightness of car. In this paper, the full car model has been used to analyze the interior sound field in car, in order to simulate the actual condition accurately. Through the comparison between the analysis results and the experiment, there was a good agreement in full frequency hand. However, there was also a clear peak in 130 Hz that may cause roar; the reason was assumed to be sealing defects. After all the sealing defects were fixed, the sound pressure in the driver’s ear was measured again and compared to the results before. It was found that seal could reduce the sound pressure, which also means the sealing performance of car must be maximized when manufacturing. The contribution coefficient of each panel towards the sound pressure in the driver’s ear in 130 Hz has been calculated by using ATV method in this paper; the result showed that the top panel of car was the main reason for the existence of the clear peak in 130 Hz. Through the replacement of original interior decoration with compound sound package structure and the change of each layer’s properties, the sound package structure with the minimum transmission sound power has been found. The results showed that the combination of (3-4-1) sound package structure is optimal (which means the damping layer thickness was 3 mm, the porous material layer thickness was 4 mm and the viscoelastic cover layer thickness was 1 mm). Besides, the combination of the damping layer with new material has shown a better acoustic performance. This scheme has been used in the top panel of car and has apparently improved the sound pressure condition in the driver’s ear.
1. Introduction
The noise and vibration problem in a car has become the biggest factor to affect its ride comfort, which has also been raised to be a selling point of modern cars [1, 2].
The acoustic characteristics of car body panels can determine the interior sound field distribution in a car directly [3]. Therefore, which panel has the greatest impact on the interior sound field in a car can be determined through the analysis of body panel acoustic contribution; which has also been an important part and an effective mean in the process of car interior low-noise design. The combination of finite element method and boundary element method was used in reference paper [4] to analyze the acoustic contribution of car body panels, also providing reasonable advice for the arrangement of car body sound-absorbing material. Some in-depth research on panel contribution had been done, based on finite element method in reference paper [5]. There was also some research on panel contribution, based on boundary element method in reference paper [6].
The research on this issue started late in our country. Some researchers in Tongji University and the Northwestern Polytechnical University had done part of research on the relevant questions of car body panel contribution, shown in reference paper [3, 7-9]. On the other hand, there have been a lot of research in this area abroad (shown in reference paper [10-12]) which, however, are also questionable in the accuracy of their analysis models.
Many components were missed in the car body that these researches mentioned above based on, which is not consistent with the actual situation; furthermore, these research results have not been verified by the experiments. Therefore, an analysis of the car interior sound field (based on full-model car body) has been done in this paper, as well as the comparison of the simulation results and the experiment results which was used to verify and analyze the reliability of these results.
2. The verification of finite element model
The car body has a large and complex structure. Before starting the numerical simulation, it’s necessary to test out the experimental modal first. Through the comparison with the simulation modal, the reliability of the simulation model can be verified, after that, the follow-up studies can continue.
Before establishing the test bench, the plan to test the modal must be determined first, including three sub-plans shown below:
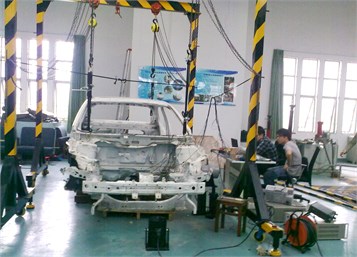
1) The suspension mode. A suspension system has been designed. Some rubber ropes which have greater flexibility were chose to hang the BIW to simulate its free state. The suspension points should be selected to minimize the negative impacts that this suspension system had on the test results. Therefore, the connection points of the front and rear suspension and the car body were chose as suspension points, shown in Fig. 1.
Fig. 1The suspension mode of BIW
2) The incentive mode. There were several rules to follow when choosing the incentive point position: In order to ensure the reliability of test results, suspension points and the modal shape node should not be incentivized. The incentives should be given on points which have greater rigidity. In that case, the incentive point in this experiment was chose to be near the left front suspension; the incentive direction is vertical.
3) The test points. The test points should be arranged to reflect the whole contour of the car as good as possible. More test points should be arranged in the areas that were sensitive or request more attention. In this experiment, there were 262 test points altogether, shown in Fig. 2.
After ensuring the correction of all the test conditions, the frequency response function of this structure can be tested out. The top 6 rigid modal of BIW can be fitted out, based on that function.
Through the comparison of the experimental modal and simulation results calculated on the basis of the gird model of BIW (shown in Fig. 3), a table of top 6 model parameters of BIW has been accomplished, shown in Table 1.
From the analysis of Table 1, it is easy to be seen that the relative error between the experiment results and simulation results are less than 5 %, which can meet the needs of engineering. The results also show that the finite element grid model is reliable, and can be used in the follow-up acoustic calculations. The top 6 modal shape of BIW is shown in Fig. 4.
Fig. 2Geometric measuring point model of BIW
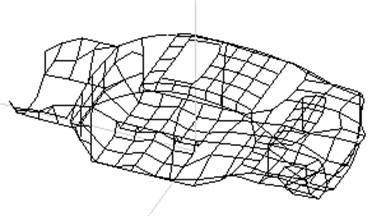
Fig. 3The grid model of BIW
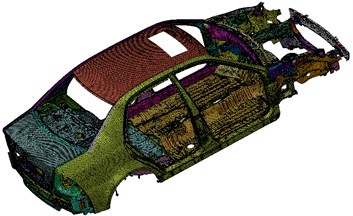
Fig. 4Top 6 modal shape of BIW
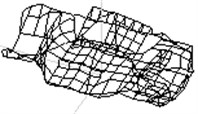
a) 28.93 Hz
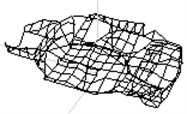
b) 36.09 Hz
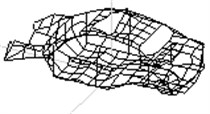
c) 47.53 Hz
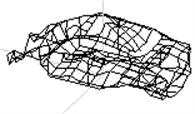
d) 54.91 Hz
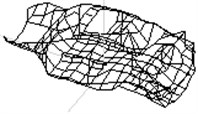
e) 62.14 Hz
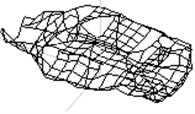
f) 66.34 Hz
Table 1Top 6 modal parameters of BIW
Order | Experiment results / Hz | Simulation results / Hz | Relative error | Mode description |
1 | 28.93 | 29.41 | 1.66 % | Whole car body one order reversing |
2 | 36.09 | 37.30 | 3.35 % | Whole car body one order bending |
3 | 47.53 | 49.45 | 4.04 % | Engine compartment, front fender |
4 | 54.91 | 56.34 | 2.6 % | The combination of bending and reversing |
5 | 62.14 | 63.58 | 2.32 % | Whole car body two order bending |
6 | 66.34 | 68.42 | 3.14 % | Whole car body two order reversing |
3. The research of interior sound field in car
Although the BIW model above proved to be reliable, many attachments are missed in this model. If this model is used to calculate the interior sound field in car, the calculation results will have a large deviation towards the actual condition. Therefore, all the attachments in car need to be added on the basis of the BIW grid model; the grid model of the full car has been divided after that. Due to the correction of the main model, it wouldn’t make too much deviation between the model and the actual condition by dividing some components apart. The grid model of the full car is shown in Fig. 5.
The driver’s position is the nearest position of the engine; the ride comfort of the driver can affect the security of all the people in the passenger room directly. It is necessary to analyze the response of field point sound pressure under force in the driver’s ear in order to do further optimization studies.
The interior parts in car are all equipped with sound-absorbing material on one side, and the impact of sound-absorbing material on the interior sound field can not be ignored.
According to some scientific researches, the sound absorption coefficient of the same material generally increases with the increase of frequency in a range. Therefore, the sound absorption coefficient varying linearly with frequency should be added on the ceiling and floor of the passenger room in the analysis, in order to simulate the actual condition more accurately.
Fig. 5The grid model of the full car
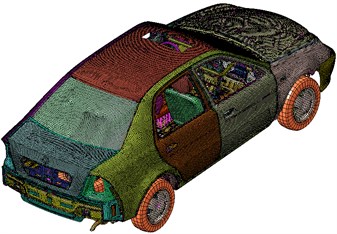
Fig. 6The grid model of sound field in car
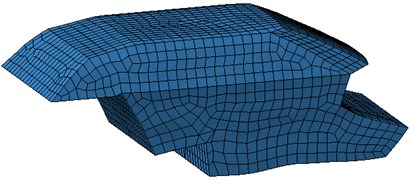
The thickness of the car body panels is relatively small, and would produce a certain coupling effect with the relatively larger interior space under sound pressure; this factor needs to be considered when doing numerical calculation.
In addition, the seats in car are wrapped with a thick layer of sound absorbing material on the frame, which also has a large impact on its interior sound field; this factor also needs to be taken into consideration when establishing the model. The whole interior sound field grid model in car is shown in Fig. 6.
During the test, the incentive force at three suspension points of the engine (under idle state) were measured and applied to the car body (shown in Fig. 5) as boundary conditions. Some coupling calculation has been done through finite element method and the sound pressure between 20-200 Hz in the driver’s ear has been achieved through simulation. Compared the simulation results with test results achieved by the microphone test device (shown in Fig. 7), the accuracy of this model can be analyzed. The comparison chart is shown in Fig. 8.
Fig. 7Test chart of sound pressure in the driver’s ear
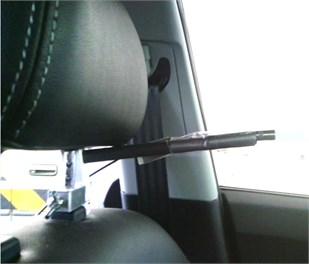
Fig. 8Comparison chart between experiment and simulation in the driver’s ear
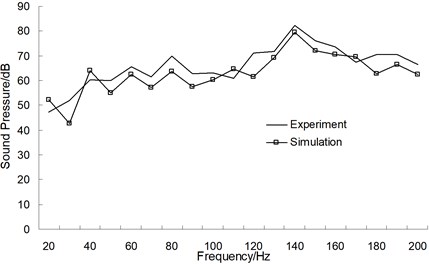
From the analysis of Fig. 8, the experiment and the simulation results have basically the same trends in the whole frequency band. In numerically, their biggest difference is less than 4 dB, which indicates that this simulation model can be used to predict the interior noise of car accurately.
Apart from this, no matter in experiment or simulation, the sound pressure has a relatively large peak in the frequency point of 130 Hz, which may cause some kind of roar and make the driver uncomfortable. Therefore, it appears to be very important to lower the sound pressure in this point. Besides, the experiment results are a little larger than the simulation results.
Because the simulation process used the grid model of a full car to simulate the actual condition, the error reason assumed to be some defects in the sealing of the car that makes sound leak out. In order to do further investigation, all the sealing defects were fixed (shown in Fig. 9). The sound pressure in the driver’s ear was measured again and compared to the test results before sealing. The comparison chart is shown in Fig. 10.
Fig. 9The sealed state chart of the full car
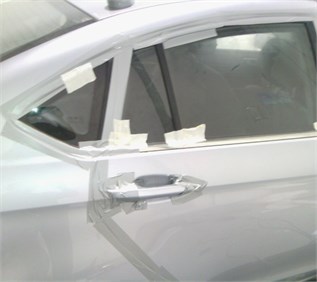
Fig. 10Sound pressure of the driver’s ear before and after seal
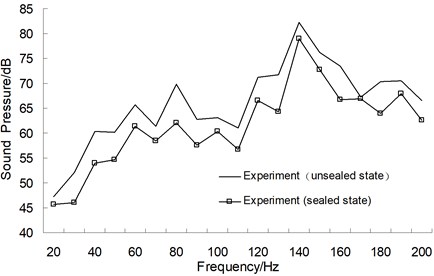
From the analysis of Fig. 10, the sound pressure has a significant improvement in full sealed state. Therefore, the sealing performance of the full car must be maximized when manufacturing. The result also verifies the conjecture before.
4. The panel contribution analysis of the interior sound field in car
Through the panel contribution analysis of the interior sound field in car, the origin of sound pressure in the driver’s ear can be accurately located; especially the part of panel that causes the vibration. The sound cavity of the analog cab was divided into 19 pieces, shown in Fig. 11, and every panel had been described as Table 2.
Fig. 11The division chart of sound cavity in car
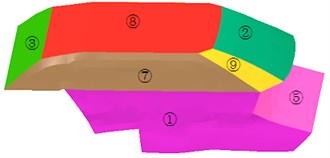
Table 2Positions of each panel number
Panel No. | Panel name | Panel No. | Panel name |
1 | Internal roof | 10 | Junction plate between luggage carrier top and back wall |
2 | Front windshield panel | 11 | Lower part of left side wall |
3 | Back windshield panel | 12 | Middle part of back wall |
4 | Upper part of front wall | 13 | Junction plate between front wall and windshield |
5 | Middle part of front wall | 14 | Luggage carrier top |
6 | Lower part of front wall | 15 | Upper part of left side wall |
7 | Upper part of right side wall | 16 | Upper part of back wall |
8 | Lower part of right side wall | 17 | Junction plate between upper part of left side wall and front windshield |
9 | Junction plate between upper part of right side wall and front windshield | 18 | Lower part of back wall |
19 | Passenger compartment floor | ||
The panel is a set of unit in the acoustic boundary element model, while the panel ’s sound pressure contribution towards one single point in the interior sound field is the sum of the contribution of all the cells included in the panel, as follows:
where is the total number of units, is the sound pressure contribution of unit :
where is the contribution of panel ; is the total number of units in panel .
Therefore, before starting the panel contribution analysis, it is very necessary to know the definition of , (unit vibration velocity in the acoustic BEM model) and the panel. The physical meaning of ATV can be understood as the sound pressure at certain field point caused by unit speed or node speed at a specific frequency, which can be directly solved by simulation. Besides, the unit vibration velocity in the acoustic BEM model can be obtained directly in calculation.
The contribution coefficient of panel vibration is defined as the contribution of a specific acoustic panel at point A (represented by ) divided by the total sound pressure at point A. Regarding point A as the position of the driver's left ear, the panel that has the largest contribution to the acoustic pressure can be determined in this way.
There is one fact needs to be clear; positive acoustic contribution coefficient means that the total sound pressure is positively correlated to the vibration velocity of the panel, while negative acoustic contribution coefficient means that the total sound pressure is negatively correlated to the vibration velocity of the panel.
Therefore, during the process of optimization, this information should be fully aware of. The acoustic contribution coefficient of all panels is shown in Fig. 12; the sound pressure contour at 130 Hz has been extracted and shown in Fig. 13.
Fig. 12The coefficient chart of panel contribution
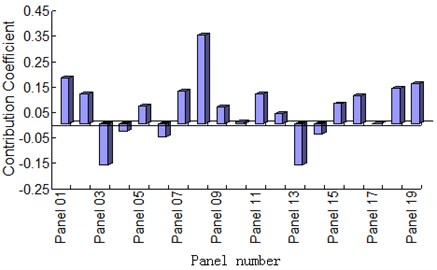
Fig. 13The sound pressure chart at 130 Hz
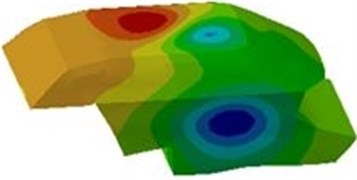
From the analysis of Fig. 12, panel 8 has the greatest sound pressure contribution in the driver’s ear. Panel 8 is the top panel of the car. The results obtained in Fig. 12 are further demonstrated in Fig. 13 as well. The radiated noise of a panel is proportional to the panel’s vibration velocity in vertical direction and its radiation area. It is easy to be seen from the position of all 19 panels in the car body that panel 8 is right on the top of the driver. Therefore, panel 8 has a relatively large radiation area and a large average vibration velocity in vertical direction, so that panel 8 has a bigger contribution coefficient.
5. The numerical optimization of interior sound field in car
After finding out which panel has the biggest contribution to the interior sound field in car, some measures need to be taken to reduce the sound pressure in the driver’s ear.
Since it costs a lot of expense and has a long design cycle to redesign the car structure, it is recommended to change the interior decoration on the top of the car to a complex sound package structure, which is shown in Fig. 14. There have been a lot of research about this structure abroad [13-15].
Fig. 14The schematic of sound package

All the layers of the sound package structure are defined as follows:
The body layer is also called the grassroots, which is 0.8 mm steel plate on the top of the body.
The damping layer usually uses viscoelastic material, according to experience, it is best to set the thickness to 2-4 mm. For the structure-borne sound, the main role of the damping layer is to improve damping and suppress body structure vibration. For the airborne sound, the main contribution of the damping layer is to increase quality. Based on the sound isolation mass law, while other attributes remain unchanged, the amount of sound isolation will increase about 6 dB when the area density doubles.
The porous material layer can be very useful in sound insulation, vibration isolation and sound absorption.
The viscoelastic cover layer is often manufactured with polymer material and high density filler, primarily used as fixed device and makes it easy to carry.
In order to maximize the decrease of noise in the driver’s ear, one steel plate (basic dimensions are 500×300×0.8 mm) was used in this paper and the sound package structure mentioned in Fig. 14 were laid on the plate. Through the changing of the original interior decoration, the properties of all layers were changed to obtain the structure which has optimal acoustic performance.
5.1. Replace original interior decoration with compound sound package
The original interior decoration in car is to paste one layer of damping material on the steel plate and paste one layer of sound absorbing skin on the damping material. Compared to the compound sound package structure shown in Fig. 14, there is one viscoelastic cover layer missing.
Through the numerical calculation of the transmission sound power under different structures, one comparison chart under different structures has been drawn, shown in Fig. 15.
From the analysis of Fig. 15, the transmission sound power using the sound package (shown in Fig. 14) is lower than the structure before.
Fig. 15The transmission sound power under different structures
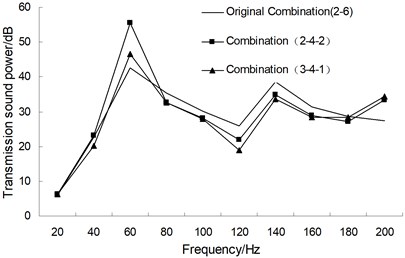
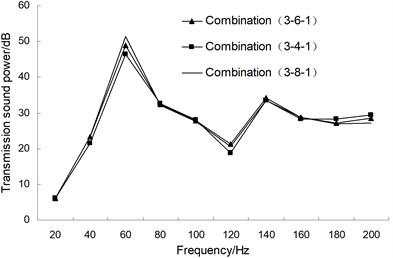
Fig. 16The transmission sound power under the porous material with different thickness
While the total thickness remained unchanged, through the changing of the thickness of both sides of the porous material layer, it was found that a better acoustic performance occurred when the thickness of the viscoelastic cover layer and the damping layer were different. It is mainly because that when they will have the same natural frequency under same thickness, and that may cause serious resonance at some point. For that reason, the combination of (3-4-1) was recommended to use.
5.2. Change the thickness of the porous material layer
While the thickness of other layers remained the same, the thickness of the porous material layer was changed from 4 mm to 8 mm. The single change step was 2 mm. The transmission sound power under the porous material with different thickness has been achieved and the comparison chart is shown in Fig. 16.
From the analysis of Fig. 16, the porous material layer with different thickness appears to have little disparities in the full frequency band; for the reason that the porous material layer mainly has effects in sound absorption, it can only have significant effects in high frequency.
Considering the premise of saving space inside the car, the thickness of the porous material layer was chose to be 4 mm.
5.3. Change the thickness of the damping layer and the viscoelastic cover layer
The properties of the damping layer material in the analysis above are as follows:
The material is now replaced with hard rubber with the following properties:
The transmissions sound power before and after the material replacements are compared in Fig. 17.
Fig. 17The transmission sound power before and after the material replacements
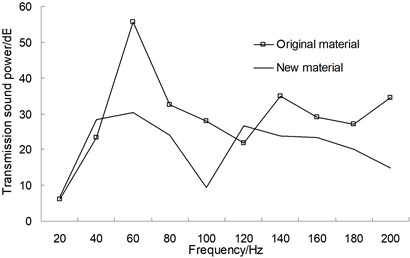
Fig. 18Comparison chart of sound pressure in the driver’s ear before and after optimization
From the analysis of Fig. 17, the transmission sound power has an apparently decrease after the new material replacement; besides, the thickness of the whole sound package has no change before and after the replacements. Therefore, this kind of material could be taken into consideration when facing actual application.
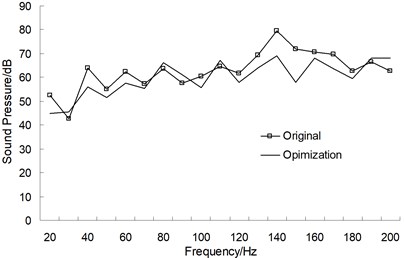
The combination of (3-4-1) sound package structure (shown in Fig. 14, the damping layer replaced with new material as an optimization) was applied to the top of the car to compare the sound pressure in the driver’s ear before and after the optimization. The comparison result is shown in Fig. 18.
From the analysis of Fig. 18, compared to the original state, the sound pressure in the driver’s ear has an apparently improvement using sound package; the ride comfort has increased as well.
6. Conclusions
1) Through the comparison of the experimental modal and the simulation modal, the relative error in each order is less than 5 %, which can meet the needs of engineering. The results also show that the finite element grid model is reliable and can be used in the follow-up acoustic calculations.
2) Through the full model numeric calculation of the sound pressure in the driver’s ear, compared to the experiment results, they have a good agreement, which indicates that this simulation model can be used to predict the interior noise of car accurately. However, no matter in experiment or simulation, the sound pressure has a relatively large peak in the frequency point of 130 Hz, which may cause some kind of roar and make the driver uncomfortable.
3) Through the fixing of all the sealing defects in the full car, the sound pressure in the driver’s ear has been measured again. Compared to the test results before, the sound pressure in full sealed state has a significant improvement in the entire frequency band. Therefore, the sealing performance of the full car must be maximized when manufacturing.
4) The sound cavity grid of the analog cab was divided into 19 pieces. The sound pressure contribution of all panels in the driver’s ear in the frequency point of 130 Hz were calculated by ATV method and found that the main reason leads to the sound pressure peak in this frequency was the panel on the top of the car.
5) Through the replacement of original interior decoration with compound sound package structure and the change of each layer’s property, the sound package structure with minimum transmission sound power has been found. The results showed that the combination of (3-4-1) sound package structure is optimal (stands for damping layer thickness of 3 mm, porous material layer thickness of 4 mm and viscoelastic cover layer of 1 mm). In addition, the combination of the damping layer and new material has shown a better acoustic performance. This scheme has been used in the top panel of the car and has apparently improved the sound pressure condition in the driver’s ear.
References
-
Pang Jian, He Hua Automotive Noise and Vibration. Press of Beijing Institute of Technology, Beijing, 2006, p. 7-16.
-
Beanes S. M., Marchi M. M., Snyder D. S. Utilizing optimized panel damping treatments to improve power-train induced NVH and sound quality. Applied Acoustics, Vol. 45, 1995, p. 181-187.
-
Jin Xiao-Xiong, Zhang Li-Jun Prediction and Control of Vehicle Noise. Tongji University Press, Shanghai, 2004, p. 105-112.
-
Mohanty A. R., Pierre B. D. S., Suruli-Narayanasami P. Structure-borne noise reduction in a truck cab interior using numerical techniques. Applied Acoustics, Vol. 59, Issue 1, 2000, p. 1-17.
-
Zhang Y. K., Lee M. R., Stanecki Paul, et al. Vehicle noise and weight reduction using panel acoustic contribution analysis. SAE Technical Paper 951338, 1995.
-
Citarella R., Federico L., CicatielloA. Model acoustic transfer vector approach in a FEM-BEM vibro-acoustic analysis. Engineering Analysis with Boundary Element, Vol. 31, Issue 3, 2007, p. 248-258.
-
Jin Xiao-Xiong, Bai Sheng-Yong, Ding Yu-Lan Computer simulation on acoustic contribution of vibrating body panels. Automotive Engineering, Vol. 22, Issue 4, 2000, p. 236-239.
-
Sun Wei, Chen Chang-Ming ATV and MATV approach in vehicle cab interior noise analysis. Auto Mobile Science and Technology, Vol. 6, 2007, p. 24-27.
-
Hui Wei, Liu Geng, Wu Li-Yan Vehicle noise prediction and panel acoustic contribution analysis. Noise and Vibration Control, Vol. 5, 2006, p. 62-66.
-
Lim T. C. Automotive panel noise contribution modeling based on finite element and measured structural-acoustic spectra. Applied Acoustics, Vol. 60, Issue 4, 2000, p. 505-519.
-
Lee S. K., Kim H. W., Na E. W. Improvement of impact noise in a passenger car utilizing sound metric based on wavelet transform. Journal of Sound and Vibration, Vol. 329, Issue 17, 2010, p. 3606-3619.
-
Lee S. K. Objective evaluation of interior sound quality in passenger cars during acceleration. Journal of Sound and Vibration, Vol. 310, Issue 1, 2008, p. 149-168.
-
Rhazi D., Atalla N. Transfer matrix modeling of the vibroacoustic response of multi-materials structures under mechanical excitation. Journal of Sound and Vibration, Vol. 329, Issue 13, 2010, p. 2532-2546.
-
Bertolini C., Courtois T. An SEA-based procedure for the optimal definition of the balance between absorption and insulation of lightweight sound package parts. Fuel Cells, 2012, p. 11-29.
-
Doutres O., Atalla N. Acoustic contributions of a sound absorbing blanket placed in a double panel structure: Absorption versus transmission. The Journal of the Acoustical Society of America, Vol. 128, Issue 2, 2010, p. 664-671.
