Abstract
A vortex-induced vibration experiment considers drilling conditions has not been conducted. A new experimental facility was designed to investigate effect of drilling pipe on vortex-induced vibration. Results show that vortex-induced vibration can be inhibited with the increasing drilling pipe tension. Strain amplitude decrease with the increase in drilling pipe tension and strain amplitude decreases significantly with increasing pipe tension at high current speed. Drilling pipe tension does not affect the dominant vibration frequency. Interaction between the IL and CF vibration and the multi-modal phenomenon are more apparent for the periodically contacting and colliding between the drilling pipe and risers.
1. Introduction
Flowing ocean currents induce vortex formation on both sides of a riser during deep-water drilling. These vortex-induced forces can increase riser vibration, and vortex shedding can cause the risers to vibrate in both in-line (IL) and cross-flow (CF) directions; this vibration is referred to as vortex-induced vibration (VIV). When the vortex shedding frequencies of the riser are close to its natural frequencies, vortex shedding “lock-in” occurs. Under such conditions, the vibration becomes more violent and causes significant fatigue of the risers, thereby resulting in destructive effects.
VIV is a typical nonlinear fluid-structure interaction problem. Several studies have focused on VIV over the past several decades. Vandiver et al. [1-3] did many work on VIV such as “lock-in” mechanisms, numerical model. Duggal et al. [4] described a method to estimate the displacement field of the riser in space and time. Williamson et al. [5-7] also did a great deal of work on VIV especially on low mass ratios and a cylinder with two degrees of freedom. Kaasen et al. [8] provided data based on full-scale measurements of the risers from the Norwegian Deepwater Program (NDP). Vikestad et al. [9] studied effect of added mass and oscillation frequency on VIV. Allen et al. [10, 11] studied surface roughness effect on VIV and discovered that the rough surface of the riser increase drag loads. Blackburn et al. [12] investigated the VIV through experiment and three-dimensional simulation and demonstrated that the 2P shedding mode on the lower response branch appeared in both numerical and physical results. Chaplin et al. [13] revealed VIV of a tension riser in a stepped current and compared with 11 different numerical models. Trim et al. [14] investigated the VIV of long marine risers by experiment which had the testing model with a length-to-diameter ratio of 1400. Marcollo et al. [15] found that an IL VIV can occur at low reduced velocities in a shear flow. Morse et al. [16] studied the effect of end conditions on VIV and discovered that the vibration amplitude was markedly higher in the absence of an endplate. Guo and Lou [17] carried out VIV experiment of the riser with internal flow and found that strain amplitude increased while the domination frequencies decreased with increase of internal flow speed. Franzini et al. [18] showed that the amplitudes of oscillation of the inclined cylinders were lower than that of the vertical cylinder. Raghavan and Bernitsas [19] investigated effect of Reynolds number on VIV of rigid circular cylinder.
Despite a number of related studies, a VIV experiment that considers drilling conditions has not been conducted. A system with a drilling pipe and drilling fluid inside the riser has rarely been considered. To investigate the effect of drilling pipe on the VIV of drilling risers, a new experimental facility was designed to simulate drilling conditions that involve circling internal drilling fluid, rotating drilling pipe, and varying drilling pipe tension. The instrumented riser was 8 m long and made of PVC, and the instrumented drilling pipe was also made of PVC. The riser was towed vertically in a deepwater offshore basin with varying drilling pipe tensions and current speeds. Various measurements were obtained by the fiber bragg grating (FBG) strain sensors on the riser, and the effect of drilling pipe on VIV was investigated.
Fig. 1Overview of the whole experimental setup
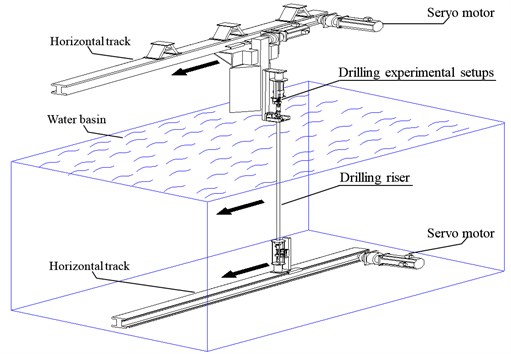
a) Simplified sketch of the setup
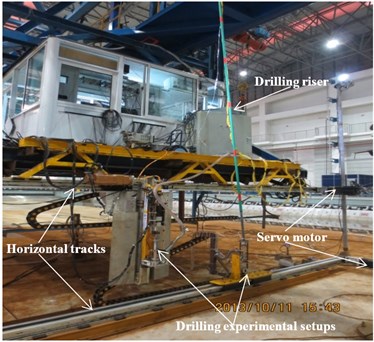
b) Physical experimental facility
2. Experiment
2.1. Experimental setup
The experiment was conducted in a deepwater offshore basin, which was 50 m long, 40 m wide, and 10 m deep, at the State Key Laboratory of Ocean Engineering. The experimental setup contained two horizontal tracks, drilling experimental setups, and one drilling riser model, as shown in Fig. 1(a) and an overview of the whole physical experimental facility is shown in Fig. 1(b).
One of the horizontal tracks was installed above the water surface, and another was installed at the bottom of the basin. The speeds of the two horizontal tracks were controlled in synchronization by servo motors to simulate uniform currents, as shown in Fig. 1(a).
Fig. 2(a) shows the assembled drilling experimental setups, which were mainly composed of one servo motor, two pneumatic sliders, one submersible pump, one drilling pipe, and so on. The whole drilling experimental setups were installed on the horizontal tracks, as shown in Fig. 1(a). The servo motor was located at the top, and the drill pipe model that was connected to the motor shaft through coupling was inside the riser. The instrumented riser was fixed vertically. Both ends of the riser were connected to the radial spherical plain bearings, which were fixed on pneumatic sliders. The pneumatic slider above the water surface can pull the riser up to exert riser tension, and the pneumatic slider under the water can pull the drilling pipe down to exert drilling pipe tension. Riser and drilling pipe tensions can be controlled by changing the pressure of the pneumatic slider. Both tee joints were connected to the radial spherical plain bearing and motive seal. Plastic hoses connected the tee joint above the water to the liquid turbine flowmeter and the tee joint under the water to the submersible pump. The drilling fluid speed can be determined by varying the pump power.
Fig. 2Drilling experimental setups and instrumentation of the riser model
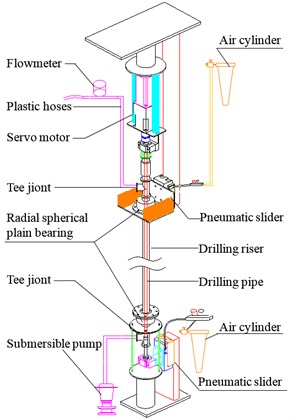
a) Drilling experimental setups
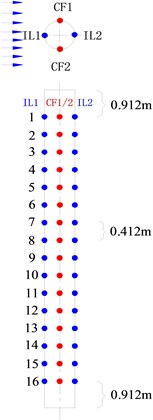
b) Instrumentation of the riser model
Table 1Main physical properties of the riser model
Item | Value |
Model length (m) | 8 |
Thickness (m) | 0.0025 |
Out diameter (m) | 0.025 |
Mass in air (kg∙m3) | 1570 |
Bending stiffness (N∙m2) | 36 |
Pretension (N) | 25 |
1st Natural frequency in water (Hz) | 0.45 |
2nd Natural frequency in water (Hz) | 1.18 |
3rd Natural frequency in water (Hz) | 2.11 |
The riser model was made of PVC; its main physical properties are listed in Table 1. The drilling pipe model was a solid bar that had an external diameter of 6 mm and was made of PVC. FBG strain sensors were mounted along the CF and IL directions of the riser to measure VIV responses. Sixteen locations were selected to instrument FBG strain sensors; the arrangements are shown in Fig. 2(b). “CF_1” and “CF_2” were used to capture the CF vibration, and “IL_1” and “IL_2” were used to capture the IL vibration. The sampling rate was 250 Hz.
2.2. Test content
In this paper, the current velocities were 0.1 and 0.2 m/s. The Reynolds numbers ranged from 2480 to 4960. Given this range, a fully turbulent vortex street was formed in the wake [20]. For each current, the riser tension was 25 N, and the drilling pipe tensions varied from 50, 75, to 100 N. All test cases are listed in Table 2.
Table 2Test cases
Group | A | B |
Case No. | 1-3 | 4-6 |
Current velocity (m/s) | 0.1 | 0.2 |
Riser tension (N) | 25 | 25 |
Drilling pipe tension (N) | 50, 75, 100 | 50, 75, 100 |
3. Data analysis
This paper analyzed only the strain caused by VIV. Constant pretension was imposed on the upper end of the riser before the test. The axial force of the riser varied periodically during the VIV. Accordingly, the measured strain of the CF direction had two parts: initial axial strain that resulted from the pretension and axial strain caused by the VIV. Therefore, the axial strain caused by the VIV in the CF direction can be calculated by:
where εVIV-CF is the axial strain caused by the VIV in the CF direction; εCF_1 is the axial strain caused by the VIV in the CF direction of “CF_1”; εCF_2 is the axial strain caused by the VIV in the CF direction of “CF_2”.
The measured strain of the IL direction had three parts: initial axial strain that resulted from the pretension, axial strain caused by initial drag force, and axial strain caused by the VIV. Therefore, the axial strain caused by the VIV in the IL direction can be calculated by:
where εVIV-IL is the axial strain caused by the VIV in the IL direction; εIL_1 is the axial strain caused by the VIV in the IL direction of “IL_1”; εIL_2 is the axial strain caused by the VIV in the IL direction of “IL_2”.
Thus, static deformation generated by the initial drag forces is eliminated.
The dominant vibration frequencies and corresponding strain amplitudes in the CF and IL directions can be determined from the results of strain time history as obtained through fast Fourier transform (FFT).
4. Results and discussion
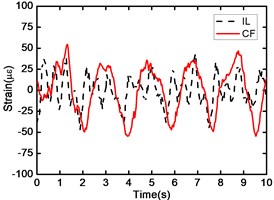
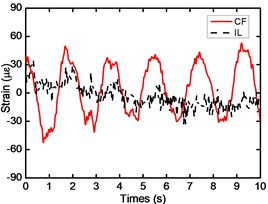
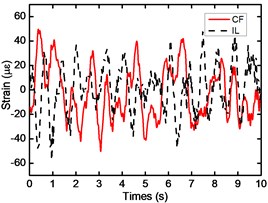
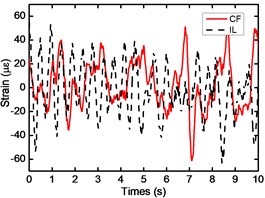
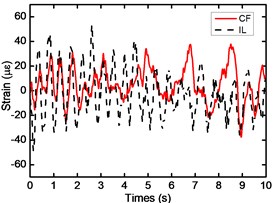
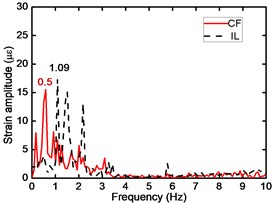
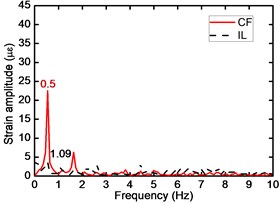
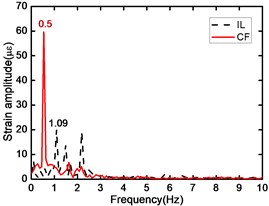
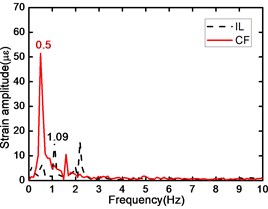
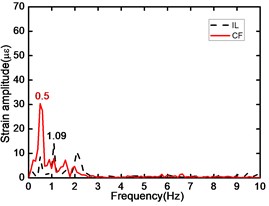
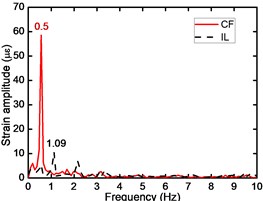
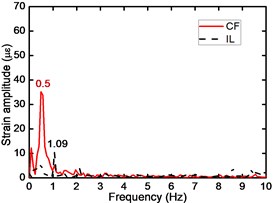
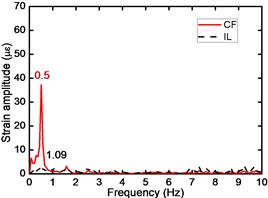
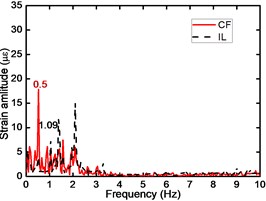
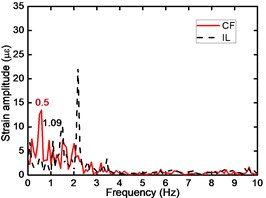
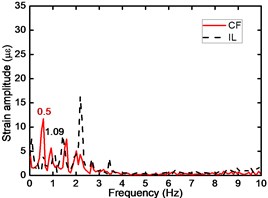
Fig. 3 depicts the strain time history at location #1, 4, 8, 13, 16 with the drilling pipe tensions of 50, 75, and 100 N at current speeds of 0.1 m/s, and Fig. 4 is the corresponding FFT spectrum. Fig. 4 shows the dominant frequencies of the drilling riser are 0.5 and 1.09 Hz in the CF and IL direction respectively. As the first order natural frequency is 0.48 Hz, and the second order natural frequency is 1.18 Hz. Thus, the first-order mode is the dominant vibration mode in both of the CF and IL direction. The amplitudes of vibration being close to the middle of the riser are highest and gradually decrease from the middle of the riser to the two fixed points in both of the CF and IL direction. Moreover, the vibrations become more instability from the middle of the riser to the two fixed points in both of the CF and IL direction. Consequently, the results of the strain amplitudes are consistent with this changes trend giving the drilling pipe tensions of 50, 75, 100 N as shown in Figs. 3(a), (c), (e), (g), (i), Figs. 3(b), (e), (h), (k), (n), and Figs. 3(c), (f), (i), (l), (o). The strain amplitudes in the IL direction are smaller than that in the CF direction. The phenomenon is caused by the fact that the shedding frequency approaches the riser’s natural frequency, the lock-in phenomenon will occur [23, 24]. Under this condition, the vibration will significantly increase. The CF dominant frequency is close to the riser’s first order natural frequency. Subsequently, the lock-in phenomenon dominate the riser’s vibration in the CF direction. However, the IL dominant frequency is far from the one order natural frequency and has not reach the second order natural frequency at the same time. Thus, the CF vibration is more significant than the IL vibration.
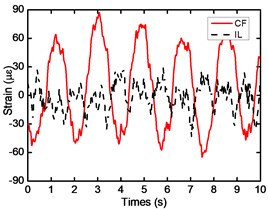
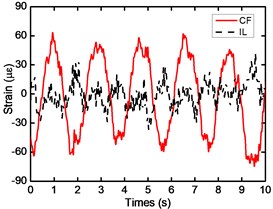
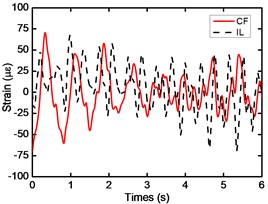
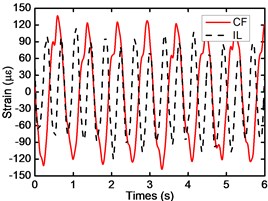
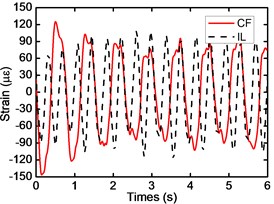
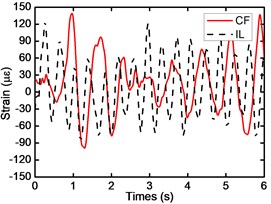
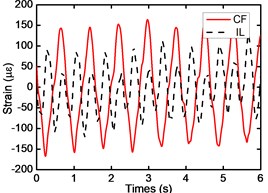
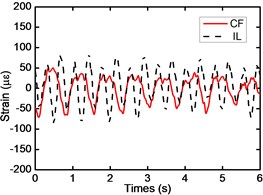
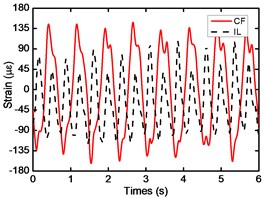
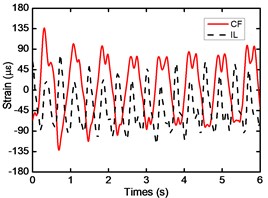
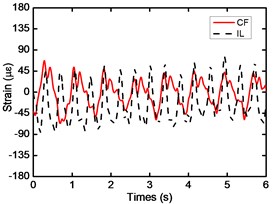
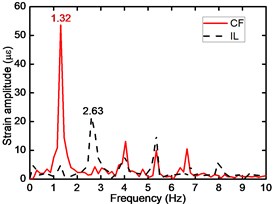
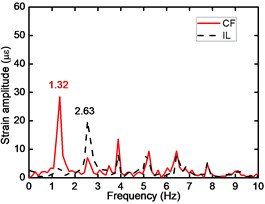
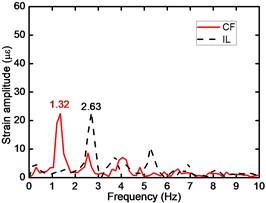
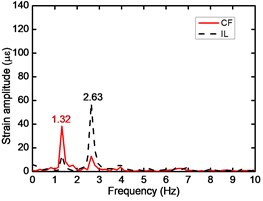
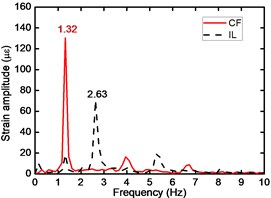
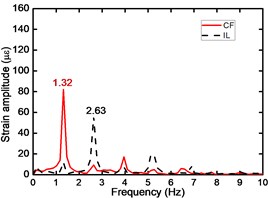
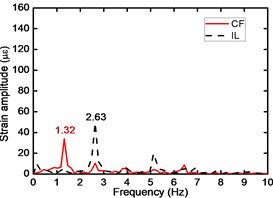
Fig. 5 depicts the strain time history at location #1, 4, 8, 13, 16 with drilling pipe tensions of 50, 75, and 100 N at current speeds of 0.2 m/s, and Fig. 6 is the corresponding FFT spectrum. Fig. 6 shows the dominant frequencies of the drilling riser are 1.32 and 2.63 Hz in the CF and IL direction respectively. The first order natural frequency is 0.48 Hz, the second order natural frequency is 1.18 Hz, and the third order natural frequency is 2.11 Hz. Thus, the second-order mode is the dominant vibration mode in the CF direction and the third-order mode is the dominant vibration mode in the IL direction. Consequently, the amplitudes of vibration being close to the location #4, 13 are the most significant in the CF direction, and the amplitudes of vibration approaching to the location #8 are the highest in the IL direction giving the drilling pipe tensions of 50, 75, 100 N as shown in Figs. 4(a), (c), (e), (g), (i), Figs. 4(b), (e), (h), (k), (n), and Figs. 4(c), (f), (i), (l), (o). However, the strain amplitudes in the CF direction have little differece with that in the IL direction and this phenomenon is different from the results at the current speed of 0.1 m/s in our experiment. The phenomenon is caused by the fact that the CF dominant frequency is 1.32 Hz and the IL dominant frequency is 2.63 Hz. They are similar with the second-order natural frequency (1.18 Hz) and third-order natural frequency (2.11 Hz). Thus, the lock-in phenomenon dominate the vibration both in the CF and IL direction [5, 6] and the strain amplitudes in the CF direction are similar with that in the IL direction.
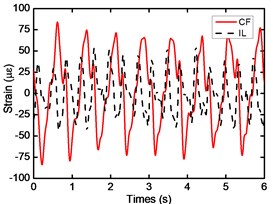
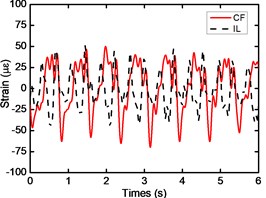
At the current speed V=0.1 m/s, a sawtooth waveform is observed in the lines of strain time history, and peaks in these lines are disorderly, as shown in Fig. 3. At a current speed of 0.2 m/s under similar test conditions, the strain amplitude increases, the lines of strain time history become smooth, and peaks in these lines are neat in Fig. 5. The phenomena indicate that the vibration is more stable and the strain amplitude increases with increasing current speed. This is because that increasing current speed enhances the drag and lift forces on the riser [14]. Effects on vibration of the riser from the current obviously increase. Therefore, increasing current speed enhances the strain amplitude, and vibration become more stable.
The vortex-induced vibration frequency is closely related to the vortex shedding frequency. As the vortex shedding frequency can be calculated by using the well known Strouhal relation, which is given as:
where fs is the vortex shedding frequency in Hz; St is the Strouhal number (St=0.18); V is the current speed in m/s; and D is the riser diameter in m. fs values are 0.72 and 1.44 Hz when V= 0.1 and 0.2 m/s, respectively. As presented in Fig. 4 and Fig. 6, the CF dominant vibration frequencies are 0.5 and 1.32 Hz at current speeds of 0.1 and 0.2 m/s. The first natural frequency is 0.48 Hz, and the second natural frequency is 1.18 Hz. These frequencies are very similar but not identical because the vortex shedding frequency obtained by using the Strouhal relation is only a reference frequency and not the actual vortex shedding frequency in the experiment. The value of fs in the Strouhal relation is associated with St, which is a variable number. The value of St is determined based on experience. Moreover, the dominant frequency is higher than the corresponding natural frequency. The difference in these frequencies is caused by the variation of real-time riser tension. The riser tension amplitude increased with the occurrence of the VIV and this increases the riser’s real-time natural frequency.
The riser is divided into 16 stations. As mentioned above, the variation trend in strain amplitudes and dominant frequency of the riser are consistent with the different drilling pipe tensions. At the same time, location #1 and 16 are close to the fixed points, location #4 and 13 approach the one quarter and three quarter of the riser, and location #8 is close to the center of the riser. Therefore, we investigate location #1, 4, 8, 13, 16 as an example to study effect of the changing drilling pipe tensions on VIV.
Figs. 3(a), (b), (c), Figs. 3(d), (e), (f), Figs. 3(g), (h), (i), Figs. 3(j), (k), (l), Figs. 3(m), (n), (o) and Figs. 5(a), (b), (c), Figs. 5(d), (e), (f), Figs. 5(g), (h), (i), Figs. 5(j), (k), (l), Figs. 5(m), (n), (o) displays the strain response at drilling pipe tensions of 50, 75, and 100 N and current speeds of 0.1 and 0.2 m/s. The lines of strain time history become rough, and sawtooth waveforms are observed when drilling pipe tension increases from 50 to 100 N. Thses figures also indicates that the decrease in strain amplitude with the increase in drilling pipe tension. These results demonstrate the vortex-induced vibration of drilling risers is inhibited under the influnce of the increasing drilling pipe tension. Under the effect of the current, the riser vibrates periodically in both IL and CF directions. This vibration thus influences the inner drilling pipe through contact and collision. In turn, the drilling pipe inhibits riser vibration. The function of the drilling pipe in the riser increases with the increase in drilling pipe tension; therefore, the effect of the drilling pipe on the riser is enhanced. As a result, riser strain decreases, and vibration is inhibited.
A comparison between Fig. 3 and Fig. 5 indicates that sawtooth waveforms are more obviously and the strain amplitude decreases significantly with increasing drilling pipe tension at a current speed of 0.2 m/s than at 0.1 m/s. This finding indicates that riser vibration is increasingly inhibited with increasing current speed. As mentioned previously, riser vibration increases with increasing current speed. Thus, the function of the drilling pipe in the riser increases at high current speed. Meanwhile, the functions of the drilling pipe and the riser increase with drilling pipe tension at the same current speed. Therefore, strain amplitude decreases significantly with increasing pipe tension at high current speed.
From a theoretical perspective [15, 17, 21, 22], only one peak value should be observed in the spectral figures. However, several peaks are observed in the FFT spectra of CF and IL as shown in Fig. 4 and Fig. 6. We can determine that several peaks were due to the interaction between the IL and CF vibration. These peaks appear at each other’s FFT spectrum for the influence of riser tension [15]. In addition, some peaks at high modal were observed which is the multi-modal phenomenon. However, the interaction between the IL and CF vibration and the multi-modal phenomenon are more apparent in our experiment. This phenomenon may be attributed to the influence of the drilling pipe because this pipe is inside the riser. The riser periodically contacts and collides with the drilling pipe under the effect of the current. This effect result in the instability of the vibration and variation of riser tension, and the effect is more significant with increasing drlling pipe tensions and current speed as show in Fig. 3 and Fig. 5. Consequently, the interaction between the IL and CF vibration and the multi-modal phenomenon are more apparent in our experiment as show in Fig. 4 and Fig. 6.
As shown in Fig. 4 to Fig. 6, the dominant CF and IL vibration frequencies are 0.5 and 1.09 Hz at current speeds of 0.1 m/s, and the dominant CF and IL vibration frequencies are 1.32 and 2.63 Hz at current speeds of 0.2 m/s, respectively, given drilling pipe tensions of 50, 75, and 100 N. The dominant vibration frequencies of IL in our experiment are almost twice those of CF, which agrees with the results of many studies. According to these findings and previous results [7, 20-22], vortices are alternately shed from the IL direction of the riser periodically, and the riser regularly vibrates in the IL direction. While vortices are alternately shed from both sides of the CF direction, the riser vibrates in the CF direction in a periodic. These results also show that drilling pipe tension does not affect the dominant vibration frequencies of the riser. Because dominant vibration frequency is determined by current speed and riser structure [20, 22]. The changes in drilling pipe tension do not alter riser structure and vortex shedding form. Therefore, they also do not affect the dominant vibration frequency of the riser.
Fig. 3Strain time history at location #1, 4, 8, 13, 16 with drilling pipe tensions of 50, 75, and 100 N at current speeds of 0.1 m/s: Td is the drilling pipe tension; and the red and black lines correspond to CF and IL directions
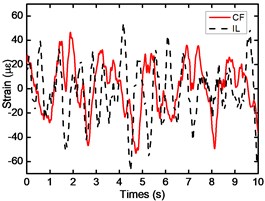
a) Location #1, Td=50 N
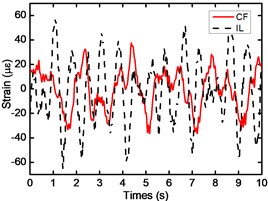
b) Location #1, Td=75 N
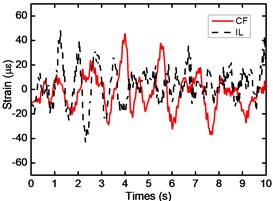
c) Location #1, Td=100 N
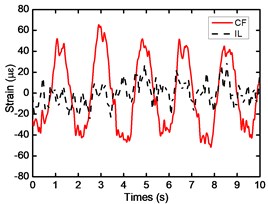
d) Location #4, Td=50 N
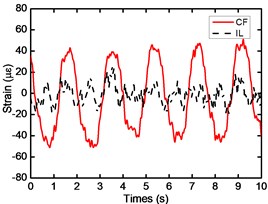
e) Location #4, Td=75 N
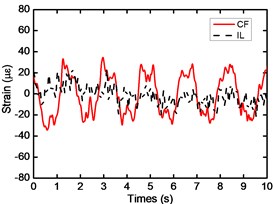
f) Location #4, Td=100 N
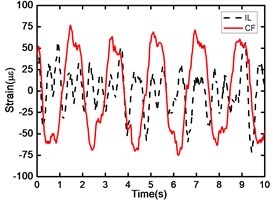
g) Location #8, Td=50 N
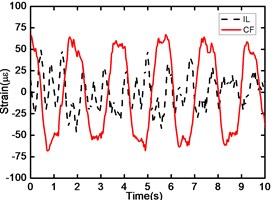
h) Location #8, Td=75 N
i) Location #8, Td=100 N
j) Location #13, Td=50N
k) Location #13, Td=75 N
l) Location #13, Td=100 N
m) Location #16, Td=50 N
n) Location #16, Td=75 N
o) Location #16, Td=100 N
Fig. 4Corresponding FFT spectrum at location #1, 4, 8, 13, 16 with drilling pipe tensions of 50, 75, and 100 N at current speeds of 0.1 m/s: Td is the drilling pipe tension; and the red and black lines correspond to CF and IL directions
a) Location #1, Td=50 N
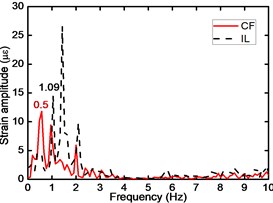
b) Location #1, Td=75 N
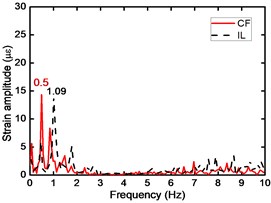
c) Location #1, Td=100 N
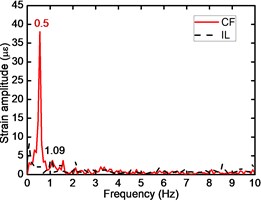
d) Location #4, Td=50 N
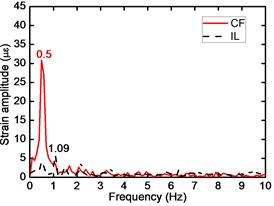
e) Location #4, Td=75 N
f) Location #4, Td=100 N
g) Location #8, Td=50 N
h) Location #8, Td=75 N
i) Location #8, Td=100 N
j) Location #13, Td=50 N
k) Location #13, Td=75 N
l) Location #13, Td=100 N
m) Location #16, Td=50 N
n) Location #16, Td=75 N
o) Location #16, Td=100 N
Fig. 5Strain time history at location #1, 4, 8, 13, 16 with drilling pipe tensions of 50, 75, and 100 N at current speeds of 0.2 m/s: Td is the drilling pipe tension; and the red and black lines correspond to CF and IL directions
a) Location #1, Td=50 N
b) Location #1, Td=75 N
c) Location #1, Td=100 N
d) Location #4, Td=50 N
e) Location #4, Td=75 N
f) Location #4, Td=100 N
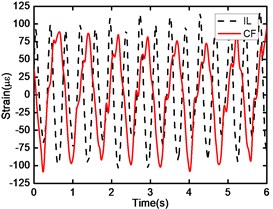
g) Location #8, Td=50 N
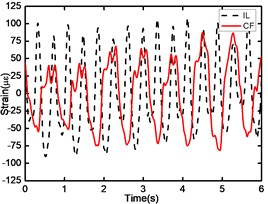
h) Location #8, Td=75 N
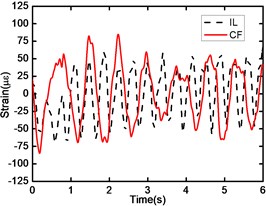
i) Location #8, Td=100 N
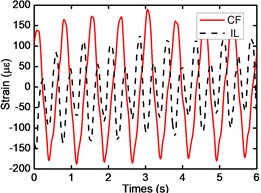
j) Location #13, Td=50 N
k) Location #13, Td=75 N
l) Location #13, Td=100 N
m) Location #16, Td=50 N
n) Location #16, Td=75 N
o) Location #16, Td=100 N
Fig. 6Corresponding FFT spectrum at location #1, 4, 8, 13, 16 with drilling pipe tensions of 50, 75, and 100 N at current speeds of 0.1 m/s: Td is the drilling pipe tension; and the red and black lines correspond to CF and IL directions
a) Location #1, Td=50 N
b) Location #1, Td=75 N
c) Location #1, Td=100 N
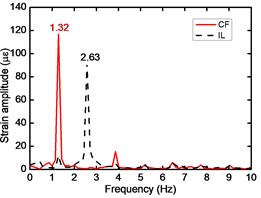
d) Location #4, Td=50 N
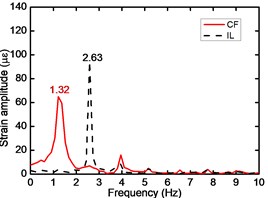
e) Location #4, Td=75 N
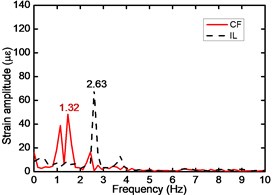
f) Location #4, Td=100 N
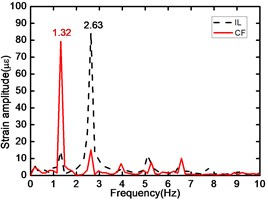
g) Location #8, Td=50 N
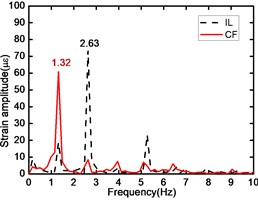
h) Location #8, Td=75 N
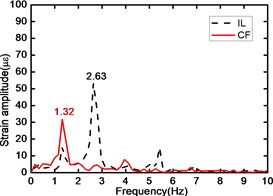
i) Location #8, Td=100 N
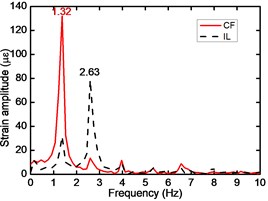
j) Location #13, Td=50 N
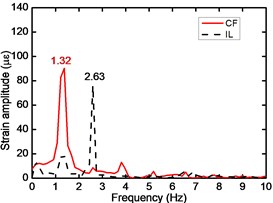
k) Location #13, Td=75 N
l) Location #13, Td=100 N
m) Location #16, Td=50 N
n) Location #16, Td=75 N
o) Location #16, Td=100 N
5. Conclusions
In summary, by processing the experiment data, severl conclusion are drawn as follws:
1) Vortex-induced vibration of drilling risers can be inhibited with the increasing drilling pipe tension.
2) Strain amplitude decrease with the increase in drilling pipe tension and strain amplitude decreases significantly with increasing pipe tension at high current speed.
3) The drilling pipe tension does not affect the dominant vibration frequency of the riser and the dominant vibration frequencies of IL are also twice those of CF under various drilling pipe tensions.
4) Interaction between the IL and CF vibration and the multi-modal phenomenon are more apparent for the periodically contacting and colliding between the drilling pipe and risers.
References
-
Vandiver J. K. Dimensionless parameters important to the prediction of vortex-induced vibration of long, flexible cylinders in ocean currents. Journal of Fluids and Structures, Vol. 7, Issue 5, 1993, p. 423-455.
-
Vandiver J. K., Allen D. W., Li L. The occurrence of lock-in under highly sheared conditions. Journal of Fluids and Structures, Vol. 10, Issue 5, 1996, p. 555-561.
-
Vandiver J. K. Predicting lock-in on drilling risers is sheared flows. Proceedings of the Flow-Induced Vibration Conference, Lucerne, Switzerland, 2000.
-
Duggal A. S., Niedzwecki J. M. Estimation of flexible cylinder displacements in wave-basin experiments. Experimental Mechanics, Vol. 35, Issue 3, 1995, p. 233-244.
-
Govardhan R., Williamson C. H. K. Vortex induced motions of a tethered sphere. Journal of Wind Engineering and Industrial Aerodynamics, Vol. 69-71, 1997, p. 375-385.
-
Govardhan R., Williamson C. H. K. Modes of vortex formation and frequency response for a freely vibrating cylinder. Journal of Fluid Mechanics, Vol. 420, 2000, p. 85-130.
-
Jauvtis N., Williamson C. H. K. Vortex-induced vibration of a cylinderwith two degrees of freedom. Journal of Fluids and Structures, Vol. 17, Issue 7, 2003, p. 1035-1042.
-
Kaasen K. E., Halvor L., Solaas F., Vandiver J. K. Norwegian deepwater program: analysis of vortex-induced vibrations of marine risers based on full-scale measurements. Offshore Technology Conference OTC No. 11997, Houston, Texas, USA, 2000.
-
Vikestad K., Vandiver J. K., Larsen C. M. Added mass and oscillation frequency for a circular cylinder subjected to vortex-induced vibrations and external disturbance. Journal of Fluids and Structures, Vol. 14, Issues 7, 2000, p. 1071-1088.
-
Allen D. W., Henning D. L. Surface roughness effects on vortex-induced vibration of cylindrical strucures at critical and supercritical reynolds numbers. Offshore Technology Conference OTC No. 13302, Houston, Texas, USA, 2001.
-
Allen D. W., Henning D. L., Li L. Performance comparisons of helical strakes for VIV suppression of risers and tendons. Offshore Technology Conference OTC No. 16186, Houston, Texas, USA, 2004.
-
Blackburn H. M., Govardhan R. N., Williamson C. H. K. A complementary numerical and physical investigation of vortex-induced vibration. Journal of Fluids and Structures, Vol. 15, Issues 3-4, 2001, p. 481-488.
-
Chaplin J. R., Bearman P. W., Cheng Y., Fontaine E., Graham J. M. R., Herfjord K., Huera Huarte F. J., Isherwood M., Lambrakos K., Larsen C. M., Meneghini J. R., Moe G., Pattenden R. J., Triantafyllou M. S., Willden R. H. J. Blind predictions of laboratory measurements of vortex-induced vibrations of a tension riser. Journal of Fluids and Structures, Vol. 21, Issue 1, 2005, p. 25-40.
-
Trim A. D., Braaten H., Lie H., Tognarelli M. A. Experimental investigation of vortex-induced vibration of long marine risers. Journal of Fluids and Structures, Vol. 21, Issue 3, 2005, p. 335-361.
-
Marcollo H., Hinwood J. B. On shear flow single mode lock-in with both cross-flow and in-line lock-in mechanisms. Journal of Fluids and Structures, Vol. 22, Issue 2, 2006, p. 197-211.
-
Morse T. L., Govardhan R. N., Williamson C. H. K. The effect of end conditions on the vortex-induced vibration of cylinders. Journal of Fluids and Structures, Vol. 24, Issue 8, 2008, p. 1227-1239.
-
Guo H. Y., Lou M. Effect of internal flow on vortex-induced vibration of risers. Journal of Fluids and Structures, Vol. 24, Issue 4, 2008, p. 496-504.
-
Franzini G. R., Fujarra A. L. C., Meneghini J. R., Korkischko I., Franciss R. Experimental investigation of vortex-induced vibration on rigid, smooth and inclined cylinders. Journal of Fluids and Structures, Vol. 25, Issue 4, 2009, p. 742-750.
-
Raghavan K., Bernitsas M. M. Experimental investigation of reynolds number effect on vortex-induced vibration of rigid circular cylinder on elastic supports. Ocean Engineering, Vol. 38, Issues 5-6, 2011, p. 719-731.
-
Blevins R. D. Flow Induced Vibration. Van Nostrand Reinhold Co., New York, 1990.
-
Williamson C. H. K., Roshko A. Vortex formation in the wake of an oscillating cylinder. Journal of Fluids and Structures, Vol. 2, Issue 4, 1988, p. 355-381.
-
Williamson C. H. K., Govardhan R. A brief review of recent results in vortex-induced vibrations. Journal of Wind Engineering and Industrial Aerodynamics, Vol. 96, Issue 6-7, 2008, p. 713-735.
-
Lyons G. J., Patel M. H. A prediction technique for vortex induced transverse response of marine risers and tethers. Journal of Sound and Vibration, Vol. 111, Issue 3, 1986, p. 467-487.
-
Sarpkaya T. A critical review of the intrinsic nature of vortex-induced vibrations. Journal of Fluids and Structures, Vol. 19, Issue 4, 2004, p. 389-447.
About this article
This work is supported by the National Natural Science Foundation of China Grant No. 51274171.
