Abstract
Pulse-like near-fault ground motions, which are characterized by the presence of a velocity pulse, can impose large demands in structures, and hence can potentially increase seismic collapse risk. One of the most important parameters affecting the structural demands under near-fault ground motions is the pulse period. The commonly used scalar intensity measure (IM), spectral acceleration at the fundamental period of the structure, Sa(T1), is demonstrated to be deficient, and also insufficient with respect to the pulse period, for predicting the structural collapse capacity under pulse-like ground motions. Furthermore, it is shown that the recently proposed IM, named INp, is not able to fully account for the effect of the pulse period. This study proposes an optimal integral-based IM, named ISa, for reliable seismic collapse assessment of structures subjected to pulse-like near-fault ground motions. ISa is the integral of the pseudo acceleration response spectrum over an optimal period range that is a function of the fundamental period and ductility of the structure. To propose the new IM, 15 generic frame structures with different fundamental periods and ductility classes were employed. The results indicate that ISa is significantly efficient, which causes reduction in the dispersion of structural collapse capacity, and also sufficient with respect to the pulse period and other ground motion characteristics for seismic collapse capacity assessment.
1. Introduction
Nowadays, nonlinear dynamic analysis has become a common method for evaluating the demands on structures under earthquake excitations. Thus, it is necessary to investigate the properties of ground motions that are strongly related to the structural response. A parameter that describes the strength of a ground motion and quantifies its effect on structures is called Intensity Measure (IM). In seismic performance assessment of structures, IMs link the ground motion hazard with the structural response, and using an appropriate IM plays an important role in the prediction of structural response or capacity. Therefore, studies continue to classify the existing IMs and also to propose new optimal IMs (e.g., [1-4]).
Pulse-like near-fault ground motions have two known characteristics: forward directivity and fling step. The propagation of rupture toward a site at a velocity close to the shear wave velocity is called ‘forward directivity’. This phenomenon causes a single large long-period pulse that occurs at the beginning of the record and contains most of the input energy from the rupture process. Commonly, the long-period pulse is likely to occur in the fault-normal direction at sites in the proximity of an active fault, where the rupture is propagating toward the site. The permanent static displacement in the fault-parallel direction for strike-slip faults or in the fault-normal direction for dip-slip faults is called ‘fling step’. Unlike the forward directivity that generates a dynamic two-sided velocity pulse, the fling step generates a one-sided velocity pulse [5-7].
Past studies that have investigated the effects of near-fault directivity on structures (e.g., [6-10]) indicate that pulse-like ground motions may cause large displacement and strength demands in structures, and hence can increase the risk of structural collapse compared with high amplitude far-field ground motions. Furthermore, due to the importance of the near-fault effects on structures, some researchers have tried to simulate near-fault ground motions consisting of forward directivity or fling step effects (e.g., [11]). As mentioned by Tothong and Cornell [7], the two-sided pulse caused by the forward directivity is more damaging than the one-sided pulse caused by the fling step. Hence, this study focused on the forward directivity from the fault-normal component of near-fault ground motions. In these ground motions, the period of the velocity pulse (Tp) is an important parameter affecting the structural response [6, 10, 12, 13], and its effect is not properly described by common IMs such as spectral acceleration at the fundamental period of the structure, Sa(T1).
In Performance-Based Earthquake Engineering (PBEE) framework [14], the properties of an optimal IM are as follows: efficiency, that is, the ability of an IM to predict the response or capacity of a structure subjected to ground motion records with small dispersion [15]; sufficiency, which is the ability of an IM to render the structural response or capacity conditionally independent of earthquake characteristics such as magnitude (M), source-to-site distance (R), and in near-fault ground motions the pulse period (Tp); scaling robustness, which represents sufficiency with respect to scale factor (SF); and predictability, that is, having a reliable ground motion prediction equation [2].
Since one of the most important parts of the PBEE is assessing the seismic collapse safety of structures, this issue is an interesting field of study for researchers (e.g., [16, 17]). Recently, several studies have focused on improving the reliability of seismic collapse assessment procedures by employing advanced IMs, and also some advanced ground motion selection methods (e.g., [18, 19]). Incremental Dynamic Analysis (IDA) [20] is a powerful analytical method to obtain the seismic collapse capacity of structures. This method involves subjecting a structural model to several ground motion records, each scaled to multiple levels of intensity, measured by an IM, until it causes collapse. When traditional IMs such as peak ground acceleration (PGA) or Sa(T1) are used for collapse capacity prediction, the collapse capacity values can display large record-to-record variability (dispersion), forcing the use of many records to achieve reliable results [15]. However, by employing an optimal IM, more reliable results with lower dispersion and bias can be achieved. In this study, the performance of the commonly used IM, Sa(T1), and the IM recently proposed by Bojórquez and Iervolino [3], INp, was investigated for collapse capacity prediction of structures under pulse-like near-fault ground motions. To improve the shortcomings of Sa(T1) and INp, an optimal integral-based IM, ISa, which increases the efficiency and decreases the potential bias due to the pulse period, was proposed.
2. Considered intensity measures
In this study, Sa(T1) and INp were considered as IMs for collapse capacity prediction of structures. INp is defined as follows [3]:
Np=Saavg(T1…TN)Sa(T1),
where Saavg(T1…TN) is the geometric mean of spectral accelerations over the period range of T1-TN (TN=2T1). To propose an optimal IM, the integral of the pseudo acceleration response spectrum over an optimal period range, which is a function of the fundamental period and ductility of the structure, was also considered as a scalar IM:
where PSA(T,5%) is the 5% damped pseudo spectral acceleration at vibration period T, T1 is the fundamental period of the structure, and α and β are coefficients to be determined based on the structural characteristics such as fundamental period and ductility. PSA(T,5%), which is often shortened to spectral acceleration at vibration period T, Sa(T), can be obtained as follows:
where Sd(T,5%) is the ordinate of the 5% damped displacement response spectrum at vibration period T. Displacement response spectrum is a plot of the maximum displacement response of single-degree-of-freedom (SDOF) systems with various natural periods when subjected to an earthquake ground motion [21]. The damping ratio of the SDOF systems is commonly assumed to be equal to 5%.
Since the major aim of proposing an IM is applying it in PBEE, a proposed IM should be predictable (should have a reliable ground motion prediction equation) to be able to link the structural response estimates with the seismic hazard. Tothong and Cornell [7] proposed an IM for seismic performance assessment of structures under near-fault excitations, which needs a first-order Taylor-series expansion to be predictable. But as mentioned by Bradley et al. [2], using Taylor-series expansion causes inaccuracy due to the large uncertainty in ground motion prediction equations. In this study, to propose ISa as an optimal IM the predictability criterion was considered. Therefore, knowing that ISa is the integral of the pseudo acceleration response spectrum over a specific period range, the ground motion prediction equation for this integral-based IM can be obtained from the ground motion prediction equations for spectral acceleration using the method proposed by Bradley [22].
3. Structural models and method of analyses
Because of the need for generality of the results, and hence, of the proposed IM, the structural models of two-dimensional generic one-bay frames designed by Medina and Krawinkler [23], and also used by Ibarra and Krawinkler [24] were employed for the analyses. The study performed by Medina and Krawinkler [23] showed that one-bay generic frames are generally adequate to capture the global behavior of multi-bay frames. The considered generic frames have different number of stories, N=3, 6, 9, 12 and 15, and fundamental periods, T1, equal to 0.1N. The structural models were created with the OpenSees software [25]. For nonlinear time history analyses, 5 % rayleigh damping was assigned to the first mode and the mode at which the cumulative mass participation exceeds 95 %. The P-Δ effect was considered for modeling, and nonlinear behavior was modeled by using rotational springs at both beam ends and the bottom end of the first-story columns. Bilinear model [26] was used to specify the nonlinear moment-rotation behavior of the rotational springs, and cyclic deterioration was neglected. For each member, the post-yield and negative post-capping stiffness ratios of 0.03 and –0.1 were assumed, respectively. To account for the effect of ductility in proposing an optimal IM, three member ductility capacity values, δc/δy=2, 4 and 8, were considered as the representatives of low-, intermediate- and high-ductile structures, respectively. Thus, a total number of 15 generic frame structures (5 structures for each ductility class) were considered.
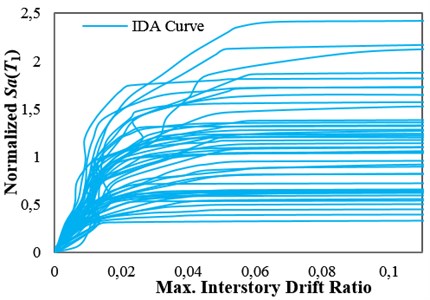
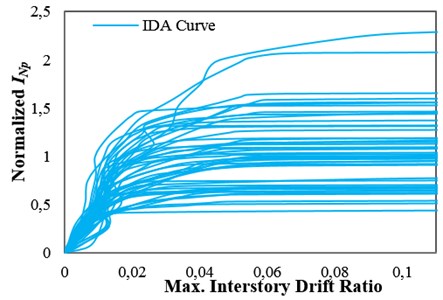
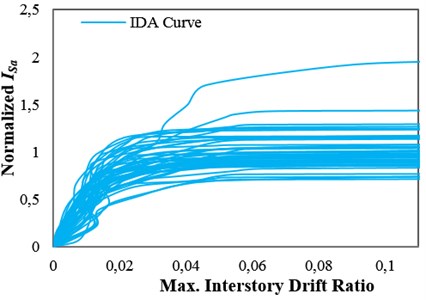
A set consisting of 48 pulse-like records rotated to the fault-normal direction with a minimum usable frequency less than 0.2 Hz, extracted from the pulse-like near-fault ground motion record set used by Tothong and Cornell [27], was selected for the analyses. The selected ground motion records were taken from the PEER NGA database [28]. To obtain the collapse capacities of the structures, IDAs were performed by using the selected ground motion set. The amplitude of each ground motion in the set, measured by an IM, was scaled to an increasing intensity until it causes collapse. Engineering Demand Parameter (EDP) was considered to be the maximum interstory drift ratio, and collapse was assumed to take place when the dynamic instability occurs and the IDA curve becomes flat [29]. Thus, the collapse capacity corresponding to each ground motion record, IMcol, was obtained. In the IDA approach, the Hunt and Fill algorithm [20] was used to obtain the collapse capacities corresponding to all of the ground motion records. The results of IDAs for the high-ductile 12-story structure considering different IMs are presented in Fig. 1(a)-(c). The IDA curves were normalized by the median of the collapse capacity values calculated by considering each IM (more details about the IDA curves are discussed in Section 4).
Fig. 1IDA curves for the 12-story structures with δc/δy= 8 with obtained by employing: a) Sa(T1), b) INp and c) ISa with the integration period range of 0.74T1–4.3T1
a)
b)
c)
The probabilities of collapse at different IM levels, which can be represented with a collapse fragility curve, can be calculated by fitting a lognormal distribution to the IMcol values [27]:
where Φ() is the cumulative distribution function (CDF) of the standard Gaussian distribution; μlnIMcol and σlnIMcol are the estimated logarithmic mean and standard deviation of the collapse capacity, IMcol.
4. Efficiency of the IMs for collapse capacity prediction
It should be noted that when using an IM to estimate the IMcol values by the IDA approach, the observed collapse capacity dispersion, σlnIMcol, is closely connected to the IM employed. An IM is more efficient for collapse capacity prediction if it indicates a lower σlnIMcol value [15]. The use of an efficient IM for seismic performance assessment of structures increases the reliability of the assessment. In other words, using an efficient IM can considerably reduce the number of analyses required for the estimation of structural response or capacity with a given accuracy. The values of collapse capacity dispersion, σlnIMcol, obtained by considering Sa(T1) and INp as IMs for collapse capacity prediction of the generic frame structures are presented in Table 1. This table shows that using INp for collapse capacity prediction causes reduction in the dispersion of collapse capacity for all of the structures with different ductility classes, when compared with using Sa(T1). Fig. 1(a) and (b) show the IDA curves of the high-ductile 12-story structure obtained by employing Sa(T1) and INp, respectively. It can be seen that using INp as an IM causes reduction in the dispersion of structural collapse capacity when compared with using Sa(T1).
Applying the integral of the pseudo acceleration response spectrum over an optimal period range, ISa, as an IM can considerably reduce the dispersion of structural collapse capacity. For example, Fig. 1(c) illustrates that considering the period range of 0.74T14.3T1 for ISa in the case of the 12-story structure with δc/δy=8 leads to a more efficient IM than Sa(T1) and INp for collapse capacity assessment of this structure. It is obvious that the optimal period range varies by varying the fundamental period and ductility of the considered structure. In Section 6, the optimal period ranges for ISa considering the generic frame structures with different fundamental periods and ductility classes are obtained.
Table 1Values of collapse capacity dispersion, σln IMcol, obtained for the generic frames
No. of stories | IM=Sa(T1) | IM=INp | ||||
δc/δy | δc/δy | |||||
2 | 4 | 8 | 2 | 4 | 8 | |
3 | 0.273 | 0.315 | 0.380 | 0.223 | 0.265 | 0.323 |
6 | 0.366 | 0.370 | 0.432 | 0.274 | 0.275 | 0.345 |
9 | 0.405 | 0.428 | 0.479 | 0.318 | 0.332 | 0.385 |
12 | 0.375 | 0.424 | 0.475 | 0.285 | 0.335 | 0.378 |
15 | 0.329 | 0.356 | 0.427 | 0.232 | 0.260 | 0.332 |
The standard error of the collapse capacity associated with a sample of size n (number of ground motion records) can be expressed as:
where σlnIMcol is the logarithmic standard deviation of the collapse capacity. Based on Eq. (5), by applying a more efficient IM, the number of ground motion records, n, can be reduced while the standard error remains the same, which means that lower effort and computational expense are needed for performance assessment.
5. Sufficiency of the IMs
A sufficient IM produces the same distribution of demands and capacities independently of the ground motion selection [15]. The sufficiency of an IM for collapse capacity prediction means that the distribution of collapse capacity, obtained by using the IM, is independent of ground motion characteristics such as earthquake magnitude (M) and source-to-site distance (R). In pulse-like near-fault ground motions, the pulse period (Tp) is the most important ground motion characteristic that can considerably affect the structural response. Neglecting the pulse period effect in seismic performance assessment of structures under pulse-like ground motions can make the structural response and collapse capacity estimates biased [10, 13]. Because the distribution of collapse capacity is obtained from the results of a finite number of IDAs, sufficiency is one of the important properties of an optimal IM. If this distribution is dependent on the M, R and Tp values of the ground motions used, then the distribution will be biased if the distribution of M, R and Tp of the ground motions used in the IDAs is not the same as that of the ground motions which will occur at the site in the future [2]. In addition, scaling robustness represents sufficiency with respect to scale factor (SF). Scaling robustness results in the unbiased prediction of structural response or capacity when the records are linearly scaled to perform structural analyses. As pointed out by Bojórquez and Iervolino [3], sufficiency of an IM is important because a sufficient IM can be used in the probabilistic structural assessment decoupling the hazard and structural analysis.
To examine the sufficiency of an IM with respect to M, R, SF and Tp for predicting the collapse capacity of structures, linear regression can be performed between these parameters and the observed collapse capacities from the IDAs by using the following equation:
where μlnIMcol is the expected value of lnIMcol; b0 and b1 are coefficients to be estimated from linear regression; and x is one of the parameters M, lnR (natural logarithm of source-to-site distance), lnSF and Tp. Because the linear regression is based on a finite number of observations, it is essential to use statistical tests to determine the significance of the coefficient b1. Assuming a Student-t distribution for the coefficient b1, the F-test can be used to determine the statistical significance of b1 [30]. In general, a p-value less than 0.05 from the F-test indicates that the slope of the linear regression, b1, is a statistically significant value, which represents the insufficiency of the IM with respect to x for collapse capacity assessment.
5.1. Sufficiency of the IMs with respect to M, R, and SF for collapse capacity prediction
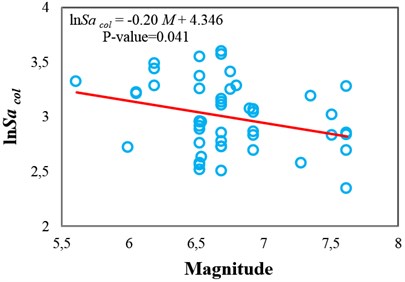
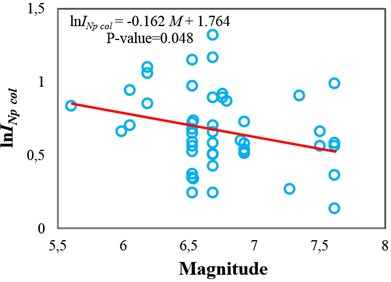
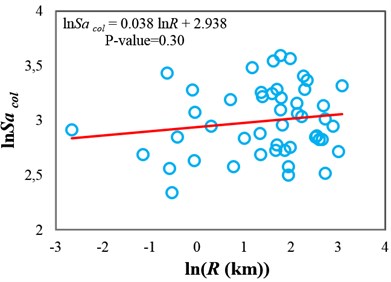
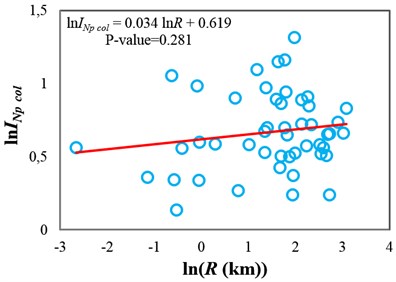
The sufficiency of Sa(T1) and INp with respect to M and R for collapse capacity prediction of the intermediate-ductile 3-story structure (δc/δy=4) is tested in Fig. 2 and 3, respectively. It can be seen that these IMs are insufficient with respect to M because the p-values from the F-test are less than 0.05, whereas they are sufficient with respect to R because the corresponding p-values are greater than 0.05. In other words, these IMs are unable to fully account for the effect of magnitude, and thus, for reliable seismic collapse assessment of this structure by using Sa(T1) or INp, the magnitude of ground motions should be considered in the ground motion selection procedure. But the source-to-site distance of ground motions is not necessary to be considered as a determining factor in ground motion selection. As an alternative, the use of a sufficient IM with respect to M can eliminate the need to consider magnitude as an important criterion in the ground motion selection procedure for seismic analyses.
Fig. 2Testing the sufficiency of Sa(T1) and INp with respect to magnitude for collapse capacity prediction of the 3-story structure (δc/δy= 4): a) Sa(T1) and b) INp
a)
b)
Fig. 3Testing the sufficiency of Sa(T1) and INp with respect to source-to-site distance for collapse capacity prediction of the 3-story structure (δc/δy= 4): a) Sa(T1) and b) INp
a)
b)
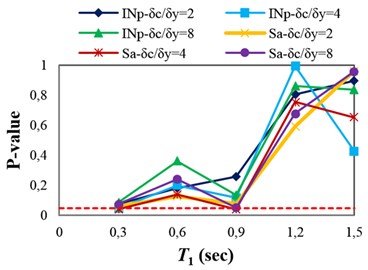
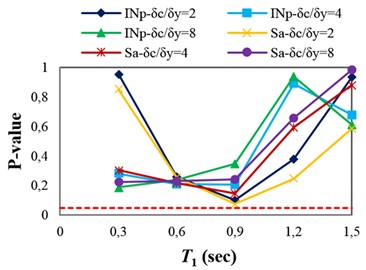
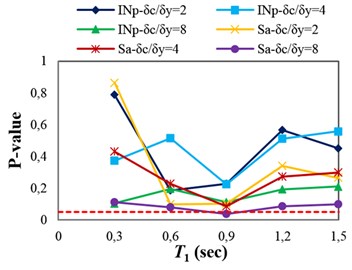
The p-values obtained from testing the sufficiency of Sa(T1) and INp with respect to M, R and SF for collapse capacity prediction of the structures are presented in Fig. 4(a)-(c), respectively. Fig. 4(a) indicates that Sa(T1) and INp in some points (structures), which the p-values are marginally less than 0.05 (indicated by dashed line), are insufficient with respect to magnitude. In Fig. 4(b), it can be seen that Sa(T1) and INp are sufficient with respect to source-to-site distance for all of the structures. It can therefore be inferred that in the case of structures subjected to near-fault ground motions, neglecting earthquake characteristics such as magnitude and source-to-site distance often does not cause significant bias in the collapse capacity estimates. In fact, Sa(T1) and INp can account for the effects of source-to-site distance and magnitude (marginally for magnitude). Investigating the sufficiency of Sa(T1) and INp with respect to scale factor (see Fig. 4(c)) indicates that in the high-ductile structures unlike INp, Sa(T1) may slightly cause insufficiency for predicting the structural collapse capacity.
5.2. Sufficiency of the IMs with respect to Tp for collapse capacity prediction
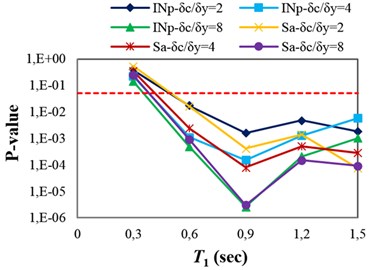
A sufficient IM for seismic collapse capacity assessment of structures under pulse-like near-fault ground motions should be able to account for the effect of Tp. The pulse period, Tp, is defined as the period associated with the global peak of the velocity response spectrum (Sv) [7, 31]. As described earlier, the dependence of the structural collapse capacity on the pulse period can be investigated by linear regression (see Eq. (6)). Therefore, the p-value for b1, obtained from the F-test, can be used as an indicator of the IM sufficiency with respect to Tp. The p-values obtained from testing the sufficiency of Sa(T1) and INp with respect to Tp for collapse capacity prediction of the structures are presented in Fig 4(d). It can be seen that predicting the collapse capacity for most of the structures, except the 3-story structures, is dependent on Tp. In other words, using Sa(T1) or INp as an IM causes the seismic collapse capacity assessment of the structures to be biased with respect to Tp.
Fig. 4P-values obtained from testing the sufficiency of Sa(T1) and INp with respect to different parameters for collapse capacity prediction of the structures: a) M, b) R, c) SF and d) Tp
a)
b)
c)
d)
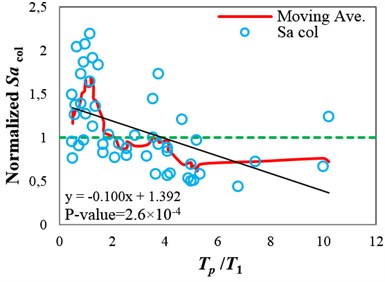
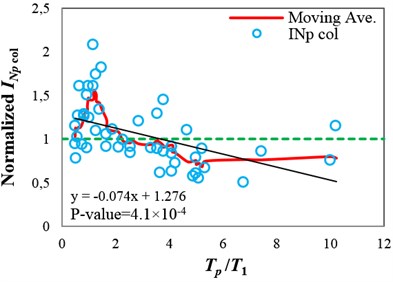
Fig. 5(a)-(c) show the collapse capacity values obtained using different IMs, normalized by their median, versus Tp/T1 values for the intermediate-ductile 9-story structure. In these figures, for illustrating the dependency of the collapse capacity values on Tp, moving average and also in a simple manner linear regression are applied. The shape of the moving average curve, calculated by averaging the point of interest with the four previous and four subsequent data points, implies the impact of the pulse period variations on the structural collapse capacity. It can be seen that the collapse capacity values obtained using Sa(T1) and INp are dependent on Tp. As shown in Fig. 5(a) and (b), when the pulse period is approximately equal to the fundamental period of the structure (Tp/T1≈1), the highest collapse capacities are observed, which means that the structure is least susceptible to seismic collapse. Since the resonance phenomenon for linear-elastic structures occurs when the dominant period of the excitation is close to the fundamental period of the structure, the coincidence of the period associated with the peak of the moving average curve with the fundamental period of the structure may appear to be irrational. The reason for this coincidence is that when a structure subjected to a ground motion is near collapse, its period elongates considerably due to severely nonlinear responses. Consequently, the collapse capacity of the structure is dependent on the spectral components in the period range of the near-collapse period far away from T1, and hence pulse-like records with Tp/T1>1 cause more severe damages in the structure, which correspond to lower collapse capacity values. This issue has also been mentioned by Champion and Liel [10].
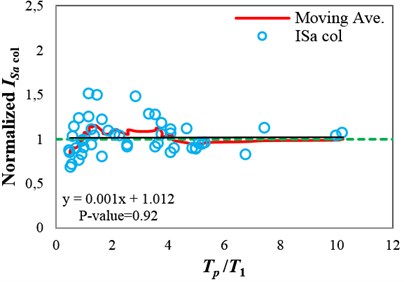
Fig. 5Normalized collapse capacity values obtained using different IMs versus Tp/T1 values, and the corresponding moving average curves calculated for the 9-story structure (δc⁄δy= 4): a) SaT1, b) INp and c) ISa with the integration period range of 0.82T13.9T1
a)
b)
c)
In Fig. 5, the area (in absolute values) between the moving average curve and the horizontal dashed line, indicating the median for each IM, can be a representative of the bias due to the pulse period existing in the IMcol values. Therefore, to propose an optimal IM that satisfies the sufficiency with respect to Tp, the proposed IM should reduce the aforementioned area. It can be seen that the area between the moving average curve and the horizontal dashed line obtained for INp is lower than that of obtained for Sa(T1). Although employing INp as an IM for seismic collapse capacity assessment of the selected structure under near-fault ground motions reduces the bias compared with employing Sa(T1), the results are still biased. The regression lines in Fig. 5(a) and (b) also imply that Sa(T1) and INp are insufficient with respect to Tp, because the p-values are less than 0.05. Consequently, the collapse capacity estimates obtained by employing these IMs are biased, and depend on the Tp values of the ground motions used for the analyses.
By comparing Fig. 5(c) with Fig. 5(a) and (b), it can be seen that unlike Sa(T1) and INp, the integral-based IM, ISa, with the integration period range of 0.82T1-3.9T1 significantly reduces the bias caused by the pulse period. In fact, a p-value of 0.92 (corresponding to an approximately horizontal regression line), and also significant reduction in the area between the moving average curve and the horizontal dashed line show the high degree of sufficiency of ISa with respect to Tp for collapse capacity assessment of the structure.
6. Proposing optimal period ranges for ISa
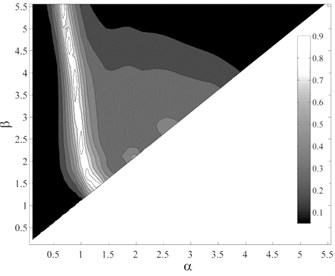
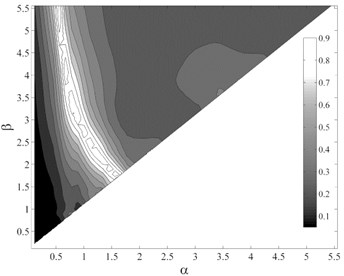
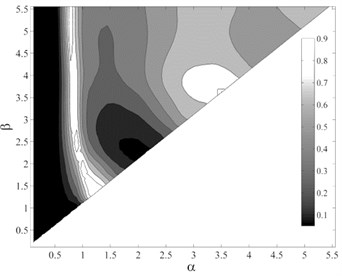
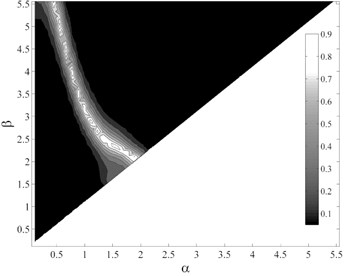
It appears that selection of an optimal integration period range for ISa, as a function of the fundamental period and ductility of the structure, to satisfy the efficiency, and simultaneously sufficiency with respect to M, R, SF and Tp is the most important and challengeable part of proposing ISa. To determine the optimal period range of integration, it should be considered that the integration limits may vary with the variations of structural characteristics such as fundamental period and ductility. As mentioned earlier, three ductility classes, member ductility values of δc/δy=2, 4 and 8 as the representatives of low-, intermediate- and high-ductile structures, were used that resulted in a total number of 15 generic frame structures. For each structure, 7140 different integration period ranges, with the period step of 0.05 sec and the maximum and minimum periods of 0 and 6 sec, were assumed. The dispersion of structural collapse capacity, σlnISacol, was calculated considering each integration period range. As an example, Fig. 6 shows the variations of σlnISacol considering different period ranges for the intermediate-ductile 9-story structure. In this figure, the region corresponding to the period ranges that lead to lower σlnISacol values, shown in black, can be easily located. But in the selection of the optimal period ranges, the sufficiency of the IM should also be considered as a determining criterion. Fig. 7(a)-(d) show the p-values obtained from testing the sufficiency of ISa, considering different period ranges, with respect to M, R, SF and Tp for collapse capacity prediction of the intermediate-ductile 9-story structure, respectively.
Fig. 6Variations of σlnISa col considering different period ranges (αT1–βT1) for the intermediate-ductile 9-story structure
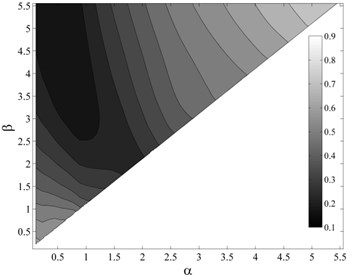
For selecting the optimal period ranges, some filters were used to select them based on the dispersion of structural collapse capacity, σlnISacol, and the p-values obtained from testing the sufficiency with respect to M, R, SF and Tp. For each structure, the optimal period ranges were selected to satisfy the following criteria: the dispersion of ISacol values does not exceed 1.2 times the minimum σlnISacol value, and simultaneously the period ranges that lead to acceptable p-values from testing the sufficiency with respect to all of the considered parameters (i.e., M, R, SF and Tp).
Fig. 7P-values obtained from testing the sufficiency of ISa, considering different period ranges (αT1– βT1), with respect to different parameters for collapse capacity prediction of the intermediate-ductile 9-story structure: a) M, b) R, c) SF and d) Tp
a)
b)
c)
d)
After selection of the optimal period ranges for each structure, (αT1–βT1) period ranges, by using the aforementioned filters, the mean values of α and β were calculated for each structure. Then, third-order polynomial regression was applied to the mean values of α and β for the structures with the same class of ductility by employing the following equation:
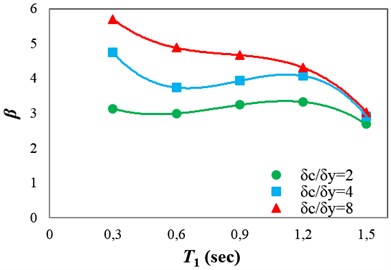
Fig. 8 shows the β values selected for the intermediate-ductile structures (δc/δy=4), and the fitted regression to obtain β as a function of T1. The regression coefficients calculated by fitting third-order polynomial regression to the mean β values are presented in Table 2 for the different ductility classes.
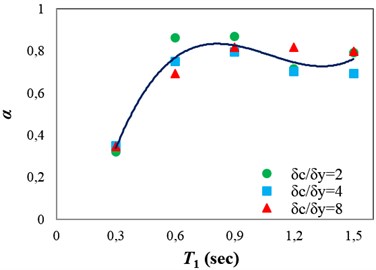
Fig. 9(a) and (b) indicate the α and β values calculated using the fitted regressions for the different ductility classes. It can be seen that α does not vary considerably with the variation of structural ductility. Thus, the mean of α values obtained from regressions, for different ductility classes, was calculated for the structures with the same fundamental period. Then, third-order polynomial regression was applied to the mean α values corresponding to different fundamental periods. The regression coefficients calculated for obtaining α as a function of T1 are presented in Table 2. Fig. 9(b) indicates that the difference between the β values for the high- and low-ductile structures decreases with increase in the height of the structure. The reason for this is that when a structure becomes taller, the contribution of the P-Δ effect in the structural collapse becomes more significant, and the P-Δ effect controls the collapse mode instead of the ductility capacity of the structural members. Furthermore, it is worth noting that under pulse-like near-fault ground motions the importance of the P-Δ effect increases significantly [9].
Table 2Regression coefficients calculated to obtain α and β as functions of T1
α or β | δc/δy | a | b | c | d |
β | 2 | –3.423 | 8.328 | –5.812 | 4.218 |
4 | –7.713 | 20.543 | –16.982 | 8.194 | |
8 | –4.717 | 11.903 | –10.486 | 7.900 | |
α | – | 1.445 | –4.670 | 4.725 | –0.697 |
Fig. 8Obtaining β as a function of T1 for the intermediate-ductile structures
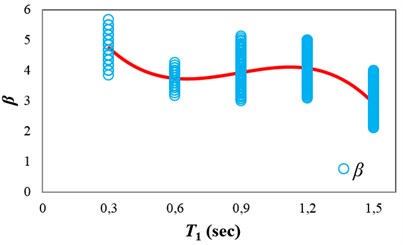
Fig. 9α and β values calculated using the fitted regressions for the different ductility classes: a) α and b) β
a)
b)
7. Discussion on the proposed IM, ISa
The purpose of proposing an optimal IM is to achieve more reliable results. In fact, using an optimal IM for seismic collapse assessment of structures increases the efficiency (decreases the dispersion of structural collapse capacity), and also sufficiency with respect to ground motion characteristics, that leads to more realistic seismic collapse assessment of structures. Fig. 10 indicates the values of collapse capacity dispersion, σlnIMcol, obtained by using ISa and Sa(T1) for the structures. As shown in this figure, employing ISa for seismic collapse capacity prediction of the structures leads to significant reduction in the dispersion of structural collapse capacity compared with using Sa(T1). This reduction varies from 26 to 66 percent for different structures.
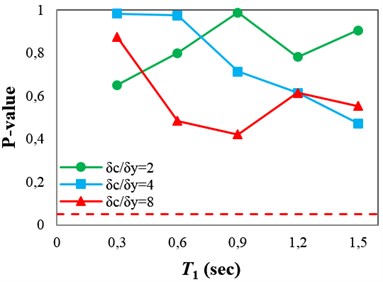
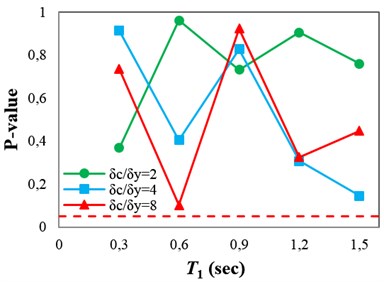
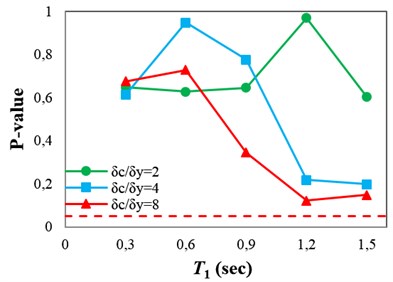
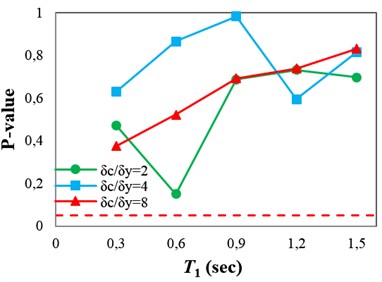
Fig. 11(a)-(d) show the p-values obtained from testing the sufficiency of the proposed IM with respect to Tp, M, R and SF for collapse capacity prediction of the structures, respectively. The p-values imply that ISa is able to account for the effect of the ground motion characteristics, and also scale factor, for seismic collapse assessment of the structures. As mentioned earlier, one of the most important parameters in near-fault ground motions is the pulse period, which affects the structural response significantly. Thus, it is expected for an IM, proposed for seismic collapse assessment of structures under pulse-like near-fault excitations, to be able to account for the effect of the pulse period. By comparing Fig. 11(a) and 4(d), it can be seen that the p-values obtained from testing the sufficiency of ISa with respect to the pulse period for collapse capacity prediction of the structures are significantly greater than those obtained by employing Sa(T1) and INp.
Fig. 10Values of collapse capacity dispersion, σln IMcol, obtained by using Sa(T1) and ISa for the structures
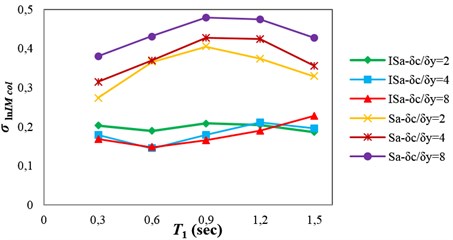
Fig. 11P-values obtained from testing the sufficiency of ISa with respect to different parameters for collapse capacity prediction of the structures: a) Tp, b) M, c) R and d) SF
a)
b)
c)
d)
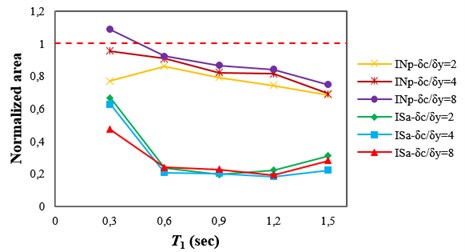
The p-value from the F-test, for the regression coefficient b1 in Eq. (6), is a simple tool to gauge the bias caused by the pulse period in collapse capacity prediction. Another common method to gauge the bias caused by the pulse period is applying moving average to the collapse capacity values. As described in Section 5.2, the area (in absolute values) between the moving average curve and the horizontal line, representing the median value, can be used as an indicator of the bias due to the pulse period (see Fig. 5(a)-(c)). For each structure, the areas, between the moving average curve and the corresponding horizontal line, obtained by employing ISa and INp were normalized to that obtained by employing Sa(T1). The values of normalized areas are presented in Fig. 12 for all of the structures. It can be seen that employing ISa, considering the integration limits proposed in Section 6, significantly reduces the bias caused by the pulse period compared with using Sa(T1) and INp. The reduction in the area representing bias achieved by employing ISa instead of Sa(T1) varies from 33 to 82 percent for the structures.
Based on the results of the analyses, to achieve more efficiency and sufficiency for collapse capacity prediction of an arbitrary structure under pulse-like near-fault ground motions by employing ISa, there should be an optimal integration period range, which is a function of the fundamental period and ductility of the structure. The proposed integration limits for the three ductility classes can be good estimates for each arbitrary structure. Furthermore, the optimal period range for a structure can also be determined based on the method applied in this paper.
Fig. 12Values of normalized areas obtained by employing ISa and INp
8. Conclusions
To propose an optimal integral-based IM for reliable seismic collapse assessment of structures under pulse-like near-fault ground motions, 15 generic frame structures, with different fundamental periods and ductility classes, were employed. The integral of the pseudo acceleration response spectrum over an optimal period range, which is a function of the fundamental period and ductility of the structure, was proposed as a scalar IM, ISa. Efficiency and sufficiency for collapse capacity prediction were considered as two determining criteria to obtain the optimal period range. It was shown that employing ISa, with the proposed upper and lower integration limits, results in more efficiency compared with using Sa(T1) and INp (26-66 percent reduction in the dispersion of structural collapse capacity when compared with Sa(T1)). The results also indicated that using Sa(T1) or INp as an IM for predicting the structural collapse capacity causes significant bias with respect to the pulse period for all of the structures, except the 3-story structures. But using ISa, considering the proposed integration limits, causes unbiased structural collapse capacity assessments with respect to the pulse period. In other words, ISa can cause 33-82 percent reduction in the area representing the bias due the pulse period compared with Sa(T1). Furthermore, testing the sufficiency of ISa for collapse capacity assessment revealed that this IM is also sufficient with respect to magnitude, source-to-site distance and scale factor.
References
-
Baker J. W. Vector-valued ground motion intensity measures for probabilistic seismic demand analysis. Ph.D. Dissertation, Department of Civil and Environmental Engineering, Stanford University, CA, 2005.
-
Bradley B. A., Dhakal R. P., MacRae G. A., Cubrinovski M. Prediction of spatially distributed seismic demands in specific structures: ground motion and structural response. Earthquake Engineering and Structural Dynamics, Vol. 39, Issue 5, 2010, p. 501-520.
-
Bojórquez E., Iervolino I. Spectral shape proxies and nonlinear structural response. Soil Dynamics and Earthquake Engineering, Vol. 31, Issue 7, 2011, p. 996-1008.
-
Bojórquez E., Iervolino I., Reyes-Salazar A., Ruiz S. E. Comparing vector-valued intensity measures for fragility analysis of steel frames in the case of narrow-band ground motions. Engineering Structures, Vol. 45, 2012, p. 472-480.
-
Somerville P., Smith N., Graves R., Abrahamson N. Modification of empirical strong motion attenuation relations to include the amplitude and duration effects of rupture directivity. Seismological Research Letters, Vol. 68, Issue 1, 1997, p. 199-222.
-
Kalkan E., Kunnath S. K. Effects of fling step and forward directivity on seismic response of buildings. Earthquake Spectra, Vol. 22, Issue 2, 2006, p. 367-390.
-
Tothong P., Cornell C. A. Structural performance assessment under near-source pulse-like ground motions using advanced ground motion intensity measures. Earthquake Engineering and Structural Dynamics, Vol. 37, Issue 7, 2008, p. 1013-1037.
-
Luco N., Cornell C. A. Structure-specific scalar intensity measures for near-source and ordinary earthquake ground motions. Earthquake Spectra, Vol. 23, Issue 2, 2007, p. 357-392.
-
Sehhati R., Rodriguez-Marek A., Elgawady M., Cofer W. F. Effects of near-fault ground motions and equivalent pulses on multi-story structures. Engineering Structures, Vol. 33, Issue 3, 2011, p. 767-779.
-
Champion C., Liel A. The effect of near-fault directivity on building seismic collapse risk. Earthquake Engineering and Structural Dynamics, Vol. 41, Issue 10, 2012, p. 1391-1409.
-
Nicknam A., Barkhordari M., Hamidi Jamnani H., Hosseini A. Compatible seismogram simulation at near source site using Multi-Taper Spectral Analysis approach (MTSA). Journal of Vibroengineering, Vol. 15, Issue 2, 2013.
-
Alavi B., Krawinkler H. Behavior of moment-resisting frame structures subjected to near-fault ground motions. Earthquake Engineering and Structural Dynamics, Vol. 33, Issue 6, 2004, p. 687-706.
-
Baker J. W., Cornell C. A. Vector-valued intensity measures for pulse-like near-fault ground motions. Engineering Structures, Vol. 30, Issue 4, 2008, p. 1048-1057.
-
Deierlein G. G. Overview of a comprehensive framework for performance earthquake assessment. PEER Report 2004/05, Pacific Earthquake Engineering Research Center, University of California, Berkeley, CA, 2004, p. 15-26.
-
Vamvatsikos D., Cornell C. A. Developing efficient scalar and vector intensity measures for IDA capacity estimation by incorporating elastic spectral shape information. Earthquake Engineering and Structural Dynamics, Vol. 34, Issue 13, 2005, p. 1573-1600.
-
Haselton C. B., Liel A. B., Deierlein G. G., Dean B. S., Chou J. H. Seismic collapse safety of reinforced concrete buildings: I. assessment of ductile moment frames. Journal of Structural Engineering, Vol. 137, Issue 4, 2011, p. 481-491.
-
Liel A. B., Haselton C. B., Deierlein G. G. Seismic collapse safety of reinforced concrete buildings: II. comparative assessment of non-ductile and ductile moment frames. Journal of Structural Engineering, Vol. 137, Issue 4, 2011, p. 492-502.
-
Haselton C. B., Baker J. W., Liel A. B., Deierlein G. G. Accounting for ground motion spectral shape characteristics in structural collapse assessment through an adjustment for epsilon. Journal of Structural Engineering, Vol. 137, Issue 3, 2011, p. 332-344.
-
Yakhchalian M., Ghodrati Amiri G., Nicknam A. A new proxy for ground motion selection in seismic collapse assessment of tall buildings. The Structural Design of Tall and Special Buildings, 2013.
-
Vamvatsikos D., Cornell C. A. Incremental dynamic analysis. Earthquake Engineering and Structural Dynamics, Vol. 31, Issue 3, 2002, p. 491-514.
-
Chopra A. K. Dynamics of structures: theory and applications to earthquake engineering. Fourth Edition, Prentice Hall, Upper Saddle River, New Jersey, 2012.
-
Bradley B. A. Site-specific and spatially distributed ground-motion prediction of acceleration spectrum intensity. Bulletin of the Seismological Society of America, Vol. 100, Issue 2, 2010, p. 277-285.
-
Medina R. A., Krawinkler H. Seismic demands for nondeteriorating frame structures and their dependence on ground motions. PEER Report 2003/15, Pacific Earthquake Engineering Research Center, University of California, Berkeley, CA, 2003.
-
Ibarra L. F., Krawinkler H. Global collapse of frame structures under seismic excitations. PEER Report 2005/05, Pacific Earthquake Engineering Research Center, University of California, Berkeley, CA, 2005.
-
Open System for Earthquake Engineering Simulation (OpenSees). Pacific Earthquake Engineering Research Center, University of California, Berkeley, CA, 2012, http://opensees.berkeley.edu.
-
Ibarra L. F., Medina R. A., Krawinkler H. Hysteretic models that incorporate strength and stiffness deterioration. Earthquake Engineering and Structural Dynamics, Vol. 34, Issue 12, 2005, p. 1489-1511.
-
Tothong P., Cornell C. A. Probabilistic seismic demand analysis using advanced ground motion intensity measures, attenuation relationships, and near-fault effects. PEER Report 2006/11, Pacific Earthquake Engineering Research Center, University of California, Berkeley, CA, 2007.
-
Pacific Earthquake Engineering Research Center. PEER Next Generation Attenuation (NGA) Database, 2013, http://peer.berkeley.edu/nga.
-
Villaverde R. Methods to assess the seismic collapse capacity of building structures: state of the art. Journal of Structural Engineering, Vol. 133, Issue 1, 2007, p. 57-66.
-
Ang A. H. S., Tang W. H. Probability concepts in engineering planning and design. Volume I – basic principles. Wiley, Inc., New York, 1975.
-
Alavi B., Krawinkler H. Effects of near-field ground motion on frame structures. Report No. 138, John A. Blume Earthquake Engineering Center, Department of Civil and Environmental Engineering, Stanford University, Stanford, CA, 2001.
