Abstract
According to the report of the United States transportation department, mechanical damage is one of the most important reasons for the pipeline accident .The most typical form of mechanical damage is indentation. Dent, which is one of the important factors affecting pipeline fatigue life, substantially reduces the fatigue life of the pipeline in service. The peak cycle stress on dented pipeline is a key parameter in calculating the fatigue life. Finite element models of typical plain dent are established under different circumstances. On the basis of considerable calculations, the results are subjected to univariate and multivariate analyses, yielding the dependences of peak cycle stress on different parameters. The calculation results are fitted by non-linear regression. The relationships between the peak cycle stresses of dented pipeline and the dent depth, the dent longitudinal length, diameter and thickness of pipeline are acquired by establishing mathematical models and proposing the corresponding expressions.
1. Introduction
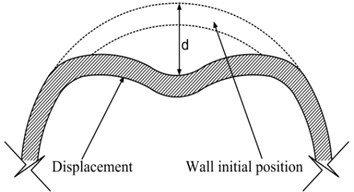
It has been reported by the United States Transportation Department that mechanical damage is one of the most critical reasons accounting for pipeline accidents, in which indentation (or simply dent) is most typical. The Fig. 1 is dent cross-section shape [1-3].
Fig. 1Typical dent cross-section shape
In order to avoid pipeline accidents and prolong the pipeline operation life, many standards were made in foreign. These standards such as Canada pipeline design standard made by Canadian Standards Association, ASME B31.4 and ASME B31.8all require the dent depth less than 6 % of the pipe diameter. Dent depth is one of important index, which determine whether the damaged pipeline should be repaired. But, only considering dent depth is not enough, dent length, pipe diameter and wall thickness are also important indexes [4-7].
Numerous fatigue tests concerning typical dents have been performed hitherto. The cyclic number of failure stress N and peak cycle stress ∆ are exponentially correlated at certain pressure following specific formulae [8, 9].
In order to accurately evaluate the fatigue life of dented pipeline, the peak cycle stress was subjected to single-factor and multi-factor analyses by regression based on finite element calculation results [10, 11].
2. Plain dent model
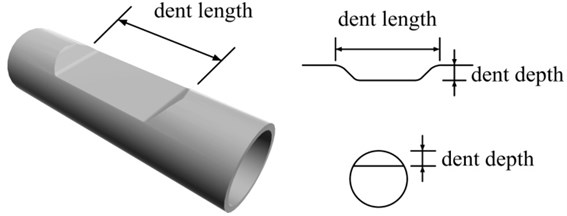
According to the data accumulated at the scene, the dents on pipeline can be classified into type I, type II and type III (Fig. 2, [1]). In this paper, we studied type III dent (plain dent) via finite element analyses.
Fig. 2Shape of plain dent
Finite element software ANSYS was utilized to establish the dented pipeline models under different circumstances. X60 steels closed to pipe material. Poisson’s ratio is 0.3. The theoretical elasticity modulus is 206000 MPa. The maximum yield strength is 464 MPa. The minimum ultimate strength is 508 MPa.
According to the real stress state and geometry shape of the pipe in the presence of internal pressure, half pipe including dent defects was selected by axisymmetric principle.
Apparently, boundary conditions affect deformation differently even at identical loads. However, compared to the dimension of pipelines, the dent in a pipe is so small that it can always be treated as a local deformation. Therefore, the pipe was set sufficiently long in the FE model (6 times longer than the outer radius of pipe) to generalize the research and maintain the impact of boundary conditions. In addition, the boundary conditions of both ends of the pipe were fixed to simulate the actual situation [1].
In fact, most dent defects are induced during construction, after which the external disturbance is eliminated. Thus, the finite element model only considers formed dents. Besides, the influence of internal pressure rather than that of external load is involved.
4-node shell element SHELL 63 was used to mesh the solid model. Different meshing densities were used to simulate the dent, from which the optimal one was selected according to the analytical process, calculation accuracy and time, and etc.
The model of the original dent originates from a small plate compressing pipeline along the longitudinal pipe. The diameter and wall thickness of the pipe are and respectively. The longitudinal dent length of the FE model is . Dent length is the distance between adjacent intact cross-sections on both sides of the dent. The dent depth of the FE model is . Dent depth is the maximum displacement of the pipe wall thickness on the site of dent. The internal pressure of the FE model is .
Fig. 3-5 are respectively the finite element model, the finite element mesh and von Mises stress of the dented pipeline respectively at 3.105 MPa.The ratio of pipe diameter to wall thickness () is 30, and the ratio of dent depth to pipe diameter is 0.08.
Fig. 3Finite element model

Fig. 4Finite element mesh

Fig. 5Von Mises stress (MPa)

3. Single factor analysis
The average pipeline internal pressure is 3.45 MPa, and the pressure variationpeak cycle stress is 0.69 MPa assuming the fluctuation is 10 % of the average.
The ratio of peak period stress to pipeline pressure variation is:
where is the maximum pressure, is the minimum pressure, is the stress at maximum pressure, is the stress at minimum pressure, and is the peak cycle stress.
3.1. Dent depth
Fig. 6 shows the relationships between peak cycle stress and dent depth in case of different valuesatthe average pipeline internal pressure of 3.45 MPa and the pressure variation of 0.69 MPa.
Fig. 6Relationship between peak cycle stress and dent depth
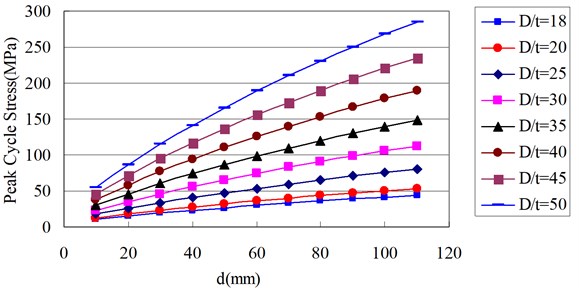
Fig. 6 exhibits peak cycle stress is elevated with increasing dent depth at different values. The former changes less significantly with varied dent depth at lower values, and vice versa.
The relationships between peak cycle stress and dent depth at different values were determined by fitting the finite element results. When the other parameters remain unchanged, the relationship between peak cycle stress and dent depth can be expressed by the power function model below:
Table 1 and Table 2 list the coefficients and as well as the corresponding correlation coefficient squares () at different values.
Table 1Values of a and b at different D/t values
18 | 2.477 | 0.6085 |
20 | 2.831 | 0.6216 |
25 | 3.8147 | 0.646 |
30 | 4.9384 | 0.6627 |
35 | 6.2056 | 0.6747 |
40 | 7.6201 | 0.6834 |
45 | 9.1689 | 0.6905 |
50 | 10.872 | 0.6959 |
The correlation coefficient squares () of the above fitting formula are higher than 0.997.
Table 2Values of a, b and R2 at different D/t values
(0,20) | 2.418 | 0.6382 | 0.93 |
(20,25) | 4.121 | 0.6702 | 0.83 |
(25,30) | 4.805 | 0.6302 | 0.82 |
(30,35) | 5.331 | 0.6802 | 0.87 |
(35,40) | 10.872 | 0.6959 | 0.91 |
(40,45) | 8.2204 | 0.6924 | 0.92 |
(45,50) | 9.922 | 0.6959 | 0.94 |
The results were classified according to the best-fit principle.
3.2. Longitudinal dent length
Fig. 7 shows the relationships between peak cycle stress and at different pipe diameter values.
Fig. 7Relationship between peak cycle stress and longitudinal dent length
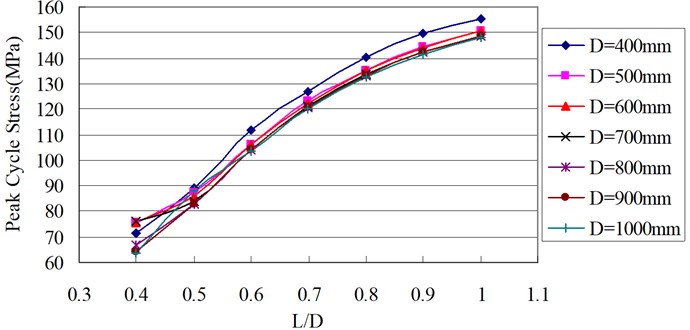
Fig. 7 illustrates that peak cycle stress is augmented with increasing longitudinal dent length at different pipe diameter values.
When the other parameters are invariable, the relationship between peak cycle stress and longitudinal dent length at different pipe diameter values can be expressed by the best-fit semi logarithm linear function:
The coefficient in the equation represents the absolute value of peak cycle stress change with 1 % variation in .
Table 3 summarizes the coefficients and of the equation describing the relationship between peak cycle stress and longitudinal dent length at various pipe diameter values.
Table 3Values of a and b at different D values
(mm) | ||
400 | 96.203 | 159.29 |
500 | 87.461 | 152.62 |
600 | 87.934 | 152.35 |
700 | 86.064 | 150.2 |
800 | 93.679 | 151.73 |
900 | 96 | 152.13 |
1000 | 92.853 | 151.1 |
The correlation coefficient square () is higher than 0.98, indicating a satisfactory fitting effect.
3.3. Pipe wall thickness
Fig. 8 shows the relationships between the peak cycle stress and pipe wall thickness at different values at the average pipeline internal pressure of 3.45 MPa and the pressure variation of 0.69 MPa.
Fig. 8Relationship between peak cycle stress and pipe wall thickness
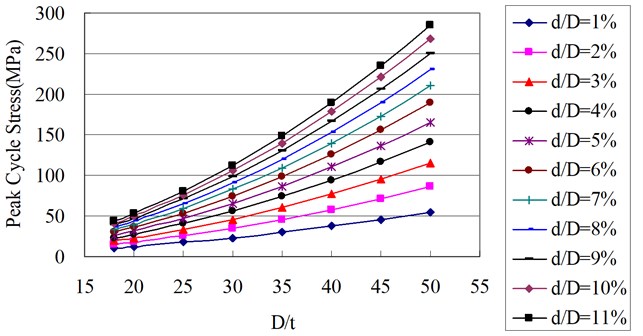
Fig. 8 suggests that peak cycle stress decreases with increasing pipeat different values.
After delicate comparisons and calculations, the relationship between peak cycle stress and wall thickness can be expressed by the power function that fits best. The power function is commonly expressed as:
Table 4 and Table 5 summarize the coefficients and of the equation describing the relationship between peak cycle stress and pipe wall thicknessat different values.
The corresponding correlation coefficient squares () of the above fitting formula are all 1.
Practically, peak cycle stress decreases with increasing pipe wall thickness, and the coefficient is lower than 0.
Table 4Values of a and b at different d/D values
10 | 6677.3 | –1.6086 |
20 | 14534 | –1.7146 |
30 | 22095 | –1.7589 |
40 | 29328 | –1.7829 |
50 | 35784 | –1.7965 |
60 | 42193 | –1.8072 |
70 | 47891 | –1.8135 |
80 | 53033 | –1.8166 |
90 | 58479 | –1.8218 |
100 | 63660 | –1.8261 |
110 | 68263 | 1.8292 |
Table 5Values of a, b and R2 at different d/D values
(10,20) | 11335.756 | –1.6972 | 0.82 |
(20,30) | 19473.344 | –1.7592 | 0.92 |
(30,40) | 26982.143 | –1.787 | 0.95 |
(40,50) | 33818.248 | –1.8018 | 0.97 |
(50,60) | 40286.536 | –1.8122 | 0.98 |
(60,70) | 46329.543 | –1.8191 | 0.98 |
(70,80) | 51329.011 | –1.8203 | 0.99 |
(80,90) | 56376.816 | –1.8227 | 0.99 |
(90,100) | 61620.735 | –1.8268 | 0.99 |
3.4. Pipe diameter
Fig. 9 shows the relationships between peak cycle stress and pipe diameter at different ratios of longitudinal dent length to pipe diameter () at the average pipeline internal pressure of 3.45 MPa.
Fig. 9Relationship between peak cycle stress and pipe diameter
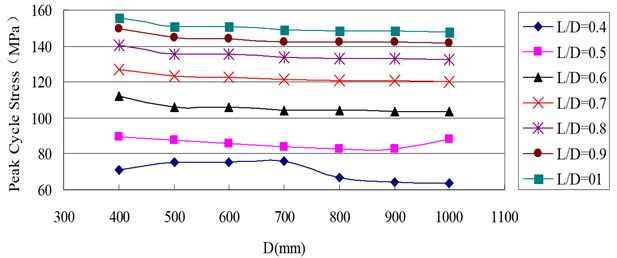
Fig. 9 presents peak cycle stress is lowered slowly with increasing pipe diameterat various values.
When the other parameters are maintained constant, the relationship between the peak cycle stress and pipe diameter at various values can be expressed by the linear function that fits best. The common expression is:
Table 6 lists the coefficients , , , and correlation coefficient square () of the equation describing the relationship between peak cycle stress and pipe diameter at different values.
Table 6Values of a, b, c, j and R2 at different L/D values
0.4 | –48.65 | 0.5613 | –0.0008 | 3.4667e-7 | 0.92 |
0.5 | 60.4555 | 0.17373 | –0.0003 | 1.8194e-7 | 0.98 |
0.6 | 167.8971 | –0.2437 | 0.0003 | –1.3083e-7 | 0.95 |
0.7 | 161.0355 | –0.1439 | 0.0002 | –7.1389e-8 | 0.99 |
0.8 | 185.8157 | –0.1969 | 0.0003 | –1.0417e-7 | 0.95 |
0.9 | 202.9641 | –0.2309 | 0.0003 | –1.2389 e-7 | 0.97 |
1 | 200.0436 | –0.1914 | 0.0002 | –1e-7 | 0.97 |
The coefficients can also be determined by the interpolation method when the values fall out of those listed in Table 6 because and peak cycle stress are linearly correlated.
4. Muliti-factor analysis
When and are changed while maintaining the other parameters constant, the relationship between peak cycle stress, and can be expressed as:
where the pressure variation equals 0.69 MPa.
When longitudinal dent length and pipe diameter are altered while maintaining the other parameters unchanged, the relationship between peak cycle stress, longitudinal dent length and pipe diameter can be expressed as:
where the pressure variation equals 0.69 MPa.
The correlation coefficient square () is higher than 0.99, suggesting a good fitting result.
The equations at other pipe inner pressures that are linearly correlated with peak cycle stress can also be determined by the interpolation method.
In other cases with higher internal pressure fluctuations, each factor of multi-factor expressions can only be accurately determined via more thorough research.
5. Conclusions
(1) Peak cycle stress increases with elevating dent depth. The relationship between peak cycle stress and dent depth of a dented pipeline can be expressed by the power model function .
(2) Besides, peak cycle stress is elevated with increasing longitudinal dent length. The relationship between peak cycle stress and longitudinal dent length can be expressed by the semilogarithm linear function .
(3) Moreover, peak cycle stress, which decreases with increasingpipe wall thickness, is associated with wall thickness following thepower function .
(4) Furthermore, peak cycle stress reducesslowly with increasing pipe diameter. The relationship between them can be expressed by the linear function .
References
-
Ying W., Peng Z., Yanping X. The stress analyses of the plain dent on pipeline based on FEM. Transactions of the China Welding Institution, Vol. 34, Issue 1, 2013, p. 57-60.
-
Limam A., Lee L. H., Kyriakides S. On the raga of dented tubes under combined bending and internal pressure. International Journal of Mechanical Sciences, Vol. 55, 2012, p. 1-12.
-
Hojjati M. H., Lukasiewicz S. A. Filtering algorithm for radial displacement measurements of a dented pipe. International Journal of Pressure Vessels and Piping, Vol. 85, 2008, p. 344-349.
-
Lflefel L. B., Moffat D. G., Mistry J. The interaction of pressure and bending on a dented pipe. International Journal of Pressure Vessels and Piping, Vol. 82, 2005, p. 761-769.
-
Dauro Braga Noronha Jr., Ricardo Rodrigues Martin, Breno Pinheiro Jacob, Eduardo de Souza Procedures for the strain based assessment of pipeline dents. International Journal of Pressure Vessels and Piping, Vol. 87, Issue 5, 2010, p. 254-265.
-
Allouti M., Schmitt C., Pluvinage G., Gilgert J., Hariri S. Filtering Study of the influence of dent depth on the critical pressure of pipeline. Engineering Failure Analysis, Vol. 21, 2012, p. 40-51.
-
Edward D. C. A theoretical analysis of theformation of dents in pipelines under static condition. British Gas, Engineering Research Station, 1998.
-
Maxey W. A. Defect behavior-1, analysis made of out-side-force damage to pipeline. Oil Gas J., Vol. 20, 1987, p. 33-35.
-
Maxey W. A. Defect behavior-conclusion, serviceability of damaged line pipe rated. Oil Gas J., Vol. 24, 1987, p. 41-44.
-
Jong-HyunBaek, Young-Pyo Kim, Woo-Silk Kim, Jae-Min Koo, Chang-Sung Seok Load bearing capacity of API X65 pipe with dent defect under internal pressure and in-plane bending. Materials Science and Engineering: A, Vol. 54, Issue 1, 2012, p. 70-82.
-
Limam A., Lee L. H., Kyriakides S. On the collapse of dented tubes under combined bending and internal pressure. International Journal of Mechanical Sciences, Vol. 55, 2012, p. 1-12.
About this article
This work is partially supported by the Grants from the National Natural Science Foundation of China (No. 50974105), the Applied Basic Research Project of Sichuan Province (No. 2013JY0098), the Education Department Research Project of Sichuan Province (No. 14ZB0057), and SWPU Science & Technology Fund: Project Name (No. 2013XJZ021).
