Abstract
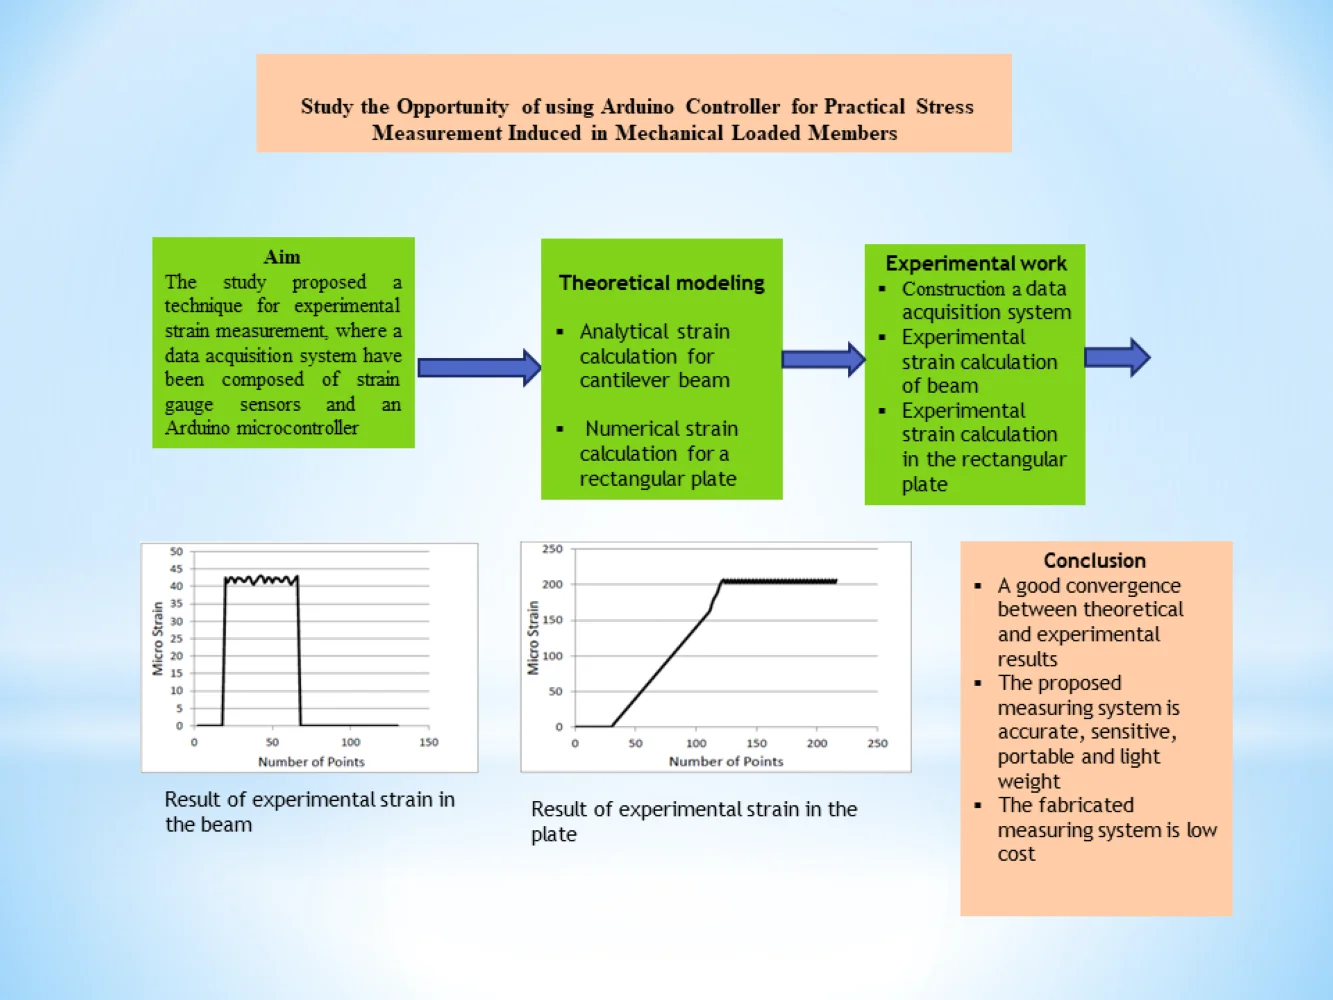
The accurate assessment of stresses, strains and loads in components under working conditions is an essential requirement of successful engineering design. In particular, the location of peak stress values and stress concentrations, and subsequently their reduction or removal by suitable design, has applications in every field of engineering. The current work presents a technique for experimental strain measurement, where a data acquisition system have been composed of strain gauge sensors and an Arduino microcontroller. The measured signal conditioning is performed by means of strain bending sensor and then discretized by an analog-digital converter external to the Arduino. To realize the full-field measurement, the current measuring approach can be employed to determine the induced strain in multi points simultaneously. The significant features of the proposed measuring system are: sensitive, precise, economical, and compact size. For the purpose of results verification of the designed measuring device, experimental tests have performed on a cantilever beam and on a simply supported thin plate loaded at the center. An average percentage error was 5.7 % between analytical and experimental recorded strains in beam test. Also, in rectangular plate loading, an average percentage errors were 5.8 % and 4.1 % for the measured strains numerically and experimentally in -direction and -direction respectively. The conducted results indicated a good agreement and demonstrate the accuracy of the proposed measuring system.
Highlights
- Present a new technique for calculation experimental strains induced in loaded mechanical members
- Utilizing an Arduino controller with strain bending sensor module as a data acquisition system
- Validation the experimental results with analytical solution for a cantilever beam and rectangular plate
- Based on the experiments and outcomes of the current study, the proposed measuring system is sensitive, accurate, lightweight and low cost
1. Introduction
With nowadays assurance on product liability and power efficiency, designs must not only be lighter and stronger, but also more thoroughly examined than ever before. As a results, further challenges on the field of experimental stress analysis and the approaches for measuring strain are present. The relation between stress and strain is a fundamental concept in the subject of the mechanics of materials and is essential to the stress analyst. In experimental stress analysis, a given load is applied and then measure the strain on individual members of a structure or machine. In recent developed measurements, the general intermediate quantity is the electrical voltage. The most obvious improvement in modern technology is the digital acquisition of electronic signals [1], [2].
In prior studies, multiple strategies for experimental stress and strain analysis have employed. Photo elasticity is one of the oldest methods for experimental stress analysis, the authors in [3] derived anisotropic stress optic formula and the related parameters were calculated via Brazilian disc experiment for silicon material of diamond lattice structure. In the work of [4] the photo elastic tests were performed on various complex pore prototypes fabricated by 3D printing technique for stress and strain determination. Based on the experimental analysis described in [5],[6] the stress optics analyzing principle indicates that the isochromatic fringes represent the principal stress difference, while the isoclinic fringes refers to the principal stress orientation. Moreover, the benefits of photo elastic possibilities can be employed as part of medical and dental treatment for observing the created combined stresses and biomechanics understanding [7].
A wide range of engineering problems in the context of stress distribution have been performed through Digital Image Correlation (DIC) approach also cooperation with other measurement methods [8]. The paper in [9] reviewed the various problems solved by DIC and compared its outcomes with common measurement strategies, for example gauges and transducers, in the field of material behavior and displacement measurement. The study presented in [10] extended the existed literature through utilizing a non-contact optic (DIC) concept to specify strain regions during the test. The study developed an experimental investigation of in-plane shear in glass laminate using a ±45 rotated tensile force. Furthermore, a two dimensional (DIC) with strain gauges combination were used for testing the behavior of the plate and screw as internal fixation tool generally used for fractured bones [11].
Residual stresses are generated in engineering elements during manufacturing and treatments. These stresses can badly effect on service life of mechanical members. They are widely estimated via empirical tests [12]. One of the most prevalent test for investigation of residual stresses is the hole drilling method. Usually, a small surface of the material is drilled at the center of a strain gauge rosette that is utilized to measure the strains created by the drilling [13], [14]. Moreover, a large rate of researchers work have been focused on using various techniques to improve the precision of the results obtained by the hole drilling method [15]-[17].
Among the various means presented on the market, electrical resistance changing strain gauges are used for the multiple benefits they exhibit, such as the opportunity to be located on surfaces with any desirable direction [18]. The researchers papers [19], [20], used strain gauges to evaluate and compare the experimental behavior for the cases of glued and bolted structures. The work presented in [21] analyzed the critical zones in warm water tube boiler numerically with experimental validation by strain measurement sensors. Moreover, strain gauge devices are widely employed in vibrated members problems to display the dynamics response as explained in [22-24]. However, a different technology based on fiber bragg grating sensors was introduced on rock cylindrical sample was described in [25].
Due to the complicated, high cost and limited applications mentioned measuring techniques, the current experimental work emphasize on the advantages and facilities of utilizing an efficient microcontroller integrated with strain gauges to evaluate the strength of mechanical members. The critical zones under simple or compound forces can be examined to measure the axial, lateral and off axis strains at the same time.
2. Mathematical modeling
For the purpose of experimental results validation, the theoretical stress analysis was performed for two cases: one and two dimensional stress problems as discussed below.
2.1. Cantilever beam
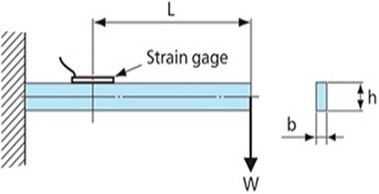
Fig. 1 shows schematically a beam totally constrained in it’s root and loaded at free tip. The generated stress and strain can be determined from bending stress formula as follows [26]:
where is bending stress (MPa), is bending moment (N.m), is the distance from the neutral axis to the beam surface, is the cross sectional area moment of inertia (m4), is the beam width (m), is the beam height (m), is the distance from the applied load to the strain gauge location (m), is the applied load (N) and is young modulus of the material (MPa).
Fig. 1Cantilever beam
2.2. All edges simply supported plate with center load
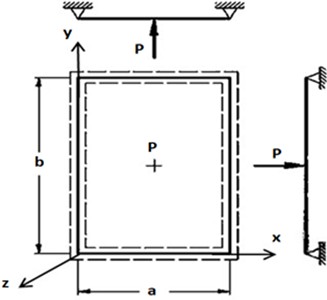
The stress analysis for the case of simply supported plate in all edges with concentrated load at the center as shown in Fig. 2 was performed numerically by means of Ansys 18 software based on Finite Element Method (FEM). To begin, the element type was selected as solid 185 with total number 966 element. The material properties of steel were used in the analysis that are (210 GPa and 0.3). The plate sides (a and b) were constrained in directions. Also, two corners are constrained in and axis to avoid free body motion. The load was applied at the plate center in direction.
Fig. 2Simply supported plate with center point load
3. Experimental work
3.1. Electronic device and data acquisition system
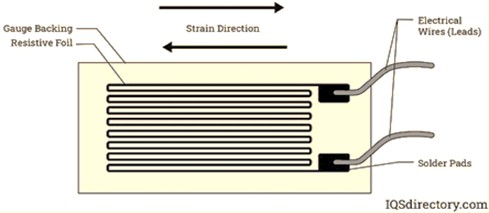
Strain gauge measurement play an important role in many industrial sectors. Suitable measurement system can determine the strain amount occurring in various construction from biomechanics to civil engineering. A Strain gauge shown in Fig. 3 is a sensor used to measure strain.
The working principle of strain sensor is based on Eq. (6). When the strain gauge is subjected to tensile or compressive loads, variation in length and cross section area occurs, therefore gauge resistance will change [27]:
where electrical resistance (Ω), electrical resistivity (Ω∙m), length (m), cross section area (m2).
Fig. 3Strain gauge
The strain gauge cannot be used directly in measurement process, but a data-acquisition system must be used for displaying sensor response. There are numerous conventional electronic controllers such as microcontrollers, Arduino UNO, Arduio mega and Raspberry pi. However, while many systems exist for building microcontrollers, Arduino has proved to be the most effective. An Arduino board allows users to experiment on innovative ideas they wish to bring to life. The controller in the Arduino board can be programmed with the Arduino IDE. In reality, programming with Arduino means reprogramming this microcontroller. Arduino controller has 13 digital pins numbered (1-13) and 15 analog pins numbered (A0-A15) which are sufficient for controlling even a very complex control systems [28]. In the current strategy, Arduino Mega controller was used in Fig. 4(a), strain gauge bending sensor module Fig. 4(b)and bread board Fig. 4(c). The whole electronic devices are collected and wired to laptop computer to display the sensor signal on the monitor.
A general computer program was employed to deal with three input/output sensor signals to measure axial, lateral and orientated strain values. This arrangement provides the ability to measure strain induced in the loaded members under the action of simple and complex loading members also determination of shear strain.
Fig. 4Devices used in design of a measuring system
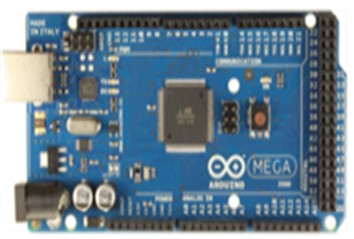
a) Aruino mega controller
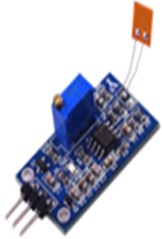
b) Strain gauge bending sensor module
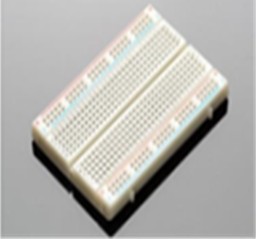
c) Bread board
3.2. Experimental strain measurement in the beam
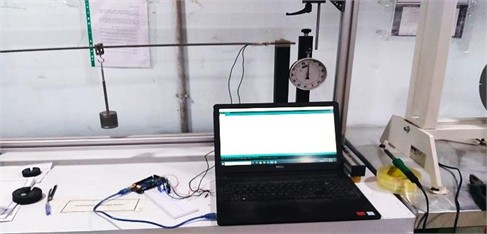
To begin, a 350 Ω strain gauge was glued near the root of the beam where a maximum stress can occur as shown in Fig. 5. After that, two wires were connected to the strain sensor by soldering operation and the other two terminals were connected to the bending sensor module. The beam was mounted in the test frame and rigidly fixed at it ,s root by two bolts. A standard weights were applied at the free tip of the arbitrary effective length as pictured in Fig. 6. From the command serial monitor in Arduino program window, the value of strain was recorded for each load value. Also, from the command serial plotter the sensor response (amplitude with time) was displayed for each load value.
Fig. 5Strain gauge located at the beam root
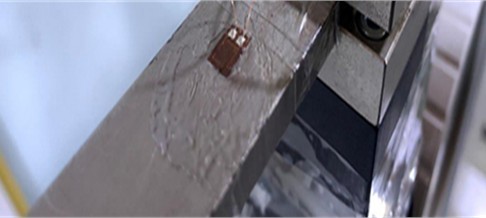
Fig. 6Cantilever beam loading test
3.3. Experimental strain measurement for the rectangular plate
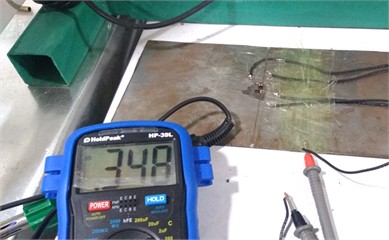
For the rectangular plate, two (350 Ω) strain gauges are utilized to measure the longitudinal strain () and the transverse strain () under the action of centered point load as explained in Fig. 7.
Fig. 7Lateral and transvers strain gauges located at the rectangular plate surface
In this case, two bending sensor modules explained in Fig. 4(b) were employed to measure the strains in and axis as can be seen in Fig. 8.
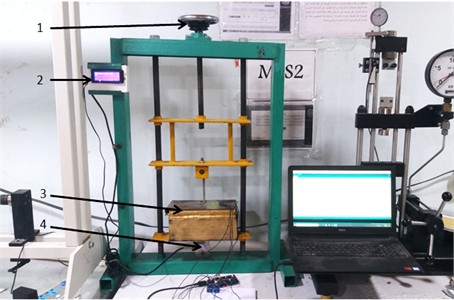
The load was subjected at the mid of the rectangular plate by means of power screw as obvious in Fig. 9. The applied load can be increased gradually through turning of the power screw torque arm and the load value appears in LCD monitor, The results of the two strain sensors were recorded for each value of the applied load.
In the computer program, the signal of two sensors named as sensor A and Sensor B. Where the amplitude plot with time of sensor A represents the measured strain value in -direction, similarly the sensor B signal represents the measured strain value in -direction.
Fig. 8Electronic circuit used in plate test
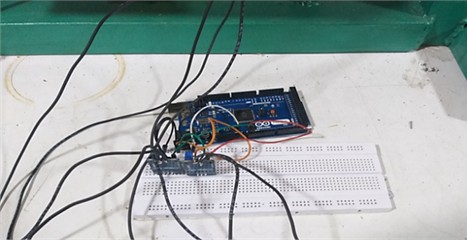
Fig. 9Simply supported plate subjected to centered point load: 1 – torque arm connected to power screw; 2 – electronic board with lcd monitor to display the applied load value; 3 – simply supported plate specimen; 4 – S-type load cell to measure the subjected load value
4. Results
4.1. Beam testing results
The analytical and experimental tests were performed on a steel cantilever beam with a specifications illustrated in Table 1.
Table 1Specifications of a cantilever beam
Young modulus | Poisson’s ratio | |||
210 GPa | 0.3 | 20 mm | 6 mm | 450 mm |
Eqs. (1-5) have used to determine the analytical values of strain due to gradual load increasing during beam test. The initial load value was 2.5 N the resulting analytical strain value is 0.000042, at this load, the corresponding practical strain value is 0.000043 as explained in Fig. 10. Also, when the load was raised to 3.5 N the analytical strain value was raised to 0.000059, in experiment the resulting strain value is 0.000058 as obvious in Fig. 11.
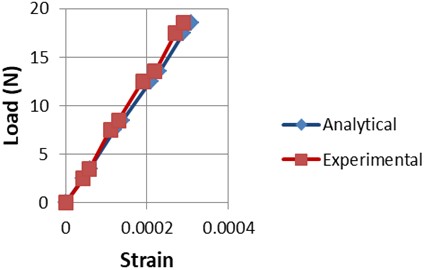
The whole results for the analytical and experimental strains with various load values are listed in Table 2. Furthermore, Fig. 12 gives indication about analytical and experimental results convergence for the cantilever beam testing.
The percentage error between analytical and experimental was calculated from following formula [13]:
Fig. 10Experimental strain value in the beam at w= 2.5 N
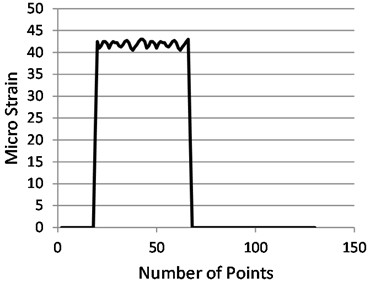
Fig. 11Experimental strain value in the beam at w= 3.5 N
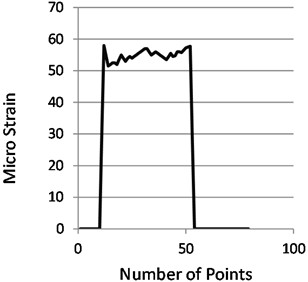
Table 2Analytical and experimental strains at beam loading test
(N) | Analytical strain | Experimental strain | Error % |
2.5 | 0.000042 | 0.000043 | 2.3 |
3.5 | 0.000059 | 0.000058 | 1.6 |
7.5 | 0.00012 | 0.00011 | 8.3 |
8.5 | 0.00014 | 0.00013 | 7.1 |
12.5 | 0.00021 | 0.00019 | 9.5 |
13.5 | 0.00023 | 0.00022 | 4.3 |
17.5 | 0.00029 | 0.00027 | 6.8 |
18.5 | 0.00031 | 0.00029 | 6.4 |
Average | 5.7 % |
Fig. 12Analytical and experimental strains induced during beam test
4.2. Rectangular plate loading test
The dimensions of the steel plate which was used in the current study are: 128 mm, 238 mm and the thickness 1 mm. In this analysis the point load was applied in the center of the plate in negative -direction. The boundary condition applied was the translation degree of freedom 0 for all plate sides., also two corners in plate dimension () were fixed that are 0 to prevent free body motion and obtain a result. In the plate experimental test, the load was increased gradually via a power screw which drives a sliding compressive device. To ensure applying concentrated load, the plate was loaded by a sharpened pin connected to the sliding compressive device as pictured in Fig. 9. The load sensor measures the subjected load in (kg) and appears on LCD digital monitor. Because the fact that, the compressive tool attaches the plate center, the two strain gauges were glued slightly outward the plate center point. Based on this aspect, referring to contour plots of strain distribution in the analyzed model, in Figs. 13 and 14 the numerical results have recorded for identical sensors location in the experimental work, where in Fig. 13 the dark blue zone was adopted and in Fig. 14 the light blue zone is corresponding to the actual sensor region. Thus, at the load (50 kg = –490.5 N), the value of 207e-3 and = 0.66 e-4.
Fig. 13Numerical strain in X-direction for the loaded plate P= –490.5 N
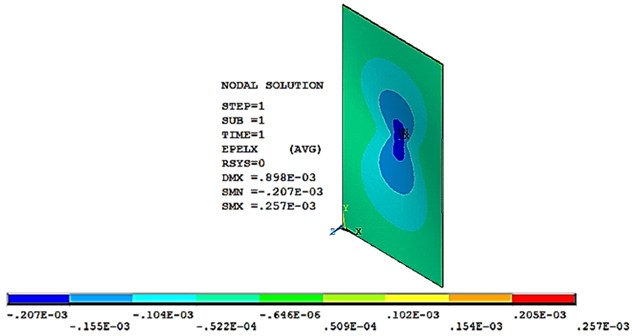
Fig. 14Numerical strain in Y-direction for the loaded plate P= –490.5 N
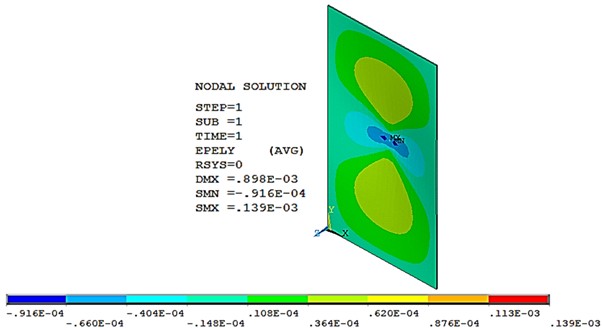
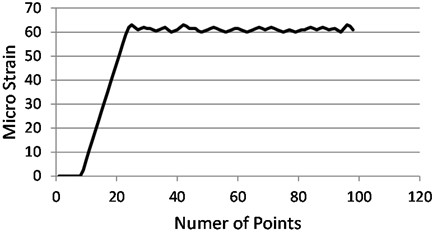
Fig. 15 shows the values of strain in -direction when the load was increased gradually from zero to –490.5 N. It is clear that the value of 0.000207, the induced strain in -direction at the same load 0.000063 as obvious in Fig. 16. The entire results of plate test at arbitrary loads are summarized in Tables 3 and 4.
Table 3Numerical and experimental strains of the examined rectangular plate in X-direction
Load in -direction | Error % | |||
(kg) | (N) | Numerical | Experimental | |
25 | –245.25 | 0.000103 | 0.000110 | 2.9 |
50 | –490.5 | 0.000207 | 0.000214 | 3.3 |
75 | –735.75 | 0.00031 | 0.000280 | 9.6 |
100 | –981 | 0.000413 | 0.000381 | 7.7 |
Average | 5.8 % | |||
Table 4Numerical and experimental strains of the examined rectangular plate in Y-direction
Load in -direction | Error % | |||
(kg) | (N) | Numerical | Experimental | |
25 | –245.25 | 0.000045 | 0.000045 | 0 |
50 | –490.5 | 0.000066 | 0.000063 | 4.5 |
75 | –735.75 | 0.000098 | 0.000095 | 3 |
100 | –981 | 0.000132 | 0.000120 | 9 |
Average | 4.1 % | |||
Fig. 15Experimental strain in X-direction for the loaded plate P= –490.5 N
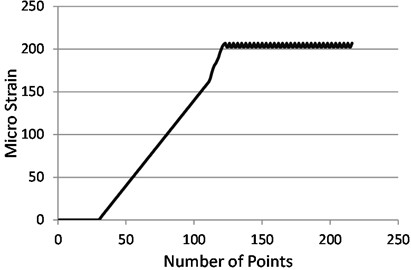
Fig. 16Experimental strain in Y-direction for the loaded plate P= –490.5 N
The percentage error between numerical and experimental was calculated from following formula:
Moreover, the plots of Figs. 17 and 18 show the relation between the applied load and the generated strains in longitudinal and lateral directions of the loaded plate.
5. Discussion
It is obvious in Table 2 that a good agreement between analytical and experimental strain values were obtained in beam test with average error value of 5.7 % and the convergence between estimated results is clear in Fig. 12. Several studies have used DIC for validation of FEM outcomes. Also, numerous prior studies utilized DIC strain measurement methods in comparison with a rosette strain gages. Based on this aspect, in the work of the authors [29] the percentage differences of the DIC (14.8 %) and the strain gage technique (14 %) for the metal alloy compared to FEM results. The paper in [30] recorded an average percentage error 16 % between dial_gauge and DIC displacement determination in a cantilever beam test, whereas an average percentage error was 18 % between FEM and DIC for the same test. In the current study the rectangular plate test a reasonable convergence was achieved as illustrated in Tables 3 and 4. The perfect analytical boundary conditions are hardly to performed identically in experimental test which cause a difference between numerical and experimental results. The average percentage errors were, namely: 5.8 % for the strains calculated in -direction and 4.1 % in -direction measured strains. However, the current conducted tests data seemed closely agreed in Figs. 17 and 18.
Fig. 17Load and ϵx relation
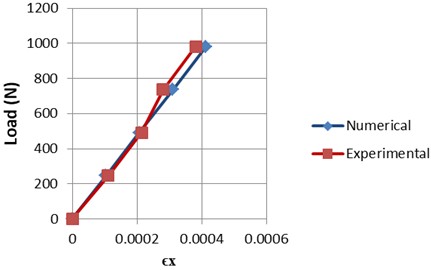
Fig. 18Load and ϵy relation
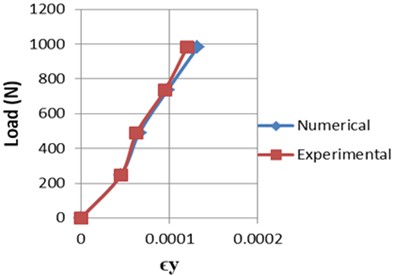
Fig. 19The load applied and removed for multi periods in beam test
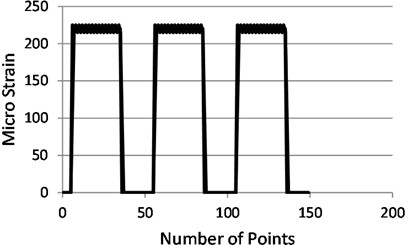
In the recent years numerous researches work on strain calculation utilizing image processing strategies. The research article in [31] introduced a comparison between Tensometric Technique and DIC for longitudinal and transverse strain estimation for the specimens of road materials. The conducted results showed an average percentage errors 7.2 % and 9.4 % in lateral and longitudinal estimated strains between the two adopted approaches. Also, in the examined plastic film blowing process presented in [32] an average percentage errors for the value of Langrangean was 29.1 % and Eulerian was 16.71 %, between DIC and Gride Method, while the corresponding percentages in were 3.8 % and 5.49 % respectively. Thus, according to the documented studies in literatures, the difference in results when using various measuring techniques is inherent and the resulted an average error in the present study is close to the published previous studies. In addition, to ensure the repetition reliability of the measuring devices, a certain load was applied more than one period as obvious in Fig. 19 where the same amplitude was reached during frequent load application. Finally, the proposed experimental test approach recorded high accuracy and achieved the aim of this work.
6. Conclusions
The current work proposed an alternative to commercial strain measuring equipment through the Arduino controller and low-cost components. The main benefit of utilizing cheap devices is to allow for the students and researchers who usually far away from dealing with deformation instrumentation because of the high cost of the apparatus and the complexity of their operation, to do experimental tests that involve programming, electronics and instrumentation in a simple and intuitive mean. The results verification ensured the reliability of the proposed system, since it appeared good precision through recording data close to the numerical and analytical values. The hardware used is of easy operation and its components are also well available in the literature. The proposed measuring system is low cost, reliable, portable and has compact size. Furthermore, future application of the current idea is to perform experiments for impact, vibration and dynamic load problems.
References
-
“Practical strain gauge measurements,” Omega Engineering, Agilent Technologies, 1999.
-
J. F. Doyle, “Modern experimental stress analysis,” Purdue University, Lafayette, USA, 2004.
-
M. Stoehr, G. Gerlach, T. Härtling, and S. Schoenfelder, “Analysis of photoelastic properties of monocrystalline silicon,” Journal of Sensors and Sensor Systems, Vol. 9, No. 2, pp. 209–217, Jul. 2020, https://doi.org/10.5194/jsss-9-209-2020
-
Z. Ren, H. Xie, and Y. Ju, “Determination of the stress and strain fields in porous structures by photoelasticity and digital image correlation techniques,” Polymer Testing, Vol. 102, p. 107315, Oct. 2021, https://doi.org/10.1016/j.polymertesting.2021.107315
-
Y. Y. Aristizabal-López, J. C. B. de León, A. R. Martínez, and H. A. Fandiño-Toro, “Integrated computational analysis of digital photoelasticity and thermoelastic stress analysis,” in Visión Electrónica, Vol. 16, Universidad Distrital Francisco Jose de Caldas, 2024, https://doi.org/10.14483/issn.2248-4728
-
L. Chen, M. Zhang, D. Li, and Y. Li, “Visualization and quantification of the stress distribution on epoxy resin through photoelasticity and infrared radiation techniques,” AIP Advances, Vol. 12, No. 1, Jan. 2022, https://doi.org/10.1063/5.0074643
-
M. Marín-Miranda, A. M. Wintergerst, Y. A. Moreno-Vargas, M. L. A. Juárez-López, and C. Tavera-Ruiz, “Photoelasticity for stress concentration analysis in dentistry and medicine,” Materials, Vol. 15, No. 19, p. 6819, Sep. 2022, https://doi.org/10.3390/ma15196819
-
M. Kempny, “Digital image correlation – method development, scope, principle of functioning, and future goals,” Journal of Metallic Materials, Vol. 74, No. 3-4, pp. 30–41, Dec. 2022, https://doi.org/10.32730/imz.2657-747.22.3-4.4
-
M. A. Zaya, S. M. Adam, and F. H. Abdulrahman, “Application of digital image correlation method in materials – testing and measurements: a review,” The Journal of University of Duhok, Vol. 26, No. 2, pp. 145–167, Sep. 2023, https://doi.org/10.26682/sjuod.2023.26.2.13
-
P. Bogusz, “Digital image correlation analysis of strain fields in fibre-reinforced polymer-matrix composite under ±45° off-axis tensile testing,” Polymers, Vol. 15, No. 13, p. 2846, Jun. 2023, https://doi.org/10.3390/polym15132846
-
I. Irwansyah, M. Dirhamsyah, E. Iswardy, T. Nanta Aulia, M. Alkindi, and S. N. Diah Fitriani, “Experimental study of strain measurement using 2D digital image correlation on fixation plate and calcaneus bone fracture,” in Journal of Physics: Conference Series, Vol. 2739, No. 1, p. 012049, Apr. 2024, https://doi.org/10.1088/1742-6596/2739/1/012049
-
D. V. Nelson, “Residual stress determination using full-field optical methods,” Journal of Physics: Photonics, Vol. 3, No. 4, p. 044003, Oct. 2021, https://doi.org/10.1088/2515-7647/ac1ceb
-
D. Halabuk and T. Navrat, “The effect of third principal stress in the measurement of residual stresses by hole-drilling method,” in MATEC Web of Conferences, Vol. 237, p. 01012, 2018, https://doi.org/10.1051/matecconf /201823701012
-
M. Beghini, L. Bertini, A. Giri, C. Santus, and E. Valentini, “Measuring residual stress in finite thickness plates using the hole-drilling method,” The Journal of Strain Analysis for Engineering Design, Vol. 54, No. 1, pp. 65–75, Jan. 2019, https://doi.org/10.1177/0309324718821832
-
M. D. Olson, A. T. Dewald, and M. R. Hill, “Precision of hole-drilling residual stress depth profile measurements and an updated uncertainty estimator,” Experimental Mechanics, Vol. 61, No. 3, pp. 549–564, Nov. 2020, https://doi.org/10.1007/s11340-020-00679-1
-
M. Ammar, B. Shirinzadeh, K. Lai, and W. Wei, “On the sensing and calibration of residual stresses measurements in the incremental hole-drilling method,” Sensors, Vol. 21, No. 22, p. 7447, Nov. 2021, https://doi.org/10.3390/s21227447
-
E. Polyzos et al., “Measuring and predicting the effects of residual stresses from full-field data in laser-directed energy deposition,” Materials, Vol. 16, No. 4, p. 1444, Feb. 2023, https://doi.org/10.3390/ma16041444
-
S. Braut, A. Pavlović, P. Beño, and M. Babić, “Measuring strain in sheet metals,” FME Transactions, Vol. 47, No. 3, pp. 477–486, Jan. 2019, https://doi.org/10.5937/fmet1903477b
-
M. A. Gharaibeha, A. A. Ismail, A. F. Al-Shammary, and O. A. Ali, “Three-material beam: experimental setup and theoretical calculations,” Jordan Journal of Mechanical and Industrial Engineering, Vol. 13, No. 4, pp. 253–264, 2019.
-
D. Zhang, J. Zhou, and K. Mao, “Simulational and experimental study of stress in bolts work-piece,” Journal of Measurements in Engineering, Vol. 8, No. 2, pp. 46–61, Jun. 2020, https://doi.org/10.21595/jme.2020.21209
-
M. Rajic et al., “Experimental and numerical stress and strain analysis of the boiler reversing chamber tube plate,” Thermal Science, Vol. 26, No. 3 Part A, pp. 2135–2145, Jan. 2022, https://doi.org/10.2298/tsci210313207r
-
G. A. Kushner, “Dynamic strain measurement of propeller shaft vibrations,” in Journal of Physics: Conference Series, Vol. 2091, No. 1, p. 012050, Nov. 2021, https://doi.org/10.1088/1742-6596/2091/1/012050
-
D. N. Van, C. D. Manh, and S. D. Van, “Experimental and numerical studies on the role of dynamic stress in vibratory stress relieving process,” International Journal of Mechanical Engineering and Robotics Research, Vol. 11, No. 9, pp. 690–697, Jan. 2022, https://doi.org/10.18178/ijmerr.11.9.690-697
-
R. K. Kumar and K. Khan, “Experimental stress and vibration analysis of hybrid composite laminated cracked beam,” NanoWorld Journal, Vol. 9, No. S1, pp. 513–517, Jan. 2023, https://doi.org/10.17756/nwj.2023-s1-099
-
B. Da Silva Falcão et al., “Strain measurement with multiplexed FBG sensor arrays: An experimental investigation,” Heliyon, Vol. 9, No. 8, p. e18652, Aug. 2023, https://doi.org/10.1016/j.heliyon.2023.e18652
-
J. F. Hunt, H. Zhang, and Y. Huang, “Analysis of cantilever-beam bending stress relaxation properties of thin wood composites,” BioResources, Vol. 10, No. 2, pp. 3131–3145, Apr. 2015, https://doi.org/10.15376/biores.10.2.3131-3145
-
P. Tutak, “Application of strain gauges in measurements of strain distribution in complex objects,” Journal of Applied Computer Science Methods, Vol. 6, No. 2, pp. 135–145, Dec. 2014, https://doi.org/10.1515/jacsm-2015-0004
-
D. Ronzani, “Introduction to Arduino,” University of Padua, 2017.
-
S. E. Hensley, M. L. Christensen, S. R. Small, D. B. Archer, E. H. Lakes, and R. D. Rogge, “Digital image correlation techniques for strain measurement in a variety of biomechanical test models,” Acta of Bioengineering and Biomechanics, Vol. 19, No. 3, Jan. 2017, https://doi.org/10.5277/abb-00785-2016-04
-
T. Prabaharan, P. Periasamy, N. Ramanan, and E. Naveen, “Experimental study of plane displacement and strain measurement using digital image correlation in Matlab and validation by Ansys,” International Journal of Mechanical Engineering and Technology, Vol. 9, No. 13, pp. 1378–1389, 2018.
-
J. Górszczyk, K. Malicki, and T. Zych, “Application of digital image correlation (DIC) method for road material testing,” Materials, Vol. 12, No. 15, p. 2349, Jul. 2019, https://doi.org/10.3390/ma12152349
-
K. Muniandy, Z. Mohamad Ariff, and A. Abu Bakar, “Digital image correlation utilization in measuring displacement and strain during plastic film blowing process: A feasibility study,” Measurement, Vol. 136, pp. 487–500, Mar. 2019, https://doi.org/10.1016/j.measurement.2018.12.093
About this article
The authors have not disclosed any funding.
The datasets generated during and/or analyzed during the current study are available from the corresponding author on reasonable request.
Mohammed Hameed, proposed the research idea and developed the methodology. Also collected the data, processed them using the selected methodology, tabulated, and presented the results. Mohammed Saleh performed works related to the programming and wiring of the electronic devices. Both authors discussed the results and contributed to the final manuscript.
The authors declare that they have no conflict of interest.
