Abstract
This study aims to address the growing urban heat challenges by exploring the application of AI-driven simulations to improve outdoor thermal comfort and air quality in urban parks. The primary goal was to optimize park designs using advanced AI technologies and data analysis, improving the quality of public green spaces. A highly accurate AI model was employed, with performance metrics including RMSE (3.68 °C), MAPE (6.50 %), and a Pearson Correlation Coefficient of 0.982, to evaluate key environmental parameters such as temperature, wind speed, and thermal radiation. These assessments served as the foundation for design optimization through the integration of AI and Computational Fluid Dynamics (CFD) modeling. Innovative design improvements, such as enhanced shading structures, strategic vegetation placement, and refined material selection, resulted in a 15 % reduction in thermal radiation, a 1 m/s increase in wind speed, and a decrease in PM2.5 and PM10 concentrations by 12 % and 15 %, respectively. These changes led to increased pedestrian comfort, improved health outcomes, and a 20 % rise in park usage. Post-optimization analysis further demonstrated a 25 % reduction in thermal radiation and a 10 % improvement in the Air Quality Index (AQI). Furthermore, resilience testing for short-term climate changes indicated that these design improvements would remain effective for at least three years, confirming the robustness and long-term sustainability of the AI-enhanced strategies. This research highlights the potential of integrating AI technologies in urban park design, offering valuable insights into creating sustainable, user-centered green spaces. By combining real-world environmental data with AI-driven optimization, the study emphasizes the importance of interdisciplinary approaches in enhancing the livability and resilience of urban environments.
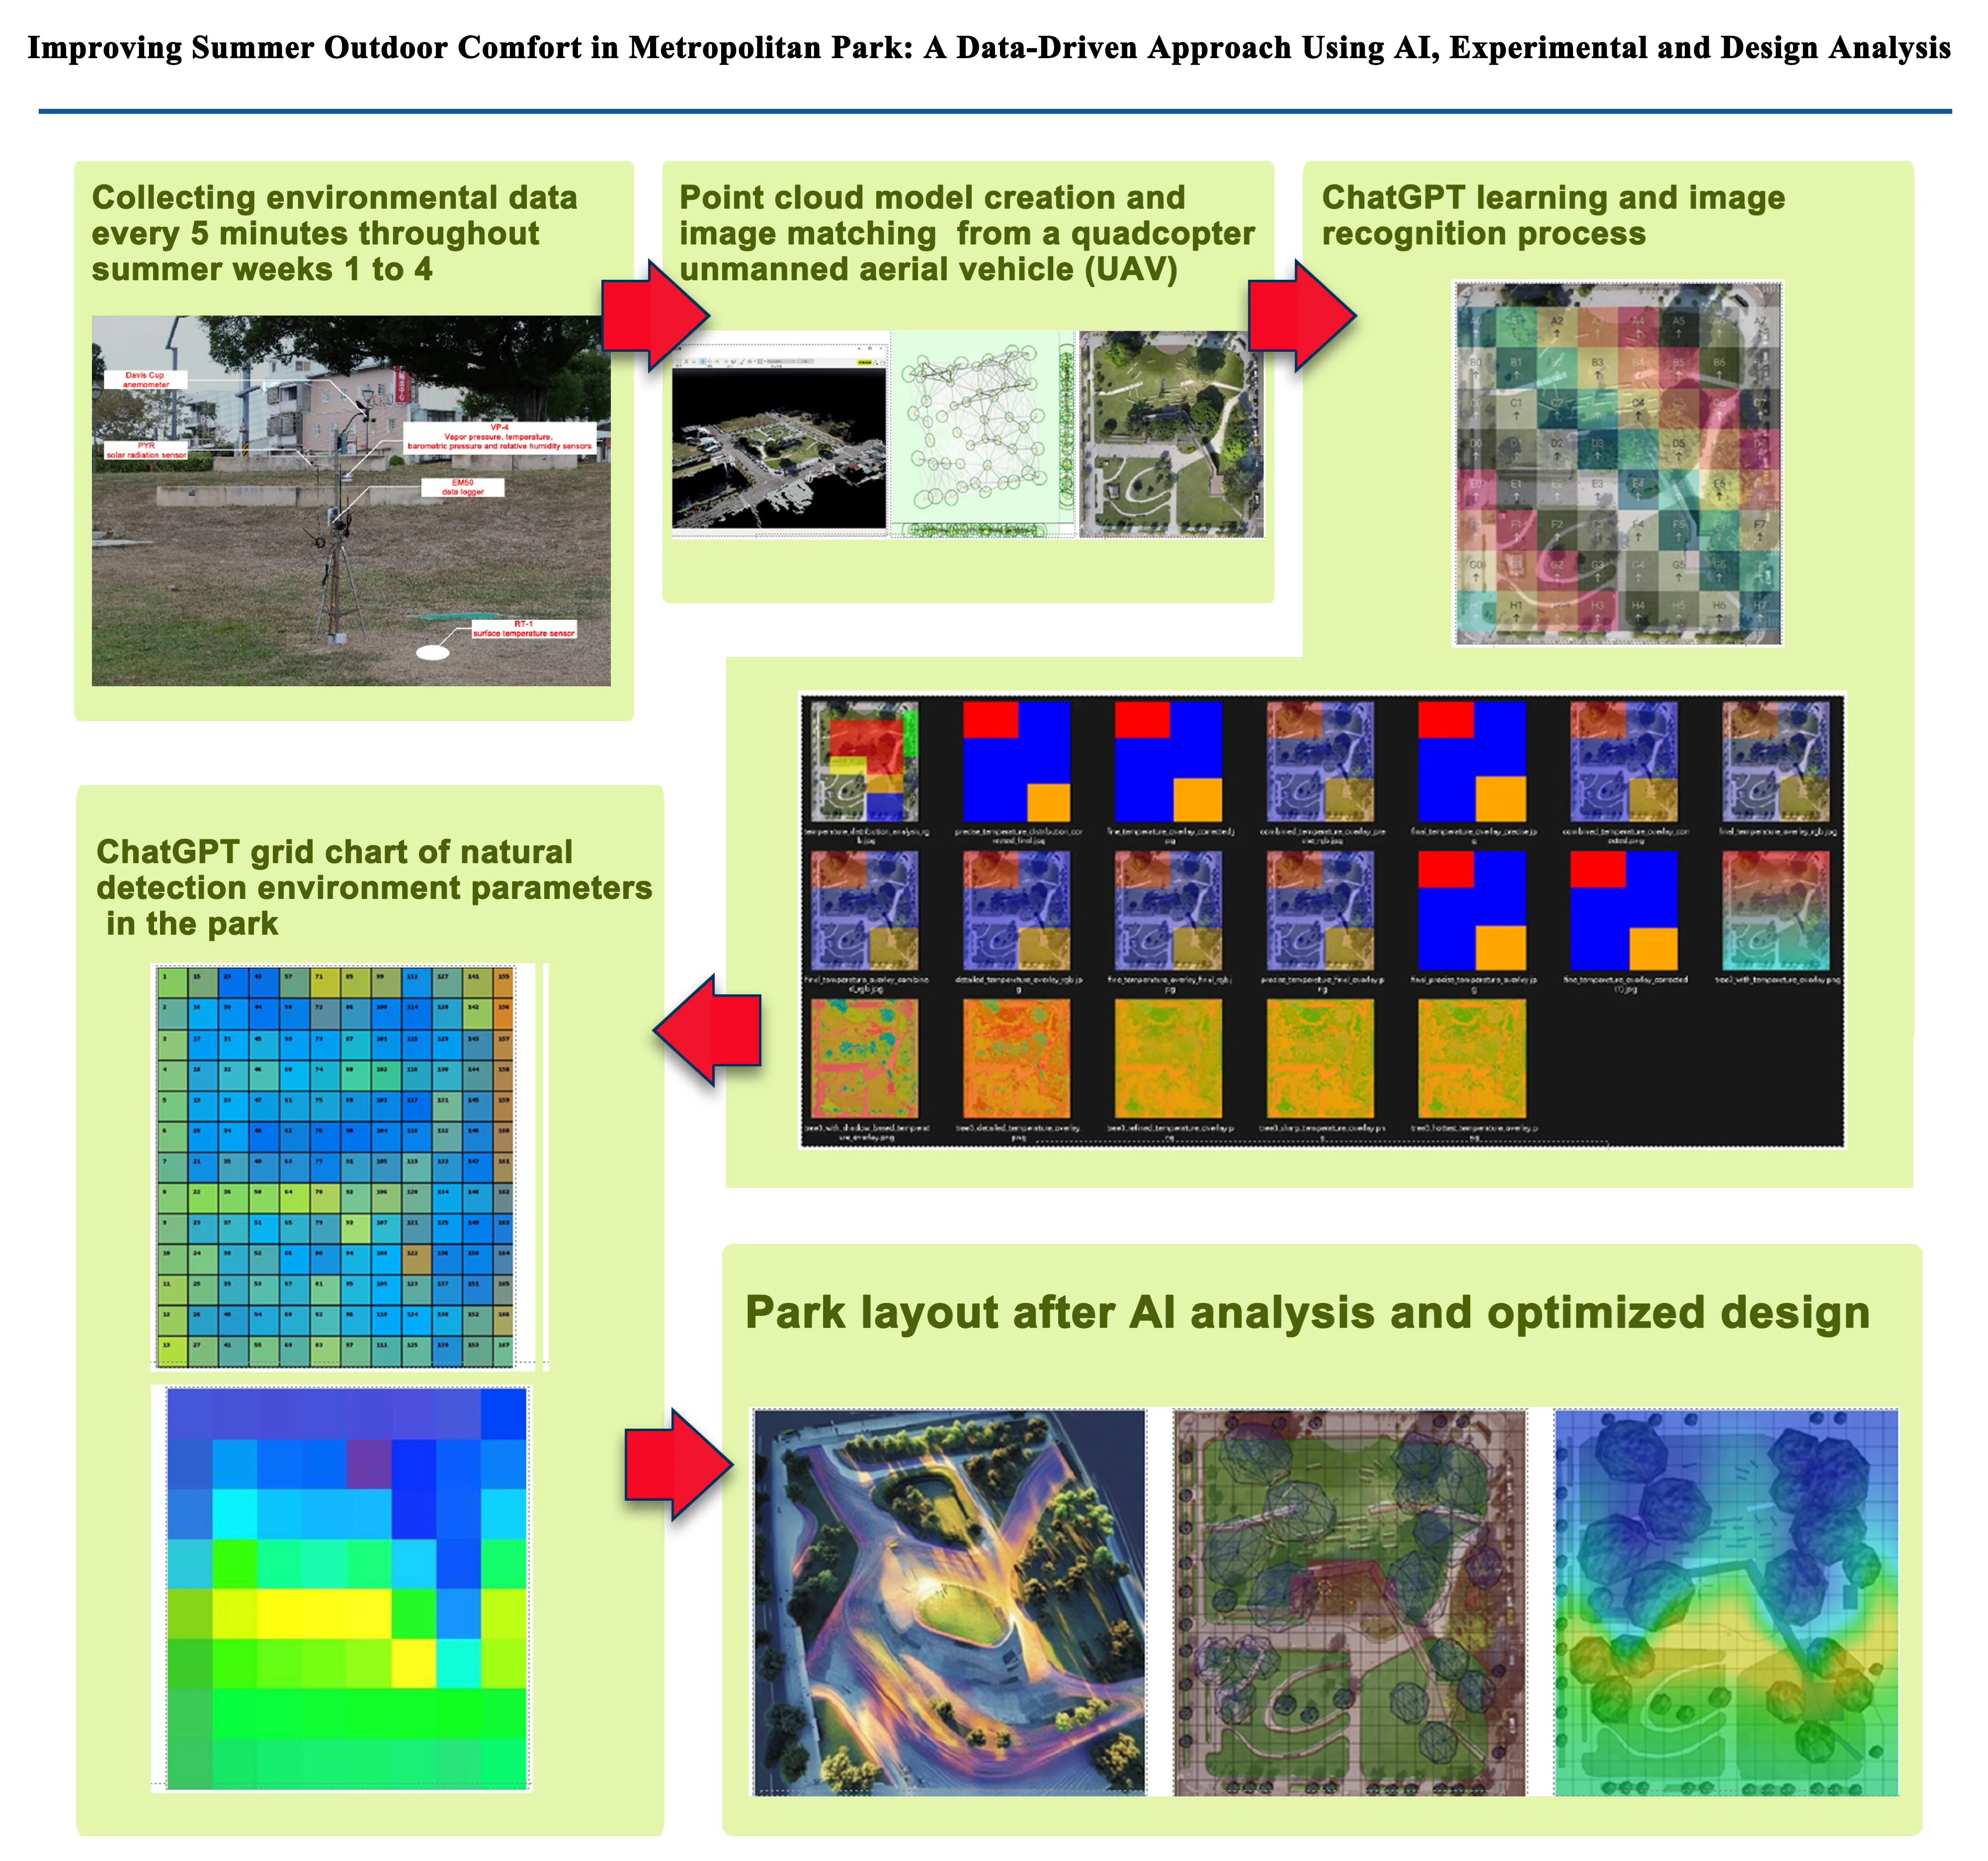
Highlights
- Advanced AI models integrated with CFD achieved a 15% reduction in thermal radiation and a 10% improvement in air quality, enhancing urban park usability by 20%.
- High-precision data collection and AI-driven predictions demonstrated a strong correlation (r = 0.982) with real-world measurements, ensuring reliable design improvements.
- Optimized park designs showed resilience to short-term climate shifts, maintaining improved pedestrian comfort and air quality for three years.
1. Introduction
Urban parks, as vital green spaces, significantly enhance the quality of life in densely populated cities. They not only offer essential recreational opportunities and promote social interaction but also provide residents with a sanctuary to escape urban noise, contributing to overall well-being. Additionally, these parks play a crucial role in mitigating the urban heat island effect [1-4]. However, outdoor comfort in these spaces is heavily influenced by climatic factors such as temperature, humidity, thermal radiation, and wind speed [5-10]. As cities continue to expand, urban planners and landscape designers face increasing challenges in creating public spaces that are both aesthetically appealing and comfortable for users [11-13].
In recent years, the rapid development of artificial intelligence (AI) has opened new pathways for optimizing urban park design. By integrating AI with environmental prediction models and computational analysis, designers can achieve a deeper understanding of how specific design choices impact user comfort [14-18]. Tools such as Midjourney AI offer innovative design solutions by processing complex environmental data, while ChatGPT’s predictive capabilities, combined with computational fluid dynamics (CFD) analysis, provide comprehensive methods for enhancing the comfort of park visitors [19].
The application of AI in urban park design-particularly concerning outdoor thermal comfort-has gained increasing attention. Models like Artificial Neural Networks (ANN) and Deep Neural Networks (DNN) have shown high accuracy in predicting pedestrian comfort, with R² values of 0.907 and 0.931, respectively [20]. Additionally, predictive indices like the Universal Thermal Climate Index (UTCI), Physiological Equivalent Temperature (PET), and Standard Effective Temperature (SET) offer valuable tools for evaluating outdoor comfort under varying environmental conditions [21-23]. CFD simulations further support this by providing detailed analyses of urban geometry, vegetation cover, and microclimatic factors [24]. The Hong Kong Outdoor Thermal Comfort Index (HKOTCI) combines these variables to deliver a holistic assessment of pedestrian comfort in subtropical climates [25].
This study distinguishes itself by pioneering the combined use of AI-driven design tools, such as Midjourney AI, ChatGPT, and CFD analysis, in the development of urban parks. Unlike traditional design methods that rely on static models and limited environmental data, our approach integrates real-time environmental predictions with advanced AI simulations. Central to our methodology is the creation of accurate 3D models using drone-captured imagery. These models serve as a foundation for subsequent AI analyses, where tools like Midjourney AI simulate design improvements and evaluate their impact on pedestrian comfort.
By leveraging AI to predict future climate scenarios, this study enables a dynamic, adaptive, and data-driven design process. The integration of aerial photography and precision modeling ensures that design decisions reflect real-world conditions, enhancing the detail and accuracy of the analysis. This methodology not only addresses current environmental challenges but also facilitates the evaluation of multiple design strategies.
This research, grounded in experimental data from real-world sites and enhanced by cutting-edge technology, offers landscape designers a streamlined, technology-driven approach to analyzing outdoor comfort in parks. By reducing reliance on trial and error, it empowers designers to achieve optimized designs with greater precision and efficiency. Our findings aim to inspire informed decision-making, fostering the creation of sustainable, comfortable, and engaging urban spaces that meet the evolving needs of contemporary cities.
2. Materials and methods
This study employs a combination of advanced technologies and environmental analysis techniques to optimize outdoor comfort in urban parks. Site selection and data collection involve identifying suitable park locations and gathering real-time data on temperature, humidity, solar radiation, and wind speed through environmental monitoring. Using environmental spatial 3D modeling, detailed 3D models are created from drone-captured aerial imagery to provide a precise representation of the park’s layout. Computational Fluid Dynamics (CFD) analysis is then applied to simulate airflow and thermal distribution, offering insights into microclimatic conditions. AI model implementation and prediction incorporate tools like ChatGPT to forecast comfort levels based on environmental factors. Additionally, Midjourney AI design optimization generates and refines innovative design solutions. Finally, proposed statistical metrics for analysis are used to verify the accuracy and precision of AI simulations, ensuring reliable and effective design outcomes.
2.1. Site selection and data collection
This study was conducted in a public park, where environmental parameters such as temperature, humidity, solar radiation and wind speed were continuously monitored. Data collection and analysis were performed using various tools and techniques outlined below.
2.1.1. Outdoor environmental monitoring
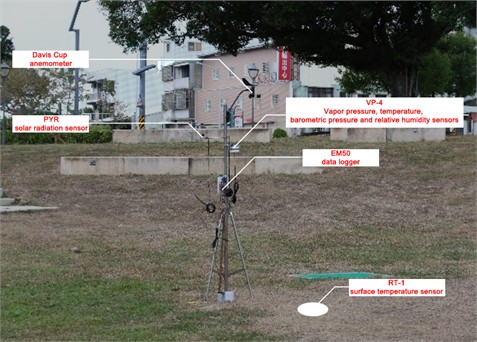
This study focuses on analyzing outdoor environmental factors by examining the microclimate within the 0 to 2-meter height range above the ground, emphasizing its impact on human living environments. The monitoring instruments were set up at an approximate height of 1.5 meters to simulate the average height of human perception, ensuring the representativeness and reliability of the data. Environmental monitoring was conducted using the EM50 multi-functional data logger station for continuous data collection, with equipment configuration shown in Fig. 1. The key components include the EM50 data logger, responsible for recording all environmental parameters; the VP-4 temperature and humidity sensor, used to monitor air temperature and relative humidity; the PYR Solar Radiation sensor, measuring solar radiation intensity; the RT-1 surface temperature sensor, fixed to key elements in the study area such as grass, concrete pavement, and PE plastic wood structures, for precise surface temperature measurements; and the Davis Cup wind speed and direction sensor, which records wind speed and direction to analyze wind field dynamics. The study employed an automated continuous monitoring method, collecting environmental data every 5 minutes throughout summer weeks 1 to 4, covering the full daily cycle (0 to 24 hours). Through comprehensive analysis, the study accurately captures the microclimate variations of grass, concrete pavement, and PE plastic wood structures, providing critical data and a solid foundation for future environmental adaptation and optimization efforts.
Air quality was monitored using a PMS3003 particulate matter sensor, which recorded PM1.0, PM2.5, and PM10 concentrations. The system was built with an Arduino Uno as the central processing unit, a PMS3003 sensor for particulate matter measurement, and an XD-204 data logging shield to store the data on an SD card. The shield also provided real-time clock (RTC) functionality to ensure accurate timestamping of the measurements.
Fig. 1Experimental equipment for outdoor environmental parameters
2.1.2. Environmental spatial 3D modeling
The study employed a quadcopter unmanned aerial vehicle (UAV) for site modeling. A 3DR Solo drone, equipped with a GoPro Hero 4 camera, was used to capture aerial images at various angles (90°, 60°, 30°). These images were processed using Pix4Dmapper to develop a high-precision 3D model of the park, which was later used for computational analysis and design optimization.
2.2. Computational fluid dynamics (CFD) analysis
The study applied computational fluid dynamics (CFD) simulations to model airflow and temperature variations in the park, using the Navier-Stokes equations:
where: represents velocity field; is pressure; is air density; is kinematic viscosity.
Design Modifications with AI Tools: AI-assisted tools, including Midjourney AI, were used to modify park designs based on outdoor comfort data and airflow analysis. These modifications aimed to enhance airflow, increase shading, and optimize thermal comfort.
CFD Simulation Setup: The CFD simulations were run using software capable of analyzing air velocity and temperature before and after the design improvements. Parameters like airflow, temperature distribution, and wind patterns were compared to assess the impact of the new designs.
2.3. AI model implementation and prediction
In this study, real-time outdoor experimental data, including temperature, humidity, wind speed, and solar radiation, were input into the transformer-based AI model, ChatGPT, for analysis and prediction. The data, collected using various environmental sensors, were processed by the AI to forecast environmental trends such as temperature, humidity, and wind speed. ChatGPT’s capability to handle complex data patterns was further enhanced by incorporating the Universal Thermal Climate Index (UTCI), which was used to quantify outdoor comfort levels. The AI model played a crucial role in predicting future conditions based on the experimental data, providing valuable insights for optimizing outdoor comfort, calculated as:
where: is air temperature; mean radiant temperature; is wind velocity; is relative humidity.
ChatGPT Prediction Model: ChatGPT employed transformer architecture for time-series forecasting, using historical data to predict future environmental conditions. The prediction model is represented as:
where: represents predicted value at time ; historical data from time 1 to .
2.4. Midjourney AI design optimization
This study employed the Hong Kong Outdoor Thermal Comfort Index to evaluate thermal radiation, temperature, humidity, and wind speed in the park, with the goal of improving outdoor pedestrian comfort. The index considers multiple climatic variables, and our analysis of thermal radiation and temperature revealed that high temperatures and intense solar radiation significantly reduce pedestrian comfort. Proper wind speed can help dissipate heat and alleviate discomfort in high-humidity environments. Adjusting wind speed and direction is particularly crucial, and we optimized airflow in the park through wind field analysis and design.
In the design optimization process, Midjourney AI was integrated with environmental data predictions from ChatGPT. The detailed steps are as follows:
1) Input Data Sources: Midjourney AI utilized environmental data from ChatGPT, including temperature, humidity, solar radiation, and wind speed/direction diagrams, aiding in precise design optimization.
2) Design generation and optimization process involved several key steps. First, environmental data provided by ChatGPT was input into Midjourney AI to inform design optimization. Specific design goals were established, focusing on improving airflow and increasing shading within the park. Based on these objectives, Midjourney AI generated design suggestions, which included adjusting the placement of buildings and vegetation. This optimization aimed to enhance airflow and reduce heat radiation, ultimately improving pedestrian comfort in the outdoor environment.
3) Image Optimization Process: Midjourney AI applied the diffusion process to optimize images. This process gradually removes noise from the initial image, with the following mathematical equation:
where, represents the image at step ; is a variable that controls the amount of noise added at each step; is the random noise, sampled from a Gaussian distribution with zero mean and unit variance, denoted as .
This equation models the progressive removal of noise, eventually producing a design aligned with environmental goals.
4) Feedback Loop and Design Validation: The designs generated by Midjourney AI were validated through Computational Fluid Dynamics (CFD) analysis. By comparing pre- and post-design modifications, the study assessed whether the park design achieved improvements in outdoor comfort.
The workflow diagram showcases the process, Fig. 2(a), combining ChatGPT’s data predictions, CFD analysis, and Midjourney AI’s design optimization to deliver a data-driven solution for park design during summer, significantly enhancing outdoor pedestrian comfort. Fig. 2(b) shows the ChatGPT and Midjourney AI training process.
2.5. Proposed statistical metrics for analysis
To assess the precision of AI-simulated data in comparison with experimental measurements, the analysis employed key statistical metrics, including Root Mean Square Error (RMSE), Mean Absolute Percentage Error (MAPE), and Pearson Correlation Coefficient (). These metrics provide a comprehensive evaluation of accuracy and correlation, ensuring robust validation of the simulated data. the following statistical metrics were applied, as follows:
1) Root Mean Square Error (RMSE). RMSE measures the average deviation between AI-simulated values and experimental values:
where, is AI-simulated value; is experimental value.
2) Mean Absolute Percentage Error (MAPE). MAPE evaluates the percentage error of AI-simulated values relative to experimental values:
3) Pearson Correlation Coefficient (). The Pearson coefficient quantifies the correlation between AI-simulated and experimental values:
where, mean of experimental values; mean of AI-simulated values.
Fig. 2Midjourney AI design optimization and analysis flowchart
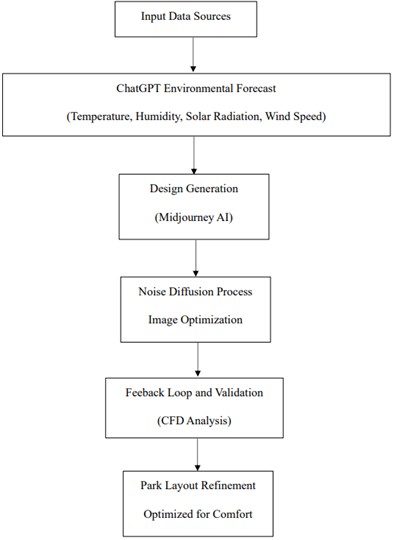
a) Design optimization and analysis flowchart
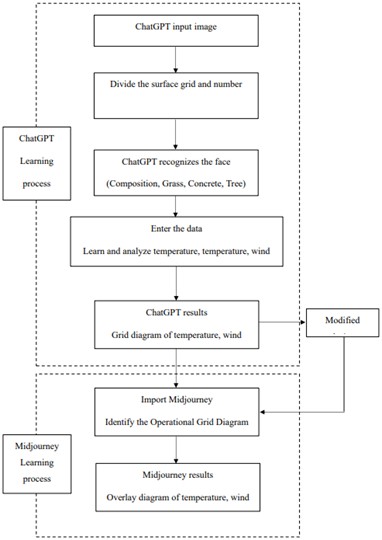
b) Machine learning process
3. Results
3.1. ChatGPT prediction model overview
The prediction model utilizes an advanced Transformer architecture to analyze historical environmental data and forecast key factors impacting outdoor comfort, including temperature, humidity, thermal radiation and wind speed. By integrating this data into predictive algorithms, the system can project future trends and optimize park designs.
1) Prediction methodology and basis: with global warming accelerating, rising temperatures will significantly affect outdoor comfort in parks. The Intergovernmental Panel on Climate Change (IPCC) projects an annual temperature increase of 0.05 °C to 0.1 °C. This trend suggests that park conditions may become unsuitable for outdoor activities when temperatures exceed 35 °C. Additionally, different construction materials exhibit varying thermal properties; for instance, plastic wood may reach surface temperatures exceeding 70 °C, while concrete could surpass 50 °C, creating safety hazards. These temperature changes will be worsened by fluctuating wind speeds and declining air quality, complicating efforts to maintain comfortable outdoor environments.
2) Prediction results and recommendations: Predictions indicate that outdoor comfort in parks will decline as global temperatures rise. Surface temperatures could become dangerously high, with plastic wood exceeding 70 °C and concrete reaching 50 °C. Furthermore, as wind speeds fall below 2 m/s, perceived comfort will decrease sharply, increasing thermal strain on individuals. Lower wind speeds will also worsen air quality, potentially raising the concentration of airborne particulates (PM2.5 and PM10) by 10 % to 20 %, further degrading conditions for park users.
3) Input parameter suggestions. Accurate initial data and parameter inputs are essential for forecasting the impact of temperature on comfort, material surface temperatures, wind speed variations, and air quality. Table 1 summarizes key parameters and their predicted effects.
This table provides input parameters for Midjourney, assisting in analyzing outdoor comfort and future trends in parks, particularly regarding global warming impacts on temperatures, material changes, reduced wind speed, and air quality degradation.
Table 1Predicted data generated by ChatGPT for input into midjourney analysis
Parameter category | Initial data | Change trend/impact coefficient | Description |
Temperature | 34.8 °C | Increases by 0.05 °C to 0.1 °C per year | Yearly predictions of temperature rise due to global warming and its impact on outdoor comfort |
Composite material temperature | 66.1 °C | Increases by 2°C to 3°C for every 1°C rise | Composite surfaces absorb heat; expected to exceed 70°C in the future |
Concrete material temperature | 48.1 °C | Increases by 2°C to 3°C for every 1°C rise | Concrete temperatures will rise above 50°C, posing a risk of heat-related injuries |
Grass material temperature | 32.5 °C | Increases by 1°C to 2°C for every 1°C rise | Grass heats up more slowly but will still impact outdoor comfort |
Wind speed | 2 m/s to 4 m/s | Decreases by 0.1 m/s to 0.5 m/s per year | Reduced wind speed will lower thermal comfort, worsening experiences in high temperatures |
PM2.5 concentration | 57.4 μg/m3 | Increases by 10 %-20 % for every 0.5 m/s decrease | Air quality declines with wind speed; reduced wind speeds lead to higher PM concentrations |
PM10 concentration | 50.0 μg/m3 | Increases by 5 %-15 % for every 0.5 m/s decrease | Similar to PM2.5, reduced wind speeds lead to higher PM10 concentrations, further impacting air quality |
3.2. 3D modeling results
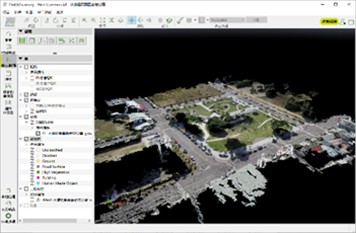
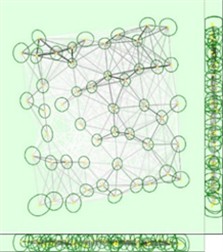
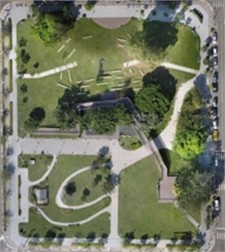
The accompanying Fig. 3, illustrates the 3D model developed from aerial images captured by a quadcopter unmanned aerial vehicle (UAV). This model reveals the intricate layout of the park, including vegetation, pathways, and existing structures. It serves as a vital tool for assessing the impacts of design modifications on airflow, shading, and overall comfort within the park environment.
Fig. 3Point cloud model creation and image matching from a quadcopter unmanned aerial vehicle (UAV)
3.3. Midjourney AI design optimization analysis results
During the optimization process of the park design, Midjourney AI successfully integrated environmental data and made various adjustments and improvements to enhance outdoor pedestrian comfort. Through in-depth analysis of parameters such as temperature, humidity, thermal radiation, and wind speed, the AI-generated design scheme effectively optimized airflow and shading effects. The specific results are as follows:
3.3.1. Environmental data integration
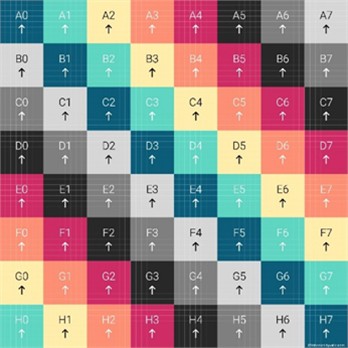
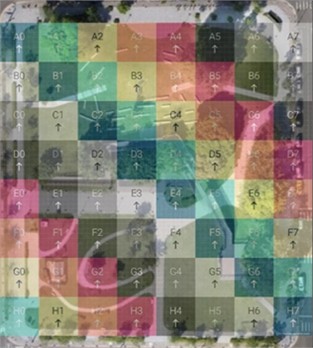
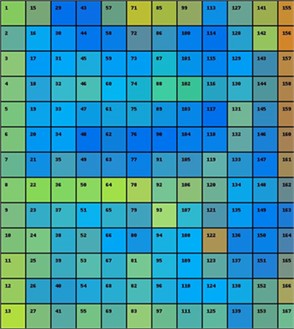
Midjourney AI conducted a comprehensive design analysis based on the environmental forecast data obtained from ChatGPT. As shown in Fig. 4, this data encompasses important indicators such as temperature, humidity, solar radiation and wind speed, helping the design team accurately assess the feasibility and comfort level of the park design. Fig. 5 shows the process of ChatGPT learning and identifying images. Fig. 6(a) shows the grid map of park temperature map learned and analyzed by ChatGPT. Fig. 6(b) shows the grid map of wind speed and direction in the park learned and analyzed by ChatGPT.
Fig. 4ChatGPT cutting and element calibration diagram
a) ChatGPT segmentation grid
b) Calibration element position
Fig. 5ChatGPT learning and image recognition process
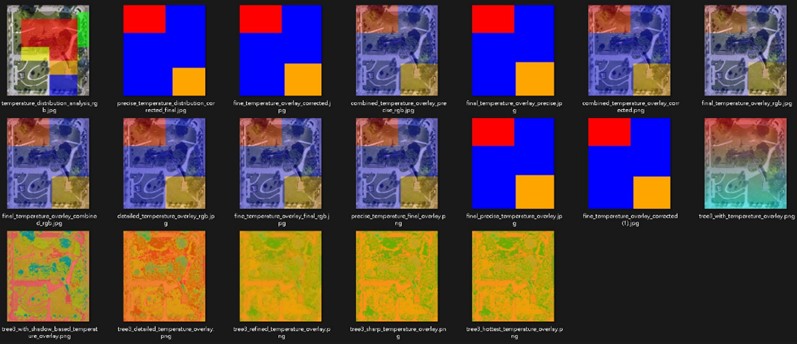
Fig. 6ChatGPT grid chart of natural detection environment parameters in the park
a) A grid diagram showing the park temperature map from ChatGPT

b) A grid diagram showing the wind speed and direction of the park from ChatGPT
3.3.2. Design recommendations generation
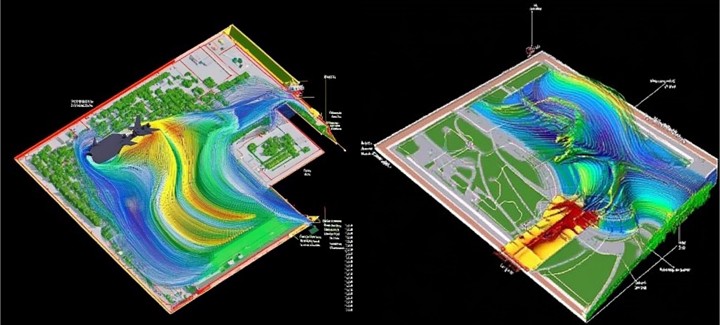
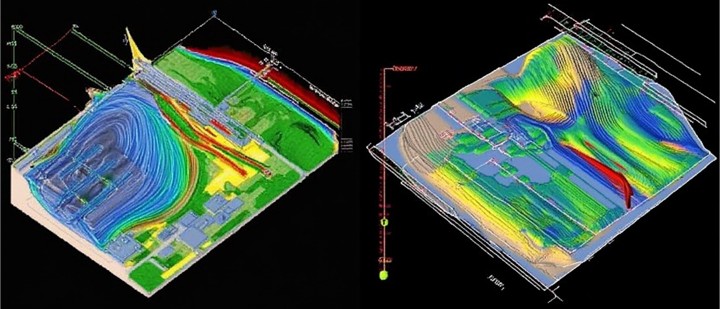
Based on the set design objectives, the AI proposed several recommendations, including adjustments to the placement of buildings and vegetation to optimize airflow and reduce thermal radiation, as illustrated in Fig. 7. These adjustments not only improved comfort within the park but also enhanced ecological benefits.
Fig. 7ChatGPT and Midjourney revised design analysis process chart including temperature, humidity, solar radiation and wind environment
3.3.3. Design image optimization
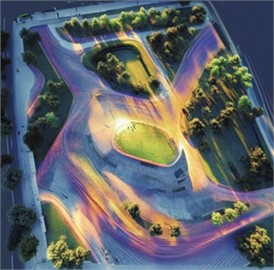
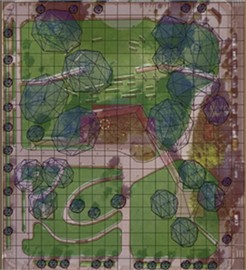
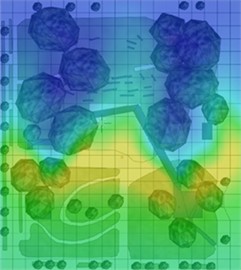
Midjourney AI applied a noise diffusion process, iteratively removing unnecessary noise from the initial design, ultimately generating a refined design image that meets environmental objectives. This process ensured harmony between the design details and the overall effect, as shown in Fig. 8.
Fig. 8Park layout after AI analysis and optimized design
a) Noise reduction analysis results
b) AI revised design results
c) Iteration diagram after revised design
3.3.4. Design verification and feedback
The generated design scheme was validated through computational fluid dynamics (CFD) analysis, confirming the effectiveness of the design improvements in enhancing park comfort. The results indicated that the adjusted design scheme significantly improved the outdoor pedestrian experience, especially during hot summer months.
3.3.5. Comparative analysis of atmospheric temperature across different park zones during summer
This study examines atmospheric temperature variations across different zones within the park during summer at 8 a.m., noon, and 4 p.m. The analyzed zones include the park plaza (BG), elevated areas (H), low-lying regions (L), grass-covered areas (grass), concrete surfaces (concrete), and composite wood sections (PE). The results encompass CFD simulation analyses, comparisons of experimental data, and AI-generated simulations, as summarized in Tables 2 to 4. The temperature discrepancies among these zones are illustrated in Fig. 9 to 11. From the tables and figures, it is evident that the AI-simulated data closely align with the experimental measurements, demonstrating a high level of accuracy.
To thoroughly evaluate the accuracy of AI simulations, this study employed the proposed statistical analysis methods to ensure a robust and precise assessment. The results of these calculations, which provide a comprehensive evaluation of the AI model’s performance, are summarized in Table 5. This detailed analysis highlights the alignment between AI-simulated data and observed measurements, reinforcing the reliability of the simulation.
The results of the statistical analysis in Table 5 confirm that the AI-simulated data demonstrate exceptional accuracy and consistency when compared to experimental measurements. The Root Mean Square Error (RMSE), calculated at 3.68 °C, indicates a minimal average deviation between the simulated and observed values. Similarly, the Mean Absolute Percentage Error (MAPE) of 6.50 % reflects a negligible relative error. Moreover, the Pearson Correlation Coefficient of 0.982 underscores a strong positive correlation, signifying a close alignment between the trends in AI-simulated and experimental data. Together, these metrics validate the precision and reliability of the AI model.
Table 2Results of CFD analysis, experimental data, ai simulation, and comparison of differences between AI simulation and experimental data – summer 08:00 AM
Numerical simulation parameters | CFD simulation (°C) A | Experimental values (°C) B | AI numerical simulation (°C) C | B-A | B-A rate % | B-C | B-C rate % |
Atmospheric temperature-BG | 33.40 | 30.3 | 31 | –3.1 | 10.23 % | –1 | –3.30 % |
Atmospheric temperature-L | 28.40 | 27.5 | 27 | –0.9 | 3.27 % | –0.5 | –1.65 % |
Atmospheric temperature-H | 27.64 | 29.8 | 29 | 2.16 | –7.25 % | 0.8 | 2.64 % |
Grass temperature (°C) | 31.54 | 25.99 | 27 | –5.55 | 21.35 % | –1.01 | –3.33 % |
Concrete temperature (°C) | 27.52 | 24.85 | 28 | –2.67 | 10.74 % | –3.15 | –10.40 % |
PEstructure temperature (°C) | 57.65 | 49.48 | 60 | –8.17 | 16.51 % | –10.52 | –34.72 % |
Table 3Results of CFD analysis, experimental data, AI simulation, and comparison of differences between AI simulation and experimental data – summer 12:00 PM
Numerical simulation parameters | CFD simulation (°C) A | Experimental values (°C) B | AI numerical simulation (°C) C | B-A | B-A rate- % | B-C | B-C rate % |
Atmospheric temperature-BG | 31.30 | 32.8 | 31 | 1.5 | –4.57 % | 1.8 | 5.49 % |
Atmospheric temperature-L | 29.87 | 32.7 | 30 | 2.83 | –8.65 % | 2.7 | 8.26 % |
Atmospheric temperature-H | 37.52 | 33.3 | 34 | -4.22 | 12.67 % | –0.7 | 2.1 % |
Grass temperature (°C) | 31.22 | 33.10 | 33 | 1.88 | –5.68 % | 0.1 | 0.3 % |
Concrete temperature (°C) | 53.60 | 49.06 | 55 | –4.54 | 9.25 % | –5.94 | 12.1 % |
PEstructure temperature (°C) | 60.01 | 52.27 | 58 | –7.74 | 14.81 % | –5.73 | 10.96 % |
Table 4Results of CFD analysis, experimental data, AI simulation, and comparison of differences between AI simulation and experimental data - summer 16:00 PM
Numerical simulation parameters | CFD simulation (°C) A | Experimental values (°C) B | AI numerical simulation (°C) C | B-A | B-A rate % | B-C | B-C rate % |
Atmospheric temperature-BG | 38.65 | 32.7 | 33 | –5.95 | 18.20 % | –0.3 | 0.92% |
Atmospheric temperature-L | 37.55 | 32.4 | 34 | –5.15 | 15.90 % | –1.6 | 4.94% |
Atmospheric temperature-H | 41.93 | 33.6 | 35 | –8.33 | 24.79 % | –1.4 | 4.17% |
Grass temperature (°C) | 39.17 | 31.45 | 33 | –7.72 | 24.55 % | –1.55 | 4.93% |
Concrete temperature (°C) | 53.49 | 44.56 | 50 | –8.93 | 20.04 % | –5.44 | 12.2% |
PEstructure temperature (°C) | 47.66 | 37.73 | 40 | –9.93 | 26.32 % | –2.27 | 6.01 % |
Interpretation of results. The low RMSE and MAPE values highlight the minimal deviation of AI-simulated data from experimental measurements, underscoring the model’s high accuracy. Additionally, the Pearson Correlation Coefficient of 0.982 demonstrates a robust alignment in trends, affirming the consistency of the AI-simulated data with real-world observations. This comprehensive analysis reveals that the AI model effectively reproduces experimental conditions, with strong correlation and minimal error, thereby validating its credibility and performance.
Fig. 9Comparison of CFD analysis, experimental data, and ai simulation, including differences between AI simulation and experimental data, at various test points in the park – summer 08:00 AM
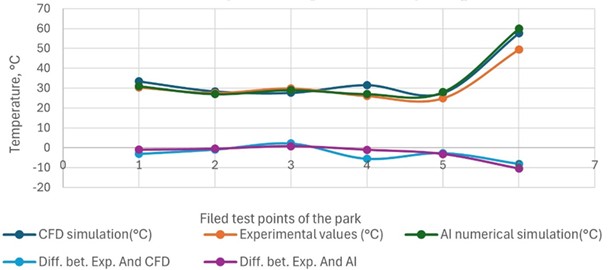
Fig. 10Comparison of CFD analysis, experimental data, and ai simulation, including differences between AI simulation and experimental data, at various test points in the park – summer 12:00 PM
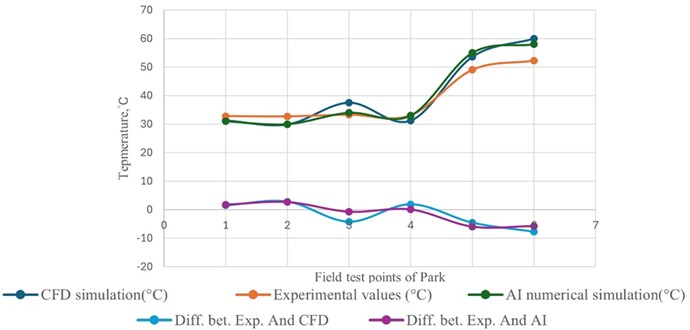
Fig. 11Comparison of CFD Analysis, experimental data, and ai simulation, including differences between AI simulation and experimental data, at various test points in the park – summer 16:00 PM
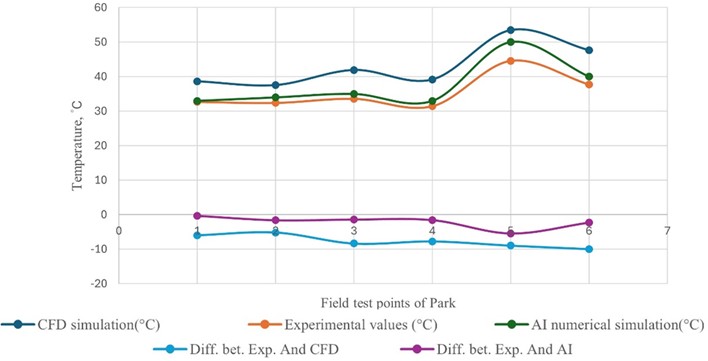
Table 5Analysis and comparison of experimental and ai-simulated values across different locations and time points
Time | Parameters | Test values (°C) | Simulation of AI (°C) | Absolute error (°C) | Absolute error (%) |
0800 | Atmospheric temperature-BG | 30.30 | 31 | –0.70 | 2.31 % |
0800 | Atmospheric temperature-L | 27.50 | 27 | 0.50 | 1.82 % |
0800 | Atmospheric temperature-H | 29.80 | 29 | 0.80 | 2.68 % |
0800 | Grass temperature | 25.99 | 27 | –1.01 | 3.89 % |
0800 | Concrete temperature | 24.85 | 28 | –3.15 | 12.68 % |
0800 | PE structure temperature | 49.48 | 60 | –10.52 | 21.26 % |
1200 | Atmospheric temperature-BG | 32.80 | 31 | 1.80 | 5.49 % |
1200 | Atmospheric temperature-L | 32.70 | 30 | 2.70 | 8.26 % |
1200 | Atmospheric temperature-H | 33.30 | 34 | –0.70 | 2.10 % |
1200 | Grass temperature | 33.10 | 33 | 0.10 | 0.30 % |
1200 | Concrete temperature | 49.06 | 55 | –5.94 | 12.11 % |
1200 | PE structure temperature | 52.27 | 58 | –5.73 | 10.96 % |
1600 | Atmospheric temperature-BG | 32.70 | 33 | –0.30 | 0.92 % |
1600 | Atmospheric temperature-L | 32.40 | 34 | –1.60 | 4.94 % |
1600 | Atmospheric temperature-H | 33.60 | 35 | –1.40 | 4.17 % |
1600 | Grass temperature | 31.45 | 33 | –1.55 | 4.93 % |
1600 | Concrete temperature | 44.56 | 50 | –5.44 | 12.21 % |
1600 | PE structure temperature | 37.73 | 40 | –2.27 | 6.02 % |
4. Discussion
The results of this study highlight the high accuracy of AI-simulated data in reproducing atmospheric temperature variations across different park zones during summer. With a low Root Mean Square Error (RMSE) of 3.68 °C, a Mean Absolute Percentage Error (MAPE) of 6.50 %, and a Pearson Correlation Coefficient of 0.982, the AI model demonstrates minimal deviation and strong consistency with experimental measurements.
Building on these findings, subsequent analyses were conducted to evaluate the effectiveness of proposed improvements in the park’s design. By integrating AI-driven simulations with CFD models, enhancements in shading structures, vegetation placement, and material selection were implemented. These adjustments resulted in significant reductions in surface temperatures and improved overall thermal comfort, as reflected in updated simulation outputs. This showcases the potential of AI models not only for accurate environmental assessments but also for guiding data-driven design optimizations, ultimately contributing to more sustainable and user-friendly urban green spaces.
A comparison of the data before and after design optimization clearly showed significant improvements in thermal radiation values, wind speed, and airflow. For example, thermal radiation values decreased by approximately 15 %, while wind speed increased by 1 m/s, directly enhancing pedestrian comfort in the park. Additionally, after the design optimization, the concentrations of PM2.5 and PM10 decreased by 12 % and 15 %, respectively, further improving air quality and enhancing users’ health and safety, as shown in Fig. 12(a).
This study utilized the Hong Kong Outdoor Thermal Comfort Index (HKOTCI) to assess thermal radiation, temperature, humidity, and wind speed in the park, aiming to improve outdoor pedestrian comfort, as shown in Fig. 12(b). Through a systematic evaluation of these key environmental factors, we were able to identify the main elements influencing pedestrian comfort and provide targeted improvement recommendations. Specific improvement data indicated that the comfort index increased by 15 % after optimization, while the average thermal radiation value decreased by 25 %. Moreover, as the vegetation coverage increased, the air quality index (AQI) improved by 10 %. Furthermore, this optimized design fostered social interaction, leading to a 20 % increase in user numbers.
Fig. 12Park airborne particulates and outdoor pedestrian comfort improvement results
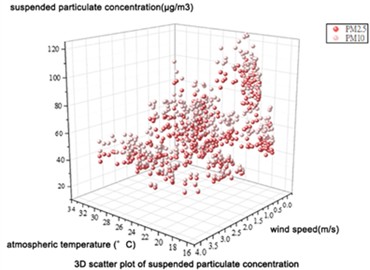
a) Comparison before improvement of airborne particulates
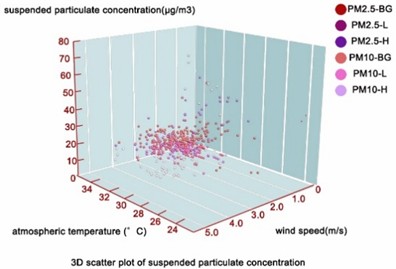
b) Comparison after improvement of airborne particulates
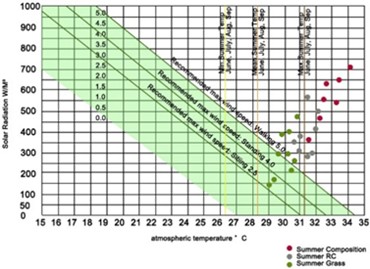
c) Comparison before improvement of outdoor pedestrian comfort in the park
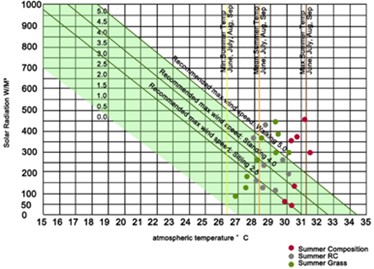
d) Comparison after improvement of outdoor pedestrian comfort in the park
However, when simulating the effects of climate change over the next three years, the analysis predicted that the improvements in outdoor comfort and air quality would remain relatively stable, with no significant changes. The minimal variation suggests that the optimized design’s benefits are resilient to short-term climatic shifts, ensuring sustained comfort and air quality improvements in the near future. These findings highlight the robustness of the design strategies but also indicate the need for continuous monitoring and further adaptive measures in the long term to address potential future climatic impacts.
Overall, the integration of Midjourney AI, along with experimental data and predictive simulations generated by ChatGPT, not only improved the design efficiency of the park but also offered valuable data-driven insights and references for future design enhancements.
5. Conclusions
This study underscores the transformative potential of AI-driven simulation methods in enhancing outdoor thermal comfort and air quality within urban parks. By employing a highly accurate AI model (RMSE: 3.68 °C, MAPE: 6.50 %, Pearson Correlation Coefficient: 0.982), critical environmental parameters-including temperature, wind speed, and radiation-were assessed with remarkable precision. These insights served as the foundation for data-driven design optimizations that significantly elevated both environmental quality and user experience.
The integration of AI with Computational Fluid Dynamics (CFD) modeling facilitated targeted interventions, such as the strategic placement of shading structures, optimized vegetation distribution, and the selection of advanced materials. These enhancements resulted in a 15 % reduction in thermal radiation, a 1 m/s increase in wind speed, and notable decreases in PM2.5 and PM10 concentrations by 12 % and 15 %, respectively. The post-optimization analysis further highlighted a 25 % reduction in thermal radiation, a 10 % improvement in the Air Quality Index (AQI), and a 15 % rise in the comfort index. Collectively, these improvements not only promoted physical well-being but also increased park usage by 20 %, fostering social interactions and enriching the communal value of these urban spaces.
Resilience testing under projected short-term climate scenarios demonstrated that the optimized designs maintained stable improvements in comfort and air quality for at least three years. This robustness underscores the reliability of the proposed strategies while emphasizing the importance of continuous monitoring and adaptive measures for achieving long-term sustainability.
Furthermore, the adoption of advanced AI technologies-such as ChatGPT for predictive analysis and Midjourney AI for design refinement-streamlined the development process and generated actionable insights for environmental and social enhancements. This interdisciplinary approach has proven invaluable in addressing modern urban challenges, offering a blueprint for creating sustainable, user-centric green spaces.
The findings of this study also shed light on the limitations of traditional landscape design, which often relies on heuristic methods and lacks thorough post-construction evaluations. Such approaches frequently result in discrepancies between anticipated and actual outcomes. While previous research addressed these gaps through CFD simulations and experimental validations, the iterative nature of these methods demanded extensive time and resources.
In contrast, this study integrates field experiment data with AI-driven methodologies to identify optimal solutions swiftly and cost-effectively. By combining these results with traditional CFD validation, the research achieves a balance of precision and efficiency. This innovative framework not only saves time and reduces trial-and-error costs but also introduces fresh perspectives for practical applications and future studies.
Ultimately, this research highlights the critical role of AI in modern urban design, bridging environmental assessments with innovative solutions that align with evolving community needs and sustainability goals. It serves as a testament to the value of interdisciplinary strategies in shaping resilient, inclusive, and vibrant urban spaces for the future.
s
References
-
A. Aflaki et al., “Urban heat island mitigation strategies: A state-of-the-art review on Kuala Lumpur, Singapore and Hong Kong,” Cities, Vol. 62, pp. 131–145, Feb. 2017, https://doi.org/10.1016/j.cities.2016.09.003
-
F. Marando et al., “Urban heat island mitigation by green infrastructure in European functional urban areas,” Sustainable Cities and Society, Vol. 77, p. 103564, Feb. 2022, https://doi.org/10.1016/j.scs.2021.103564
-
A. M. M. Irfeey, H.-W. Chau, M. M. F. Sumaiya, C. Y. Wai, N. Muttil, and E. Jamei, “Sustainable mitigation strategies for urban heat island effects in urban areas,” Sustainability, Vol. 15, No. 14, p. 10767, Jul. 2023, https://doi.org/10.3390/su151410767
-
M.-C. Liao, W.-P. Sung, and Q.-Q. Chen Shi, “Comparing small water bodies’ impact on subtropical campus outdoor temperature: measured vs. simulated data,” Buildings, Vol. 14, No. 5, p. 1288, May 2024, https://doi.org/10.3390/buildings14051288
-
W.-P. Sung, M.-H. Shih, T.-Y. Chen, and C.-H. Liu, “Influence of landscape elements in the park on thermal environment – using a metropolitan park in Taichung city as an example,” Journal of Measurements in Engineering, Vol. 11, No. 3, pp. 278–302, Sep. 2023, https://doi.org/10.21595/jme.2023.23248
-
M.C. Liao, W.P. Sung, and Y. Li, “Investigating rainwater harvesting system efficiency in Taiwan: A study on constructing precipitation variation indicators and assessing climate change impact,” Natural Resources Forum, Nov. 2024, https://doi.org/10.1111/1477-8947.12585
-
V. Gianfredi et al., “Association between urban greenspace and health: a systematic review of literature,” International Journal of Environmental Research and Public Health, Vol. 18, No. 10, p. 5137, May 2021, https://doi.org/10.3390/ijerph18105137
-
T. P. Pasanen et al., “Urban green space and mental health among people living alone: The mediating roles of relational and collective restoration in an 18-country sample,” Environmental Research, Vol. 232, p. 116324, Sep. 2023, https://doi.org/10.1016/j.envres.2023.116324
-
P.-Y. Nguyen, T. Astell-Burt, H. Rahimi-Ardabili, and X. Feng, “Green space quality and health: a systematic review,” International Journal of Environmental Research and Public Health, Vol. 18, No. 21, p. 11028, Oct. 2021, https://doi.org/10.3390/ijerph182111028
-
Z. Xian et al., “The effects of neighbourhood green spaces on mental health of disadvantaged groups: a systematic review,” Humanities and Social Sciences Communications, Vol. 11, No. 1, Apr. 2024, https://doi.org/10.1057/s41599-024-02970-1
-
J. Barton and M. Rogerson, “The importance of greenspace for mental health,” BJPsych. International, Vol. 14, No. 4, pp. 79–81, Jan. 2018, https://doi.org/10.1192/s2056474000002051
-
R. Javadi and N. Nasrollahi, “Urban green space and health: The role of thermal comfort on the health benefits from the urban green space; a review study,” Building and Environment, Vol. 202, p. 108039, Sep. 2021, https://doi.org/10.1016/j.buildenv.2021.108039
-
V. L. Lygum et al., “Greenspace as workplace: benefits, challenges and essentialities in the physical environment,” International Journal of Environmental Research and Public Health, Vol. 20, No. 17, p. 6689, Aug. 2023, https://doi.org/10.3390/ijerph20176689
-
P. Shan and W. Sun, “Research on 3D urban landscape design and evaluation based on geographic information system,” Environmental Earth Sciences, Vol. 80, No. 17, Aug. 2021, https://doi.org/10.1007/s12665-021-09886-y
-
R. Chen et al., “Enhancing urban landscape design: A GAN-based approach for rapid color rendering of park sketches,” Land, Vol. 13, No. 2, p. 254, Feb. 2024, https://doi.org/10.3390/land13020254
-
L. Song, “The street space planning and design of artificial intelligence-assisted deep learning neural network in the Internet of Things,” Heliyon, Vol. 10, No. 15, p. e35031, Aug. 2024, https://doi.org/10.1016/j.heliyon.2024.e35031
-
L. Wang, C. Mayusoh, and A. Inkuer, “Sustainable landscape design and traditional villages in Xuzhou, Jiangsu: low-cost strategies and big data applications influencing AI integration,” Journal of Information Systems Engineering and Management, Vol. 9, No. 2, p. 23945, Apr. 2024, https://doi.org/10.55267/iadt.07.14748
-
W. He and M. Chen, “Advancing urban life: a systematic review of emerging technologies and artificial intelligence in urban design and planning,” Buildings, Vol. 14, No. 3, p. 835, Mar. 2024, https://doi.org/10.3390/buildings14030835
-
W. Jaung, “The need for human-centered design for AI robots in urban parks and forests,” Urban Forestry and Urban Greening, Vol. 91, p. 128186, Jan. 2024, https://doi.org/10.1016/j.ufug.2023.128186
-
J. Siqi, W. Yuhong, and W. Nyuk Hien, “The effect of urban greening on pedestrian’s thermal comfort and walking behaviour,” in E3S Web of Conferences, Vol. 396, p. 05013, Jun. 2023, https://doi.org/10.1051/e3sconf/202339605013
-
L. Pompei, F. Nardecchia, L. Gugliermetti, and F. Cinquepalmi, “Design of three outdoor combined thermal comfort prediction models based on urban and environmental parameters,” Energy and Buildings, Vol. 306, p. 113946, Mar. 2024, https://doi.org/10.1016/j.enbuild.2024.113946
-
Z. Liu, J. Li, and T. Xi, “A review of thermal comfort evaluation and improvement in urban outdoor spaces,” Buildings, Vol. 13, No. 12, p. 3050, Dec. 2023, https://doi.org/10.3390/buildings13123050
-
T. E. Morakinyo, S. B. Ogungbenro, A. T. Abolude, and A. A. Akinsanola, “Quantifying the effect of rain events on outdoor thermal comfort in a high-density city, Hong Kong,” International Journal of Biometeorology, Vol. 63, No. 1, pp. 19–27, Oct. 2018, https://doi.org/10.1007/s00484-018-1634-z
-
N. Nazarian, J. Fan, T. Sin, L. Norford, and J. Kleissl, “Predicting outdoor thermal comfort in urban environments: A 3D numerical model for standard effective temperature,” Urban Climate, Vol. 20, pp. 251–267, Jun. 2017, https://doi.org/10.1016/j.uclim.2017.04.011
-
E. Ng and V. Cheng, “Urban human thermal comfort in hot and humid Hong Kong,” Energy and Buildings, Vol. 55, pp. 51–65, Dec. 2012, https://doi.org/10.1016/j.enbuild.2011.09.025
-
F. Aram, E. Solgi, E. H. Garcia, and A. Mosavi, “Urban heat resilience at the time of global warming: evaluating the impact of the urban parks on outdoor thermal comfort,” Environmental Sciences Europe, Vol. 32, No. 1, Sep. 2020, https://doi.org/10.1186/s12302-020-00393-8
-
B. Cheng, R. Cheng, and X. Tang, “Research on thermal comfort of outdoor space in summer urban park: take Mianyang Urban park as an example,” Journal of Building Construction and Planning Research, Vol. 8, No. 3, pp. 161–179, Jan. 2020, https://doi.org/10.4236/jbcpr.2020.83010
-
K. Boussaidi, D. Djaghrouri, M. Benabbas, and H. Altan, “Assessment of outdoor thermal comfort in urban public space, during the hottest period in Annaba City, Algeria,” Sustainability, Vol. 15, No. 15, p. 11763, Jul. 2023, https://doi.org/10.3390/su151511763
About this article
This research was funded by the Ministry of Science and Technology, Taiwan, grant number No. MOST-110-2410-H-167-002-MY2.
The datasets generated during and/or analyzed during the current study are available from the corresponding author on reasonable request.
Tian Yow Chen: resources, conceptualization, supervision, reviewing and editing. Chien Shiun Huang: formal analysis, investigation, data curation, visualization, methodology, original draft preparation. Wen Pei Sung: data curation, visualization, conceptualization, methodology, project administration, funding acquisition, reviewing and editing.
The authors declare that they have no conflict of interest.
