Abstract
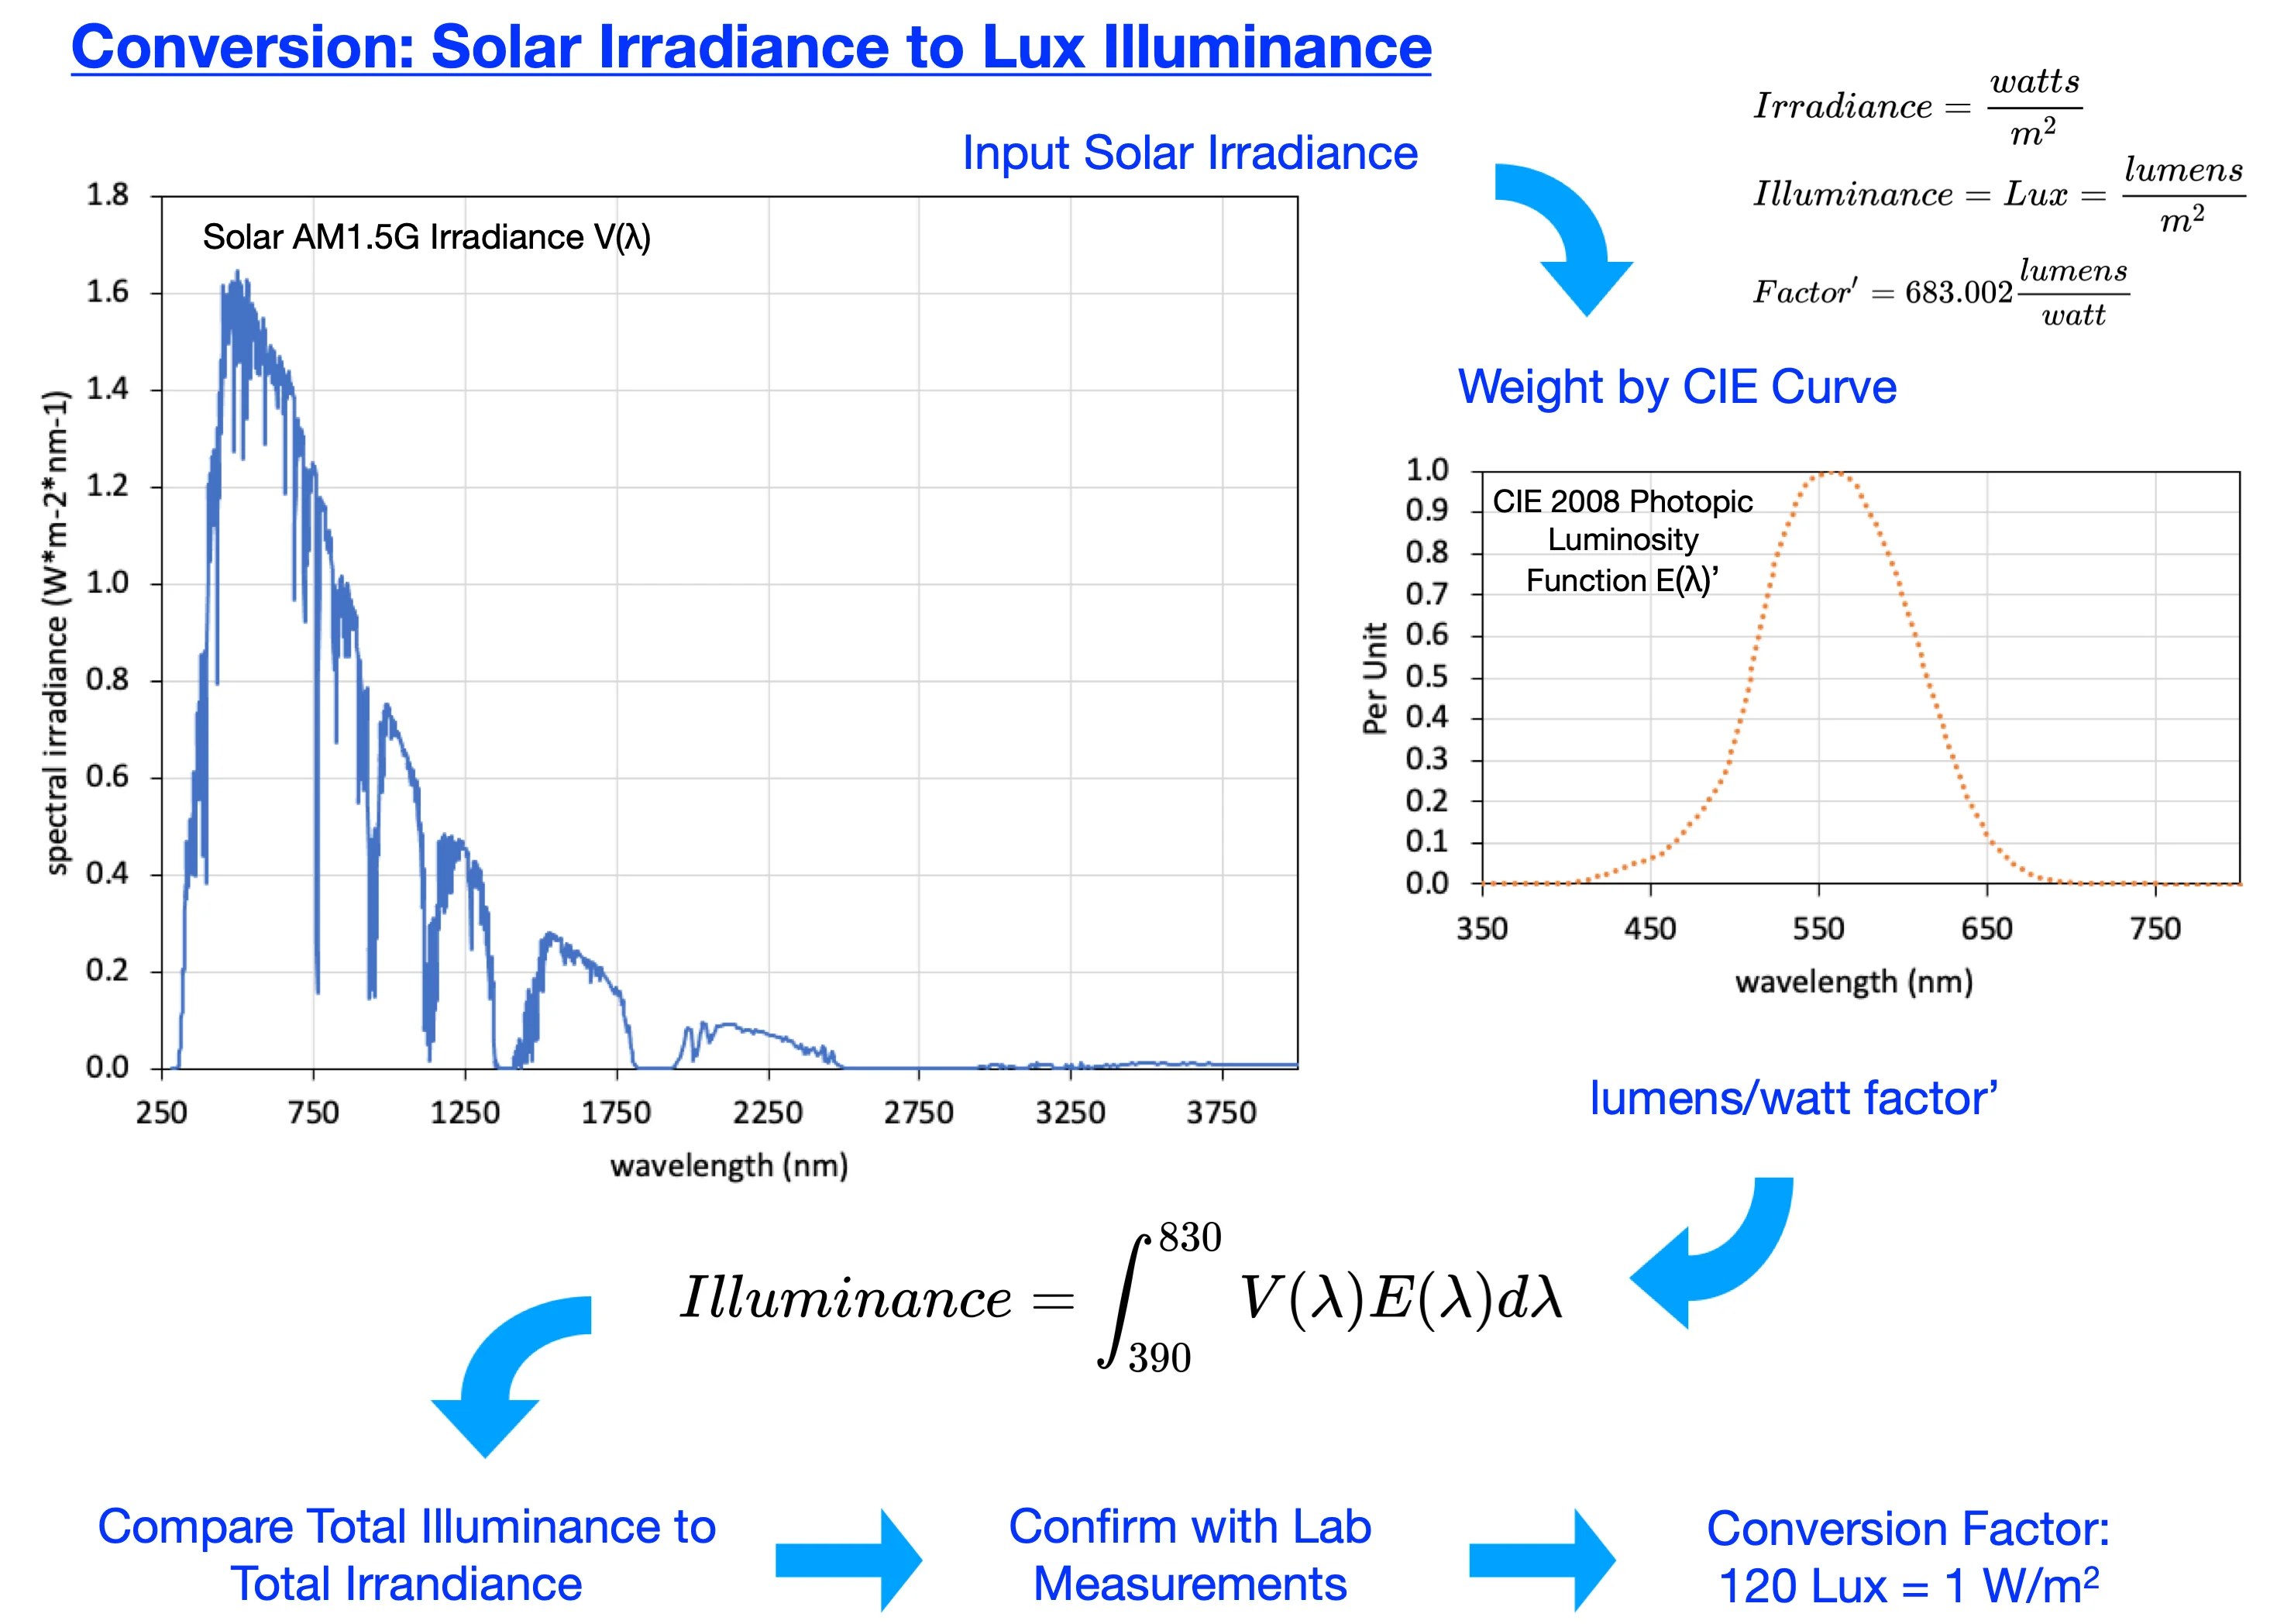
The standard for measuring solar irradiance utilizes the units of watts per meter squared (W/m2). Irradiance meters are both costly and limited in the ability to measure low irradiance values. With a lower cost and higher sensitivity in low light conditions, light meters measure luminous flux per unit area (illuminance) utilizing the units of lumens per meter squared or lux (lx). An effective conversion factor between W/m2 and lx would enable the use of light meters to evaluate photovoltaic performance under low solar irradiance conditions. A survey of the literature found no definitive and readily available “rule of thumb” conversion standard between solar irradiance and illuminance. Easy-to-find Internet sources contain conflicting and widely varying values ranging from 688449 to 21000 lx for 1000 W/m2 (1 Sun) of solar irradiance. Peer-reviewed literature contains Luminous Efficacy equivalent values ranging from 21 to 131 lx per W/m2. This manuscript explores the relationship and establishes a theoretical and laboratory measurement guide for the conversion between solar irradiance and illuminance. The conversion factor includes standards data, equipment calibration accuracy, and uncertainty estimates. Solar Irradiance of 1 Sun (1000 W/m2) for an LED-based solar simulator is (116 ± 3) klx and (122 ± 1) klx for outdoor sunlight.
Highlights
- Solar Irradiance to Illuminance Conversion
- Solar Low Light Measurement
- PV Low Light Evaluation
- Solar Luminous Efficacy
1. Introduction
Harvesting of electrical energy using photovoltaic (PV) systems is an essential part of renewable energy development. A key issue in PV system operation is the ability to measure performance effectively. Of concern is how to effectively measure the performance of PV solar cells and modules under low solar light conditions. A simple and cost-effective method to measure low solar irradiance would support this research. Solar irradiance is measured in watts per meter2 (W/m2) [1] and light illuminance in the unit of lux (lx) [2]. Typical handheld irradiance meters have low-level measurement limitations. The Seaward 100/200B is limited to 100 W/m2, the HT HT304N to 50 W/m2, and the TES 1333 ≈ 50 W/m2. For solar simulation sources, the minimum low output is also limited. The Oriel KSH-7320 MiniSol solar simulator is 0.1 Sun, the Solar Light LS1000 is 0.15 Sun, and SpectroSun X-25B is 0.9 Sun. By convention, 1000 W/m2 is equal to 1.0 Sun. Light meters are suitable to measure values down to 1 lx – approximately four orders of magnitude smaller. With their low cost, light meters provide a straightforward and cost-effective method of evaluating PV system performance at low or weak sunlight intensities. This method offers a commercially and readily available alternative to a solar irradiance sensor proposed in [3].
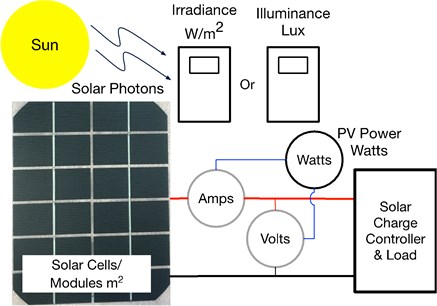
Both Solar Irradiance and Illuminance measure incident photon input but use the units of W/m2 and lx respectfully. This paper directly correlates sunlight solar irradiance in W/m2 to light illuminance in lx and enables the use of low-cost light meters measurement of PV system performance, particularly at low light levels. Examples of PV plant performance measurements are included [5], where the results of this manuscript enable the replacement of solar irradiance meters shown in figure 1 with light meters. The block diagram in Fig. 1 shows a typical application where solar PV system performance compares sunlight input to electrical power output. This diagram follows the standard measurement configuration found in numerous sources, such as Fig. 7 in [6].
Fig. 1Notional PV performance measurement: the energy conversion efficiency of the system compares solar input (left) with electrical power output (right)
2. Materials and methods
2.1. Irradiance measurement
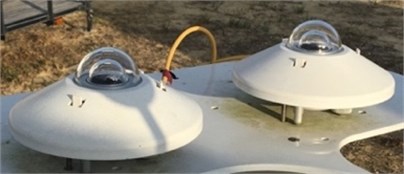
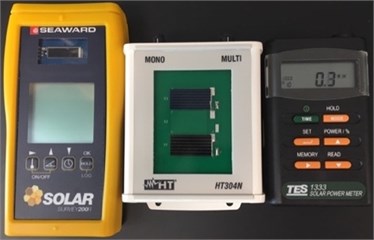
Irradiance measurement utilizes different technologies, including pyranometers (Fig. 2(a)) and various types of silicon-based sensors (Fig. 2(b)). Solar research typically utilizes pyranometers and portable handheld meters for PV field performance measurements. Irradiance meter calibrations use sources such as the World Radiometric Reference (WRR) [7] and methods such as National Renewable Energy Lab (NREL) Best Practices [8]. A typical handheld irradiance meter calibration is traceable to WRR and via transfer, matched to a standard class II pyranometer using airmass 1.5 global tilted solar data [9].
Numerous studies have investigated the spectral irradiance of the sun for the creation of a standard model of solar radiation [10] and [11]. The American Society for Testing of Materials (ASTM) sets the standard for solar irradiance based on the Air Mass (AM1.5) G173 Global Tilt data to be “1 Sun” corresponding to 1000 W/m2 [12]. Radiometer sensitivity calibration factors provide the conversion factor from solar irradiance input to irradiance output readings in W/m2.
Solar simulators such as the Oriel LSH-7320 MiniSol provides an artificial solar light source. These simulators utilize various light sources, such as LED, to match the solar spectrum utilizing calibration methods such as IEC 60904-9:2007 [13]. Solar simulators allow performance testing of solar cells under consistent laboratory conditions.
Fig. 2Solar irradiance measurement devices: a) pyranometers and b) silicon devices
a)
b)
2.2. Illuminance measurement
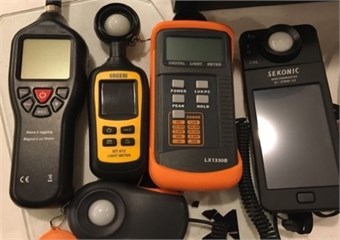
Utilizing the unit of lux, light meters provide a measurement of visible light illuminance. Light meters are calibrated to the Commission Internationale de I’Eclariage (CIE) photopic luminosity function [14]. The spectral response of these meters is referenced to the human eye [15]. Fig. 3 shows several examples of light meters. Light meters typically cost 1/4 to 1/10 of the price of irradiance meters and can have a dynamic range of over 100000 to 1. (Typical irradiance meters have dynamic ranges of only 10 to 1). The CIE photopic curve [16] provides a measurement calibrated to human perception.
Fig. 3Light illuminance measurement devices
2.3. Irradiance calculations
Solar irradiance measurement uses the unit of W/m2, with the power input provided by the photons sourced from the sun. ASTM AM1.5 G17 established a standard with data contained in the “astmg173.xls” spreadsheet available from the National Renewable Energy Lab [16]. These data can be used to generate the graph of solar spectral irradiance, which shows global horizontal irradiance with the non-uniformity caused by mostly atmospheric effects with some irregularities from the solar output (Fig. 4). The concept of spectral power distribution, as described by Preston [4], is utilized to determine power density.
Data for the X-abscissa is photon wavelength in units of nm (10-9 m) from 280 nm to 4000 nm. The Y-ordinate data is spectral irradiance in units of W/(m2 nm). The trapezoidal rule applied to this data provides the area power density and thus converts spectral irradiance to irradiance. Performing this calculation on the AM1.5 data produces the well-known solar irradiance of 1000.4 W/m2 [17]. With equipment and measurement limitations, the notional standard states 1000 W/m2.
Different sensor technologies have different sensitivity bandwidths. With limited bandwidth, the amount of energy is lower. For example, a typical thermopile sensor has a detection bandwidth of 285 nm to 2800 nm [18] and for a Silicon sensor from 350 nm to 1200 nm [19]. If AM1.5 photons are input to a Thermopile Pyranometer, photon wavelengths from 280 nm to 285 nm and from 2800 nm to 4000 nm are truncated and not measured. This photon truncation results in a loss of 7 W/m2.
Fig. 4ASTM AM1.5 global solar irradiance data
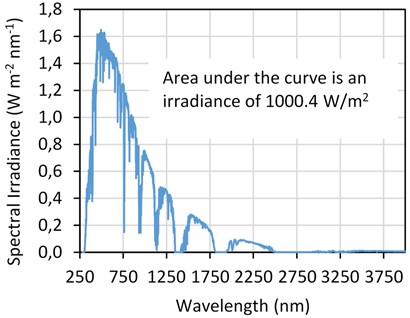
Table 1 shows the start and end wavelength of various sensor types: Thermopile, Silicon, ISO 9060 Pyranometer, CIE Photopic Luminosity visible light, and plant Photosynthetically Active Radiation light. With these limiting bandwidths, the total energy density is calculated by truncating the data from the AM1.5 spectrum for each sensor type. This method follows the straightforward background analysis performed by Preston [4].
This table contains no calibration nor other correction; actual sensors are calibrated to enable accurate, standardized measurement. Including both sensor bandwidth limitations and sensor response curves, irradiance meters display 1000 W/m2 for AM1.5 solar input.
Table 1Bandwidth limited AM1.5G irradiance
Data type | Start wavelength (nm) | End wavelength (nm) | Irradiance (W/m2) |
AM1.5 global tilt data | 280 | 4000 | 1000 |
Thermopile pyranometer | 285 | 2800 | 993 |
Silicon irradiance | 300 | 1200 | 836 |
ISO 9060 pyranometer | 350 | 1100 | 791 |
Visible light wide | 380 | 780 | 535 |
Plant visible light | 400 | 700 | 432 |
2.4. Illuminance calculations
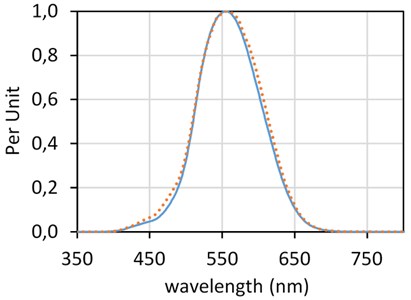
As summarized in reference [20], the bandwidth of light that humans can see include a wide range of 380 nm to 780 nm to a narrow range of 400 nm to 700 nm. Light meters measure light perceived by humans and are calibrated to a CIE curve, with the Photopic Luminosity curves for 1924 (solid blue) and 2008 (dotted orange) shown in Fig. 5.
The CIE curves were initially created by the measurement of human subject perceptions of different wavelengths of visible light. Since the data include human response, it has proven to be problematic. For example, 1924 [21] data have values too low in the blue wavelength region and were corrected with a new CIE curve in 1988. The curve was again modified in 2008 [22]. Of note, by definition, there is no light outside the visible spectrum [2].
One lux is one lumen per square meter, with a lumen (lm) defined as one Candela (cd) times one Steradian (sr). A Steradian is a unit of solid angle, whereas a Candela is a base International System of Units (SI) unit for luminous intensity. The Candela is defined as monochromatic radiation at a frequency of 540×1012 Hz with a radiant intensity of 1/683 watts per Steradian [23]. This value is close to the illumination of one candle, an old standard of light output [4]. The frequency of 540×1012 Hz, with a vacuum speed of light of 2.998×10⁸ meters per second, has a wavelength of about 555 nm. This wavelength is close to where humans see best [24]. A full sphere has a total of 4 steradians. One Candela projected over a full sphere is 1 cd×4 sr, which is about 12.57 lumens. Projecting this luminous intensity on the area of 1 square meter area would produce about 12.57 lx.
Fig. 5CIE photopic luminosity curves: solid blue 1924, dotted orange 2008
2.5. Need for a standard
Currently, there is no simple, easily obtainable conversion standard between solar irradiance and light illuminance. The primary purpose of this paper is to enable a reliable and scientifically supported conversion number. This conversion would then provide an easily found number that would be similar to an Internet request for conversion from meters to feet or acres to hectares.
An extensive search for a conversion value was conducted with many conflicting and widely varying values found. Table 2 shows values for 1 Sun (1000 W/m2) and a stated conversion of lx per W/m2 from open Internet Sources.
Table 2Illuminance equivalent for 1 sun: internet sources
Stated conversion value (Lux @ 1 Sun) | Calculated conversion (lx per W/m2) | Source |
668449 | 668 | [29] Online conversion |
683000 | 683 | [30] Speedy converter |
249000 | 249 | [31] EGC |
126234 | 126 | [32] Smith |
120000 - 111000 | 120-111 | [33] Wikipedia daylight |
107527 | 107 | [34] Fiber optic tech |
100000 – 32000 | 100-32 | [35] Wikipedia lux |
71429 | 71 | [36] Futura |
No peer-reviewed journal was found with a specific conversion of solar irradiance (W/m2) to light illuminance (lx). Table 3 contains values from peered reviewed journals summarized by Littlefair [25] and used Luminous Efficacy (lumens per watt) as the standard. Unit conversion enables the direct correlation of luminous efficacy, as summarized by Littlefair, to the desired unit of lux per watt per square meter and thus allows the use of this data in the comparisons. All of these peered reviewed papers utilized natural solar light and predated current standard solar irradiance levels. The Littlefield summarization paper is dated 1985, and the Direct and Global 37-degree Tilt: ASTM G-173 is dated 2002 and ISO 9845-1 from 1992 [26]. Other research into luminous efficacy does not include the unit of lux nor conversion standards such as Li in [27] or include complex and challenging-to-use models not applicable to a straightforward conversion [28].
Table 3Luminous efficacy: peered reviewed journals summarized by [25]
Stated luminous efficacy (lumen/watt) | Source |
52-97 | [37] Dogniaux |
94-103 | [38] Kuhn |
59-93 | [39] Evnevich & Nikol’skaya |
109.2 ± 10.4 | [40] Liebelt |
62-122 | [41] Shukuya and Kimura |
103 | [42] Peterson |
21-116 | [43] Navvab et all |
58-109 | [44] McCluney |
103 ± 28 | [45] Gillette and Treado |
3. Theory and calculations
This section contains three methods to establish a conversion factor. Subsection 3.1 utilizes published data and mathematical analysis. Subsection 3.2 uses solar simulator measurements, and Subsection 3.3 utilizes outdoor solar light measurement.
3.1. Data calculations
Data are available at many specific photon wavelengths. For example, the AM1.5 ASTM G173 data is provided every 0.5 nm from 280 nm to 400 nm, every 1 nm from 400 nm to 1700 nm, 1702 nm, and then every 5 nm from 1705 nm to 4000 nm. The CIE 1924 data are provided in intervals of 1 nm from 360 nm to 830 nm, 1998 data from 380 nm to 780 nm every 1 nm, and 2008 data are available at every 0.1 nm from 390 nm to 830 nm [21].
For calculations in this paper, the ASTM AM1.5 G173 data for solar irradiance were adopted as the base. Other data were either linearly interpolated to produce the missing data or truncated to match the specific wavelengths provided in G173. A binary truncation was used to calculate the power density numbers used in Table 1 above, while weighted data were used below.
A spreadsheet was created using data for CIE photopic luminosity curves from 1924, 1988, and 2008. These weighted curves generated power density numbers for each data set. For example, each of the CIE curves has a weighting factor of 1.0 at 555 nm, smaller values for both longer and shorter wavelengths, and zero for wavelengths out of range of each curve. Data contained in Table 4 were calculated utilizing a method described by Preston [4]. The table shows the limiting wavelength and the results of weighting on calculated power density. As can be observed, the CIE curve considerably limits the power density of AM1.5 solar irradiance.
Table 4Irradiance for CIE weighted data
Data source | Start (nm) | End (nm) | Calculated power density (W/m2) |
CIE 1924 | 360 | 830 | 160 |
CIE 1988 | 380 | 780 | 161 |
CIE 2008 | 390 | 830 | 169 |
3.2. Indoor measurement
A Sekonic C-700 light meter was placed in the illuminance beam of a Newport Oriel MiniSol LSH-7320 solar simulator (MiniSol). This entire measurement system is placed in a light-tight enclosure to prevent external light from impacting the measurements. Adjusting the MiniSol power setting provides various sun output levels, and the irradiance readings from the MiniSol and illuminance values from the Sekonic light meter were recorded. Before each measurement session, the Sekonic dark light calibration procedure was run. Both devices have factory calibration – IEC ABA for the MiniSol and CIE 2008, as reflected in the JIS C 1609-1:2006 Japanese Standard [46] for the Sekonic.
The MiniSol source is limited to a low value of 0.1 Sun (100 W/m2) output, so neutral density (ND) filters are utilized to enable the measurement of lower values of solar irradiance. ND filters are rated by number where, ND2 = 50 %, ND4 = 25 %, ND8 = 12.5 %, and ND16 = 6.25 % light transmission.
The ND filters are inserted between the MiniSol source and the Sekonic light meter to obtain data for values of under 0.1 Sun. A custom 3D-printed filter stand holds the filters in place to produce consistent results. Fig. 6 shows the MiniSol, ND filter, filter stand, and Sekonic meter.
Fig. 6MiniSol solar simulator, ND filter, stand. and light meter
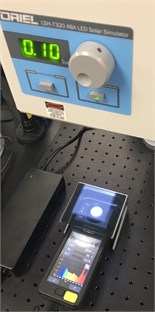
Fig. 7Solar irradiance and illuminance data collection setup
3.3. Outdoor measurement
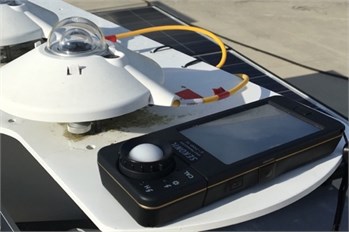
Outdoor measurements consisted of placing the dark calibrated Sekonic meter parallel and adjacent to the Kipp & Zonen CMP11 Thermopile Pyranometer. This test was performed in May 2019 in Fort Myers, Florida, USA. A laptop computer with a WiFi connection to the instrumentation system collected irradiance data while coincident illuminance values were recorded. Fig. 7 shows the notional set up for the collection of solar irradiances and illuminance readings with the Sekonic light meter next to the Pyranometer.
4. Results and discussion
4.1. Calculated value
Using the three CIE data sets, a conversion from power density to lux was performed for each wavelength of the ASTM G173 data. With 683 lumens per watt assigned to 555 nm, the appropriate weighting values for each CIE curve (1924, 1988, and 2008) along with the photon energy by wavelength were applied. This analysis is similar to that performed by Pons [45] and others. With this weighting, the trapezoidal rule was applied over the appropriate spectrum to find the luminous fluxes. This efficacy is calculated via Eq. (1), which is an adaption of a calculation used in numerous sources, e.g., [47]. The Eq. (1) example is for CIE 1988 data, where is conversion constant, is solar irradiance AM1.5 data, and E(λ) is the CIE illuminance data:
Table 5 shows the results with 1 Sun equal to 1000 W/m2. Depending on the CIE curve, 1000 W/m2 is calculated to equals 109 klx to 116 klx.
Table 5Calculated illuminance to irradiance from CIE
Data source | Start (nm) | End (nm) | Illuminance of 1 sun (lx) | 1 W/m2 equivalent (lx) |
CIE 1924 | 360 | 830 | 109495 | 109 |
CIE 1988 | 380 | 780 | 110030 | 110 |
CIE 2008 | 390 | 830 | 115645 | 116 |
4.2. Indoor laboratory measurement
Data directly from MiniSol output to the Sekonic meter was collected with input solar illumination values adjusted by the MiniSol power dial. The MiniSol Solar simulator has different spectral characteristics compared to natural sunlight as, defined in the simulator calibration conforming to IEC 60904-9, which can be observed from the datasheet or via measurement of the Color Rendition Index (CRI). For example, the CRI for sunlight is 100, while the MiniSol is 87.5. Table 6 shows the test results of this direct illumination. The standard uncertainties stated as one standard deviation from a normal distribution of these measurements are not listed in Table 6 but included in Fig. 8.
Fig. 8Solar simulator: light meter illuminance versus solar simulator irradiance
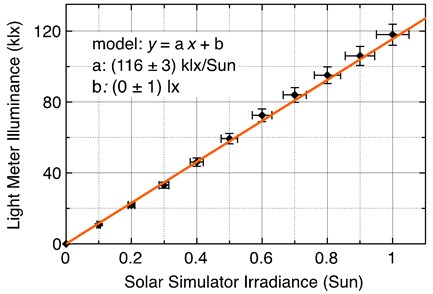
Table 6MiniSol solar simulator irradiance to Sekonic illuminance
Irradiance (Sun) | Irradiance (W/m2) | Illuminance (lx) | Calculated (lx/W/m2) |
0.0 | 0 | 0 | n/a |
0.1 | 100 | 10800 | 108 |
0.2 | 200 | 21800 | 109 |
0.3 | 300 | 33100 | 110 |
0.4 | 400 | 46100 | 115 |
0.5 | 500 | 59300 | 119 |
0.6 | 600 | 72500 | 121 |
0.7 | 700 | 84000 | 120 |
0.8 | 800 | 95100 | 119 |
0.9 | 900 | 106000 | 118 |
1.0 | 1000 | 118000 | 118 |
The uncertainty includes the variation of the intensity and spectral characteristic of the MiniSol and the calibration accuracy of the Sekonic light meter. For these tests, both the MiniSol and Sekonic were within factory calibration time limits. The MiniSol has an ABA output accuracy and an offset of ±5 %. The Sekonic light meter has a JIS C1609 accuracy stated as ± 5 % + 1 digit for illuminance readings. Note that there is the possibility of a systematic offset despite the light meter producing a reading of zero lux with no light input. Therefore, we use both slope and constant (offset) terms as parameters to be determined using a linear regression analysis. These results, within tolerance, match the values calculated in Table 5 for CIE 2008 data, which is the calibration scale the Sekonic meter utilizes.
Testing of the ND filters showed the filters did not provide the indicated light transmission levels. The MiniSol, adjusted to various levels, was used to create a transmission scale for the ND filters. While the measured attenuation of the ND filters differed from their indicated values, fortunately, the filters displayed consistent attenuation versus light level, where for example, the ND2 filter provided 41 % transmission for MiniSol levels from 0.1 to 1 Sun. Table 7 shows the results of the specified versus actual transmission level and the uncertainty. The analysis included the filter transmission attenuation and uncertainty.
Table 7ND filter calibration
Filter type | ND2 (%) | ND4 (%) | ND8 (%) | ND16 (%) |
Specified transmission | 50 | 25 | 12.5 | 6.25 |
Actual transmission | 41 ± 1 | 23.0 ± 0.5 | 8.8 ± 0.2 | 0.28 ± 0.01 |
Data were collected to populate the conversion chart shown in Table 8. Lower illumination values were added to the data from Table 6, where, for example, the 0.1 Sun adjustment setting on the MiniSol simulator with an ND2 filter provided 0.041 Sun or 41 W/m2. These measurements utilized W/m2, with the results are shown in Fig. 9. Data analysis by linear regression, included the error of the ND filter transmission, is used to determine the conversion formula and the uncertainty. Of interest is, even with the addition of the error from the ND filters, the overall standard deviation is lower because of the addition of more, and less varying, data points.
Fig. 9Full range solar simulator: light meter illuminance versus solar simulator irradiance
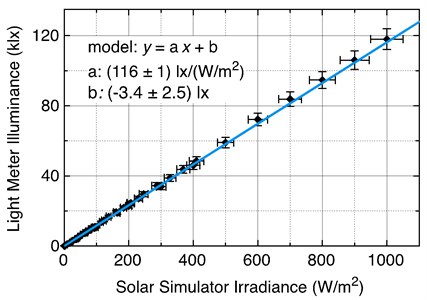
Table 8Full range simulation irradiance (W/m2) and coincidence illuminance (lx) using ND filters
(W/m2) | (lx) | (W/m2) | (lx) | (W/m2) | (lx) | (W/m2) | (lx) |
0.0 | 0.0 | 23.0 | 2430 | 92.2 | 10600 | 287 | 34400 |
0.3 | 29 | 26.4 | 2910 | 100 | 10800 | 300 | 33900 |
0.6 | 59 | 35.2 | 4060 | 115 | 13700 | 328 | 38800 |
0.8 | 93 | 41.0 | 4340 | 123 | 14600 | 369 | 43700 |
1.1 | 130 | 44.0 | 5220 | 138 | 16700 | 400 | 46000 |
1.4 | 167 | 46.0 | 4850 | 161 | 19300 | 410 | 48500 |
1.7 | 203 | 52.8 | 6360 | 164 | 18900 | 500 | 59000 |
2.0 | 234 | 61.6 | 7380 | 184 | 21800 | 600 | 72200 |
2.2 | 264 | 69.0 | 7650 | 200 | 22800 | 700 | 83800 |
2.5 | 296 | 70.4 | 8340 | 205 | 24300 | 800 | 94700 |
2.8 | 326 | 79.2 | 9390 | 207 | 24500 | 900 | 106000 |
8.8 | 920 | 82.0 | 9660 | 230 | 27100 | 1000 | 118000 |
17.6 | 1850 | 88.0 | 10400 | 246 | 29600 |
4.3. Outdoor measurement
Outdoor natural sunlight testing was performed using a Sofie Data Collection system Kipp & Zonen CMP11 Thermopile Pyranometer and a Sekonic light meter. Table 9 presents the coincident natural solar irradiance and illuminance values collected and tabulated. Using the measurement uncertainty of the Sekonic (5 % + 1 digit) and the Zipp & Zonen (fixed offset 2 W/m2 + 3.2 % of the measurement), linear regression is used to determine the slope and standard deviation of the slope of the formula and graph in Fig. 10. Unlike the indoor data, the intercept is not zero because of the Kipp & Zonen non-zero offset.
4.4. Data summary
Table 10 presents the results of calculated, laboratory solar simulation, natural solar light, and their respective standard uncertainties. Systematic offsets determined by the constant linear model term were at most with 87 ± 50 lx the largest offset found outdoors and –3.4 ± 2.5 lx indoors. These offsets constitute less than 1 % of the measured light level above 1000 lx outdoors and 300 lx indoors and are approximately 1.7 and 1.4 standard deviations from zero, respectively. The indoor laboratory results possibly differ from the outdoor solar measurement because of a difference in the spectra of the incident light. The solar simulator LED source, although class ABA, is not a perfect match to natural solar light. A change in the spectral power distribution effects the conversion results. This difference is also shown in the results of the calculated lx in the different CIE curves shown in Table 4.
Table 9Natural light irradiance (W/m2) and coincidence illuminance (lx)
(W/m2) | (lx) | (W/m2) | (lx) | (W/m2) | (lx) | (W/m2) | (lx) | (W/m2) | (lx) | (W/m2) | (lx) |
0.3 | 36 | 47.7 | 6190 | 169.4 | 21000 | 246 | 31900 | 394.1 | 46900 | 554.2 | 66400 |
1.1 | 117 | 49.2 | 6270 | 173.4 | 22000 | 250.6 | 32600 | 409.9 | 48900 | 563.2 | 67500 |
1.8 | 257 | 50.7 | 6470 | 173.9 | 21200 | 256.6 | 33100 | 414.4 | 49300 | 564.7 | 67700 |
2.6 | 300 | 63.4 | 8210 | 175.4 | 23000 | 261 | 29900 | 417.5 | 49700 | 570.8 | 68100 |
2.6 | 331 | 67.2 | 8390 | 179.9 | 24100 | 269.4 | 32800 | 420.5 | 50100 | 576.8 | 68800 |
3.3 | 442 | 80.7 | 10100 | 182.9 | 22600 | 273.9 | 33600 | 424.9 | 50500 | 584.0 | 69800 |
4.1 | 498 | 83.7 | 10500 | 184.4 | 24000 | 280 | 34300 | 430.2 | 51200 | 588.3 | 70100 |
4.1 | 541 | 85.2 | 10600 | 185.6 | 25900 | 284.4 | 34900 | 435.5 | 51,800 | 593.3 | 71000 |
4.8 | 644 | 86.7 | 10800 | 187.5 | 23300 | 289.7 | 35400 | 440 | 52100 | 597.8 | 71800 |
5.6 | 687 | 89.7 | 11,100 | 190.5 | 24200 | 296.5 | 36300 | 444.5 | 52800 | 600.8 | 71900 |
6.3 | 826 | 96.5 | 11500 | 190.5 | 23700 | 300.2 | 36800 | 449 | 53300 | 615.8 | 73800 |
7.1 | 892 | 97.3 | 11600 | 196 | 24400 | 307.2 | 37700 | 453.5 | 53900 | 620.4 | 74300 |
7.8 | 988 | 98.7 | 11800 | 196.5 | 25100 | 312.2 | 38200 | 458 | 54600 | 629.4 | 75200 |
8.6 | 1060 | 101.8 | 12100 | 199.5 | 24600 | 318.2 | 38700 | 468 | 55700 | 635.4 | 75800 |
10.1 | 1260 | 106.3 | 12700 | 200.2 | 26200 | 322.7 | 39500 | 470.8 | 56600 | 641.4 | 76600 |
11.6 | 1460 | 107.8 | 12800 | 200.9 | 26800 | 328.8 | 40000 | 473.1 | 56700 | 648.9 | 77400 |
13.1 | 1,680 | 110.8 | 13000 | 205.5 | 26500 | 331.8 | 40400 | 473.1 | 56900 | 654.2 | 78000 |
14.6 | 1,800 | 121.3 | 16000 | 208.5 | 25700 | 337.8 | 41900 | 480.6 | 57300 | 665.0 | 79300 |
16.1 | 2,010 | 124.3 | 16300 | 210 | 26700 | 342.3 | 41900 | 482 | 57600 | 671.4 | 79900 |
17.6 | 2,230 | 127.1 | 16200 | 213.1 | 26200 | 345.3 | 41900 | 488.1 | 57800 | 673.0 | 80200 |
19.0 | 2,280 | 132.6 | 16700 | 214.5 | 27300 | 349.8 | 42200 | 491.1 | 58200 | 684.2 | 81700 |
20.6 | 2,480 | 136.3 | 17100 | 216.1 | 27100 | 353.6 | 42900 | 502.4 | 59800 | 688.0 | 81700 |
22.9 | 2,880 | 142.4 | 17700 | 220.5 | 27400 | 360.3 | 43900 | 511.4 | 60700 | 692.4 | 82200 |
19.1 | 2,410 | 144.8 | 18100 | 225 | 29500 | 363.3 | 43900 | 516.7 | 61700 | 703.0 | 83900 |
26.6 | 3,270 | 151.3 | 18700 | 225 | 27800 | 367.8 | 44400 | 519.7 | 61300 | 742.0 | 87800 |
28.1 | 3,650 | 151.4 | 18800 | 229.5 | 30500 | 370.8 | 45400 | 524.2 | 61900 | 767.6 | 91400 |
31.2 | 4,270 | 166.4 | 20600 | 234.8 | 28500 | 373.1 | 45600 | 528.9 | 62900 | 785.5 | 93000 |
35.6 | 4,750 | 169.4 | 20800 | 236.3 | 30100 | 384.4 | 45900 | 533.2 | 63300 | 787.1 | 93400 |
43.1 | 5,500 | 169.4 | 21000 | 240.1 | 31000 | 390.4 | 46300 | 539.2 | 63700 | 801.1 | 94600 |
Fig. 10Light meter illuminance versus pyranometer solar irradiance
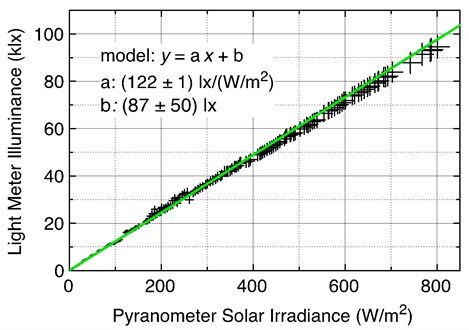
Table 10Conversion results
Source | Results |
CIE 2008 data calculation | 1 W/m2 = 116 lx |
Indoor laboratory simulation | 1 W/m2 = 116 ± 3 lx |
Outdoor solar measurement | 1 W/m2 = 122 ± 1 lx |
5. Conclusions
ASTM AM1.5 G173 solar irradiance data along with CIE photopic luminosity function were analyzed and compared to solar simulations, actual solar irradiance, and illumination measurements. This analysis provided data for the establishment of a W/m2 to lx conversion standard for solar irradiance and similar spectral light sources. Input uncertainty of field measurements, equipment calibration accuracies, and the CIE curves was considered in the development of a reasonable conversion factor. The analysis and measurement show the irradiance to illuminance conversion factor is 1 W/m2 equals 116 ± 3 lx for indoor LED based solar simulators and 122 ± 1 lx for outdoor natural sunlight. An engineering rule of thumb is 120 lx equals 1 W/m2, or 1 Sun equals 120000 lx.
This guide provides a basis for the utilization of a light meter for the measurement of sunlight for the evaluation of PV cells at low irradiance levels. The conversion factor is reversible from either W/m2 to lx or lx to W/m2. This conversion works because the solar irradiance data are well understood, standardized, and include set levels at each wavelength
A useful conversion would be the illuminance values of artificial light in lx converted to W/m2. This conversion is not straightforward because the CIE curves are strongly wavelength-dependent, and the widely varying composition of artificial light spectra means a single factor utilizing illuminance measurement is not possible. A method to utilize illuminance and light source spectral power distribution would enable the evaluation of PV cell performance under low-level artificial and other types of non-solar spectral lighting.
References
-
Goswami Y. Principles of Solar Engineering. CRC Press, 2015.
-
Realization of Related Photometric Units, https://www.nist.gov/pml/sensor-science/optical-radiation/realization-related-photometric-units.
-
Mancilla-David F., Riganti-Fulginei F., Laundani A., Salvini A. A neural network-based low-cost irradiance sensor. IEEE Transactions on Instrumentation and Measurement, Vol. 63, Issue 3, 2014, p. 583-591.
-
Preston J. Responses to light and radiation: a guide to units, conversion factors and computations. Lighting Research and Technology, Vol. 6, Issue 2, 1974, p. 89-94.
-
Carullo A., Vallan A. Outdoor experimental laboratory for long-term estimation of photovoltaic-plant performance. IEEE Transactions on Instrumentation and Measurement, Vol. 61, Issue 5, 2012, p. 1307-1314.
-
Cristaldi L., Faifer M., Rossi M., Ponci F. A simple photovoltaic panel model: characterization procedure and evaluation of the role of environmental measurements. IEEE Transactions on Instrumentation and Measurement, Vol. 61, Issue 10, 2012, p. 2632-2641.
-
Ruedi I., Finsterie W. The World Radiometric Reference and its Quality System, Physikalisch-Meteorologisches Observatorium Davos/World Radiation Center, 2005.
-
Best Practices Handbook for the Collection and Use of Solar Resource Data for Solar Energy Applications. Second Edition, National Renewable Energy Laboratory Technical Report NREL/TP-5D00-68886, 2017.
-
Solarmeter, https://www.solarmeter.com/product-category/sun-meters/.
-
Gueymard C. Parameterized transmittance model for direct beam and circumsolar spectral irradiance. Solar Energy, Vol. 71, Issue 5, 2001, p. 325-346.
-
Gueymard C. The sun’s total and spectral irradiance for solar energy applications and solar radiation models. Solar Energy, Vol. 76, Issue 4, 2004, p. 423-453.
-
ASTM Standard Tables for Reference Solar Spectral Irradiances: Direct Normal and Hemispherical on 37° Tilted Surface, https://www.astm.org/Standards/G173.htm.
-
IEC 60904-9:2007 Photovoltaic devices – Part 9: Solar simulator performance requirements, https://webstore.iec.ch/publication/3880.
-
CIE Commission Internationale de I’Eclariage CIE (1926). Commission Internationale de l’Eclairage Proceedings, Cambridge University Press, Cambridge, 1924.
-
Fiorentin P., Scroccaro A. Detector-based calibration for illuminance and luminance meters – experimental results. IEEE Transactions on Instrumentation and Measurement, Vol. 59, Issue 5, 2010, p. 1375-1381.
-
NREL ASTM G-173 spreadsheet “astm173.xls” containing solar AM1.5 irradiance data, https://www.nrel.gov/grid/solar-resource/spectra-am1.5.html.
-
PV Education, Standard Solar Spectra ASTM G-173-03, https://www.pveducation.org/pvcdrom/appendices/standard-solar-spectra.
-
Kipp & Zorn CPM11, Manual, https://www.kippzonen.com/Download/72/Manual-Pyranometers-CMP-series-English.
-
Ingenieurbur Silicon Irradiance Sensor, https://www.mbcontrol.com/wp-content/uploads/2018/09/Ingenieurburo-Silicon-Irradiance-Sensor-Si-Sensor.pdf.
-
Borodulin Pavel The Physics Factbook, https://hypertextbook.com/facts/2002/PavelBorodulin.shtml.
-
CIE “physiologically-relevant” luminous efficiency functions CIE data sets, http://www.cvrl.org/lumindex.htm.
-
Colour and Vision Research Laboratory and Database 2008 data, http://www.cvrl.org/database/data/lum/linCIE2008v2e_5.htm.
-
NIST National Institute of Standards and Technology, Redefinition of Candela, https://www.nist.gov/si-redefinition/candela.
-
Zhao S. The Physics Factbook, https://hypertextbook.com/facts/2007/SusanZhao.shtml.
-
Littlefair L. The luminous efficacy of daylight: a review. Lighting Research and Technology, Vol. 17, Issue 4, 1985, p. 162-182.
-
Reference Solar Spectral Irradiance: Air Mass 1.5, https://rredc.nrel.gov/solar//spectra/am1.5/.
-
Li D., Lam T., Cheung K., Tang H. An analysis of luminous efficacies under the CIE standard skies. Renewable Energy, Vol. 33, 2008, p. 2357-2365.
-
Robledo L., Soler A. Luminous efficacy of global solar radiation for clear skies. Energy Conversion and Management, Vol. 41, 2000, p. 1769-1779.
-
Online Conversion, Watt conversion to Lux, http://www.onlineconversion.com/forum /forum_1011697886.htm.
-
Speedy Converter, Web Site Unit’s Converter Watt/Square Meter to Lux, http://www.speedyconverter.com/?c=watt%2Fsquare+meter+to+lux.
-
EGC Environmental Growth Chambers, Useful Lighting Information, http://www.egc.com/useful_info_lighting.php.
-
Smith Sarah Converter lux to watts per square metre. https://gwhiteqcarol.weebly.com/blog/convert-lux-to-watts-per-square-metre-download.
-
Daylight. Wikipedia, https://en.wikipedia.org/wiki/Daylight.
-
Fiber Optic Tech, the Web site for Fiberoptic Technology Incorporated, https://www.fiberopticstech.com/technical/measuring_intensity.php.
-
Lux. Wikipedia, https://en.wikipedia.org/wiki/Lux.
-
Futura Science, https://forums.futura-sciences.com/physique/289142-correspondance-lux-w-m-2-a.html, (in French).
-
Dogniaux R. Meteorological data on sunshine and natural light (Donnees Meteorologiques concernat l’Ensoleiilement et l’Eclaire Naturel). Cahiers CSTB (44), Cahier 351, 1960.
-
Kuhn M. Natural illumination of the Antarctic Plateau. Theoretical and Applied Climatology, Vol. 21, 1973, p. 55-66.
-
Evenvich T., Nikol’skaya N. Methods of calculating the natural illuminance of the earth’s surface. Soviet Meteorology and Hydrology, Vol. 2, 1976, p. 43-46.
-
Liebelt C. Sky Luminance and Radiance Distribution. Dissertation, University of Karlsruche, 1978.
-
Shukuya M., Kimura K. Estimation of daylight illuminance from solar radiation data on hourly basis with luminous efficacy of daylight. Transactions of the Architecture Institute of Japan, Vol. 293, 1980, p. 85-95, (in Japanese).
-
Petersen E., Pedersne P. Measurements of daylight irradiance and illuminance on a horizontal and four vertical surfaces at Vaerlose Airbase, Denmark. Proc. CIE, Amsterdam, 1983.
-
Navvab M., Karayel M., Ne’eman E., Selkowitz S. Daylight availability data for San Francisco. Energy and Buildings, Vol. 6, Issue 3, 1984, p. 273-282.
-
McCluney W. Skysize – a simple procedure for sizing skylights based upon statistical illumination performance. Energy and Buildings, Vol. 6, 1984, p. 213-219.
-
Treado S., Gillette G. Measurements of sky luminance, sky illuminance and horizontal solar radiation. Journal of the Illuminating Engineering Society, Vol. 12, Issue 3, 1983, p. 130-135.
-
JIS, Illuminance Meters – Part 1: General Measuring Instruments Japanese Standards Association (Japanese Language Standard, using Google Translate) JIS C 1609-1:2006, 2006.
-
Pons A., Barrio A., Campos J. Variation of the luminous efficacy of direct, global and diffuse solar radiation with atmospheric parameters. Lighting Research Technology, Vol. 36, Issue 1, 2004, p. 31-43.
Cited by
About this article
The authors gratefully acknowledge the use of the Florida Gulf Coast University’s Emergent Technology Institute (ETI) equipment, lab, and support from the director, Dr. Thomas Missimer. ETI equipment included the Sofie Solar Data Collection System, Oriel MiniSol solar simulator, and lab space in the renewable energy laboratory.
