Abstract
In order to explore the noise reduction effect and application of different hearing protectors in different workplaces in a power station, so as to facilitate to select differently suitable hearing protectors to staff based on needs. This paper uses principal component analysis and evaluation according to the insertion loss test results of 112 kinds of hearing protectors. Combined with the field test results of 10 workplaces in a power station, it is found that 112 kinds of hearing protectors mostly are suitable in 7 working places. People need to select suitable hearing protectors specifically in other 3 places. At the same time, this paper can provide reference for the selection of hearing protection in other different working places.
1. Introduction
With the deepening of reform and opening up and the rapid development of the national economy, the construction of power station has also entered a period of rapid development. Because the power station has the characteristics of high water head, large capacity, high speed of the unit, two-way operation of water flow and changing frequency of working conditions, the noise is quite obvious, which will have a great impact on the personnel working in the factory area. Long-term work is highly likely to lead to permanent hearing loss and even severe occupational deafness in a high-noise environment without effective protection [1, 2]. At present, many countries have listed occupational deafness as one of the important occupational diseases [3, 4]. Therefore, people working in the high noise area of power station need hearing protection to avoid the risk of hearing loss. In this paper, we tested the insertion loss of 112 kinds of hearing protectors on the market, then we picked out the more suitable hearing protectors in 10 kinds of workplaces in the power station using principal component analysis method. At present, there are many kinds of hearing protectors that can be purchased, workers have some confusion when choosing them, and they often cannot find the most suitable hearing protectors. In order to help workers make the best choice according to the needs of the workplace and protect their hearing, this research work has been carried out.
2. Characteristics and analysis of power station noise
In this paper, there are different workplaces in this power station, the environment noise is measured separately in order to fully understand the noise situation of power station and select the best noise protection equipment. The noise exposure value in the working place is mainly measured, and the test time is from March 21th to March 23th in 2018. Under the operating condition of each unit, the ventilation facilities should operate normally. The noise level of the operating condition of each unit are shown in Table 1.
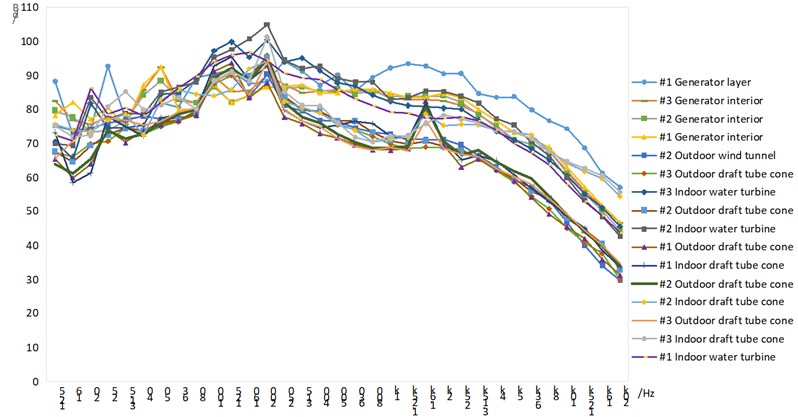
From Table 1, it can be seen that there are 10 testing places which are more than 85 dBA. The spectrum measurement and analysis of the 10 workplaces under operating conditions are shown in Fig. 1.
Table 1The noise level of the operating condition of each unit
No. | Workplaces | Testing places | dB(A) | No. | Places | Points | dB(A) |
1 | Generator layer | #1 Generator layer | 78.4 | 18 | Water turbine layer | #1 Outdoor water turbine | 85.2 |
2 | #1 Generator interior | 94.6 | 19 | #1 Indoor water turbine | 93.6 | ||
3 | #2 Generator layer | 77.3 | 20 | #2 Outdoor water turbine | 84.8 | ||
4 | #3 Generator layer | 76.8 | 21 | #2 Indoor water turbine | 93.7 | ||
5 | #4 Generator layer | 72.3 | 22 | #3 Outdoor water turbine | 83.2 | ||
6 | Installing room | 68.9 | 23 | #3 Indoor water turbine | 91.5 | ||
7 | Wind tunnel layer | #1 Outdoor wind tunnel | 82.6 | 24 | Main electrical wire Hall | #1 Main electrical wire hall | 79.8 |
8 | #2 Outdoor wind tunnel | 84.2 | 25 | #2 Main electrical wire hall | 76.0 | ||
9 | #3 Outdoor wind tunnel | 83.7 | 26 | #3 Main electrical wire hall | 76.1 | ||
10 | #4 Outdoor wind tunnel | 81.7 | 27 | Transformer chamber | #1 Transformer chamber | 82.7 | |
11 | Volute layer | #1 Outdoor draft tube cone | 82.9 | 28 | #2 Transformer chamber | 84.7 | |
12 | #1 Indoor draft tube cone | 84.4 | 29 | #3 Transformer chamber | 85.5 | ||
13 | #2 Outdoor draft tube cone | 85.1 | 30 | Cable interlayer | 72.0 | ||
14 | #2 Indoor draft tube cone | 87.9 | 31 | SFC room | 70.7 | ||
15 | #3 Outdoor draft tube cone | 85.5 | 32 | LCU room | 68.2 | ||
16 | #3 Indoor draft tube cone | 88.7 | 33 | LCU switching room | 65.0 | ||
17 | #4 Ball valve area | 84.7 | 34 | GIS room | 71.0 |
3. Selection of hearing protections
3.1. Preliminary screening of hearing protectors
We tested 112 kinds of hearing protectors insertion loss, they are all selected randomly from the market. During the test, we referred to the following standards: ISO 4869-3:2007 “Acoustics-Hearing protectors – Part 3: Measurement of insertion loss of ear-muff type protectors using an acoustic test fixture” and ISO 4859-2:1994 “Acoustics-Hearing protectors – Part 2: Estimation of effective A-weighted sound pressure levels when hearing protectors are worn” [5, 6].
We tested using the instruments by B&K 4128C Head and Torso Simulators, using the pink noise as the noise source. The sound pressure levels were tested with [1] the hearing protector and without the hearing protector, respectively. The results of errors are insertion loss, that is:
where Ll,Aeq is the equivalent continuous A-weighted sound pressure level after wearing hearing protectors when workplaces are tested. Lp,i is the actual test of each frequency band sound level in different workplaces. Le,i is the insertion loss of each frequency band sound level of different kinds of hearing protectors, i is 33 frequency bands.
Fig. 1The spectrum of 1/3 octave of noise in 10 working places

The steps of testing are:
(1) The sound pressure level at the microphone is tested using PLUSE 7758 when Head and Torso Simulators are not inserted the hearing protector.
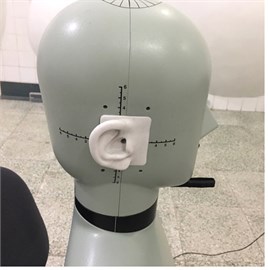
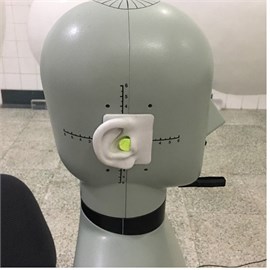
(2) Place the hearing protectors in the Head and Torso Simulators’ ear canal in sequence, and ensure the hearing protectors is located in the center of the microphone (as shown in Fig. 2).
(3) After about 30 s, the sound pressure level is tested again using PLUSE 7758 when Head and Torso Simulators are inserted the hearing protector.
(4) Repeat steps (1)-(3) three times with the same hearing protectors, the average value of three times is used to calculate the insertion loss.
Fig. 2The contrast of before and after hearing protectors insertion


The equivalent continuous A-weighted sound pressure level can be obtained by weighting the insertion loss of each frequency band. Based on GB/T 23466-2009 “Guidelines for selection of hearing protectors”, the effective value of the weighted sound pressure level is between 75 dB(A)-80 dB(A) after the operator is protected by the hearing protector. While less than 70 dB(A) indicates that the hearing protectors are overprotective, and the more than 80 dB(A) are lack of protection [4]. The Eq. (1) is used to calculate the equivalent continuous A-weighted sound pressure level with hearing protectors in each test place. There are 24 kinds of hearing protectors, the equivalent continuous A-weighted sound pressure level are between 75 dB(A)-80 dB(A) after wore, as shown in Table 2.
Table 2The better testing results of different brands in the different workplaces
No. | testing places | The better testing results of the Brands |
1 | #1 generator interior | Lian Zhi Pi, 3M, Quies, Deltaplus-conifit, Shi Da, Xing Gong, Nan Ji Ren, Black Forest Soft, Mack’s-aqua-block, De Bei Nuo, Ju Li, Jin Xiu Yue Dian, Mei Bai |
2 | #1 outdoor water turbine | Shi Da, Xing Gong |
3 | #1 indoor water turbine | Venitex-conicfit06, Lian Zhi Pi, Quies, Deltaplus-conifit, Sai Er Bi, Ju Jia Jia, Pluggerz-sleep |
4 | #2 indoor water turbine | Venitex-conicfit06, Lian Zhi Pi, Quies, Deltaplus-conifit, Ohropax-color, Ohropax-mini-soft, Ohropax-classic, Mack’s, Nan Ji Ren, Mack’s-earammo, Ju Jia Jia, Ju Li, Jin Xiu Yue Dian, Pluggerz-diy, Mei bai |
5 | #3 indoor water turbine | Venitex-conicfit06, Lian Zhi Pi, Quies, Deltaplus-conifit, Ohropax-color, Ohropax-mini-soft, Shi Da, Ohropax-classic, Mack’s, Nan Ji Ren, Mack’s-earammo, Ju Jia Jia, Ju Li, Jin Xiu Yue Dian, Mei Bai |
6 | #2 outdoor draft tube cone | Shi Da, Xing Gong, Sai Er Bi |
7 | #2 indoor draft tube cone | Lian Zhi Pi, Quies, Xing Gong, Sai Er Bi, Pluggerz-sleep |
8 | #3 outdoor draft tube cone | Shi Da, Xing Gong, Sai Er Bi |
9 | #3 indoor draft tube cone | Xing Gong, Sai Er Bi |
10 | #3 transformer chamber | – |
3.2. Statistical analysis
Principal component analysis (PCA) is a multivariate statistical method that transforms multiple indexes into a few comprehensive indexes based on the idea of dimensionality and the principle of minimizing the loss of data information [7].
In this paper, the insertion loss of each central frequency band of 24 kinds of hearing protectors is analyzed by PCA method, as shown in Table 3 and Table 4.
Table 3Communalities
Frequency | Initial | Extraction |
31.5 Hz | 1.000 | 0.783 |
63 Hz | 1.000 | 0.772 |
125 Hz | 1.000 | 0.937 |
250 Hz | 1.000 | 0.952 |
500 Hz | 1.000 | 0.940 |
1000 Hz | 1.000 | 0.910 |
2000 Hz | 1.000 | 0.940 |
4000 Hz | 1.000 | 0.853 |
8000 Hz | 1.000 | 0.641 |
16000 Hz | 1.000 | 0.612 |
Table 4Total variance explained
Component | Initial eigenvalues | Extraction sums of squared loading | ||||
Total | % of variance | Cumulative % | Total | % of variance | Cumulative % | |
1 | 6.990 | 69.899 | 69.899 | 6.990 | 69.899 | 69.899 |
2 | 1.349 | 13.492 | 83.391 | 1.349 | 13.492 | 83.391 |
3 | .636 | 6.361 | 89.752 | |||
4 | .426 | 4.265 | 94.017 | |||
5 | .254 | 2.540 | 96.557 | |||
6 | .207 | 2.067 | 98.623 | |||
7 | .087 | .868 | 99.492 | |||
8 | .028 | .282 | 99.774 | |||
9 | .014 | .135 | 99.909 | |||
10 | .009 | .091 | 100.00 | |||
According to Table 3, it can be obtained that the principal component coefficients extracted in each frequency band are all more than 0.5, which indicates that the extracted principal components have a higher degree of interpretation of each variable. According to Table 4, two principal components were extracted in this calculation analysis. The characteristic root of the first principal component is 6.990, the variance contribution rate is 69.899 %. And the characteristic root of the second principal component is 1.349, the variance contribution rate is 13.492 %. The cumulative variance contribution rate of the two principal components is 83.391 %. It is further indicated that the extraction of the two principal components is appropriate.
Table 5Component matrix*
Frequency | Component | Frequency | Component | ||
1 | 2 | 1 | 2 | ||
31.5 Hz | –0.055 | 0.883 | 1000 Hz | 0.936 | –0.185 |
63 Hz | –0.856 | 0.200 | 2000 Hz | 0.968 | –0.061 |
125 Hz | 0.967 | 0.036 | 4000 Hz | 0.906 | 0.180 |
250 Hz | 0.956 | –0.196 | 8000 Hz | 0.800 | –0.026 |
500 Hz | 0.952 | –0.186 | 16000 Hz | 0.477 | 0.620 |
* 2 components extracted | |||||
As shown in Table 5, the correlation coefficient between the first principal component and frequencies from 63 Hz to 8000 Hz are all close to 1, this indicate that there are more hearing protectors with noise reduction range from 63 Hz to 8000 Hz in the tested hearing protectors. Similarly, there are more hearing protectors with noise reduction range with frequency bands of 31.5 Hz and 16000 Hz in the second principal component.
Each principal component can be weighted and summed according to the characteristic root of each principal component:
where F1 and F2 are two principal component functions respectively, u1 and u2 the characteristic roots of the two principal components respectively. According to Eq. (2), the ranking of principal component score and comprehensive score of 24 kinds of hearing protectors can be determined, as shown in Table 6.
We can see from the Table 6 that in the comparison of each brand of hearing protection in this study, the hearing protection of Xing Gong brand is more representative among 63-8000 Hz, and Pluggerz-sleep brand’s hearing protection is more representative in 31.5 Hz and 16000 Hz.
Combined with the above principal component analysis, it can be concluded that among the 112 kinds of hearing protection devices tested, most of the hearing protection devices are more suitable for the 7 sites studied: #1 generator layer, #1 outdoor water turbine, #1 indoor water turbine, #2 outdoor draft tube cone, #2 indoor draft tube cone, #3 outdoor draft tube cone and #3 indoor draft tube cone.
Table 6The ranking of principal component score and comprehensive score of 24 kinds of hearing protectors
Brands | Rank the score of principal component 1 | Rank the score of principal component 2 | Rank the comprehensive score | Brands | Rank the score of principal component 1 | Rank the score of principal component 2 | Rank the comprehensive score |
Venitex-conicfit06 | 5 | 24 | 9 | Black Forest-soft | 20 | 10 | 20 |
Lian Zhi Pi1# | 7 | 18 | 8 | Mack’s-aquablock | 14 | 13 | 13 |
3M-1270 | 16 | 21 | 16 | De Bei Nuo | 24 | 7 | 24 |
Quies | 4 | 9 | 4 | Mack’s-earammo | 18 | 12 | 18 |
Deltaplus-conifit | 3 | 23 | 6 | Sai Er Bi | 8 | 8 | 5 |
Ohropax-color | 23 | 15 | 23 | Ju Jia Jia | 15 | 6 | 14 |
Ohropax-mini-soft | 22 | 14 | 22 | Ju Li | 12 | 16 | 10 |
Shi Da | 2 | 11 | 2 | Jin Xiu Yue Dian | 10 | 22 | 12 |
Xing Gong | 1 | 3 | 1 | Pluggerz-Sleep | 6 | 1 | 3 |
Ohropax-classic | 13 | 20 | 15 | Pluggerz-diy | 9 | 2 | 7 |
Mack’s | 11 | 19 | 11 | Mei Bai | 21 | 4 | 21 |
Nan Ji Ren | 19 | 5 | 19 | Lian Zhi Pi2# | 17 | 17 | 17 |
Note: The score ranking only shows the representation of the two principal components of each brands and has nothing to do with the noise reduction effect | |||||||
4. Conclusions
According to the test analysis in this paper, it can be seen that the working environment and noise intensity of the power station are different. In the 10 of the 34 sites tested, the noise is too high, which is not conducive to workers’ work and affects the physical and mental health of workers, so it is necessary to effectively protect the situation.
By testing the insertion loss of 112 kinds of hearing protectors, 24 kinds of hearing protectors with better noise reduction effect were selected. The principal component analysis of the 24 kinds of hearing protectors were carried out and find out the most representative hearing protectors. Most of the 112 kinds of hearing protectors tested are suitable for the 7 workplaces. The other 3 workplaces need to be targeted to choose the suitable hearing protectors. This study also provides a reference for other workplaces to choose the type of hearing protectors.
References
-
Wang Runlan, Liu Shufeng, Cheng Suxuan Problems and countermeasures of protective measures against occupational noise deafness. Journal of Diseases Monitor and Control, Vol. 7, Issue 7, 2013, p. 443-444.
-
Shi Lei, Zhang Xing Research progress on effects of noise on human health. China Occupational Medicine, Vol. 42, Issue 2, 2015, p. 225-228.
-
Yan Zhi Occupational noise hazard and control. Modern Occupational Safety, Vol. 8, 2008, p. 96.
-
Whittaker J. D., Robinson T., Acharya A., Singh D., Smith M. Noise-induced hearing loss in small-scale metal industry in Nepal. The Journal of Laryngology and Otology, Vol. 128, Issue 10, 2014, p. 871-880.
-
ISO 4869-3: 2007. Acoustics-Hearing Protectors – Part 3: Measurement of Insertion Loss of Ear-Muff Type Protectors Using an Acoustic Test Fixture, 2007.
-
ISO 4859-2:1994. Acoustics-Hearing Protectors – Part 2: Estimation of Effective A-Weighted Sound Pressure Levels When Hearing Protectors Are Worn, 1994.
-
Wang Donghua Multivariate Statistical Analysis and SPSS Application. Shanghai, 2016.

