Abstract
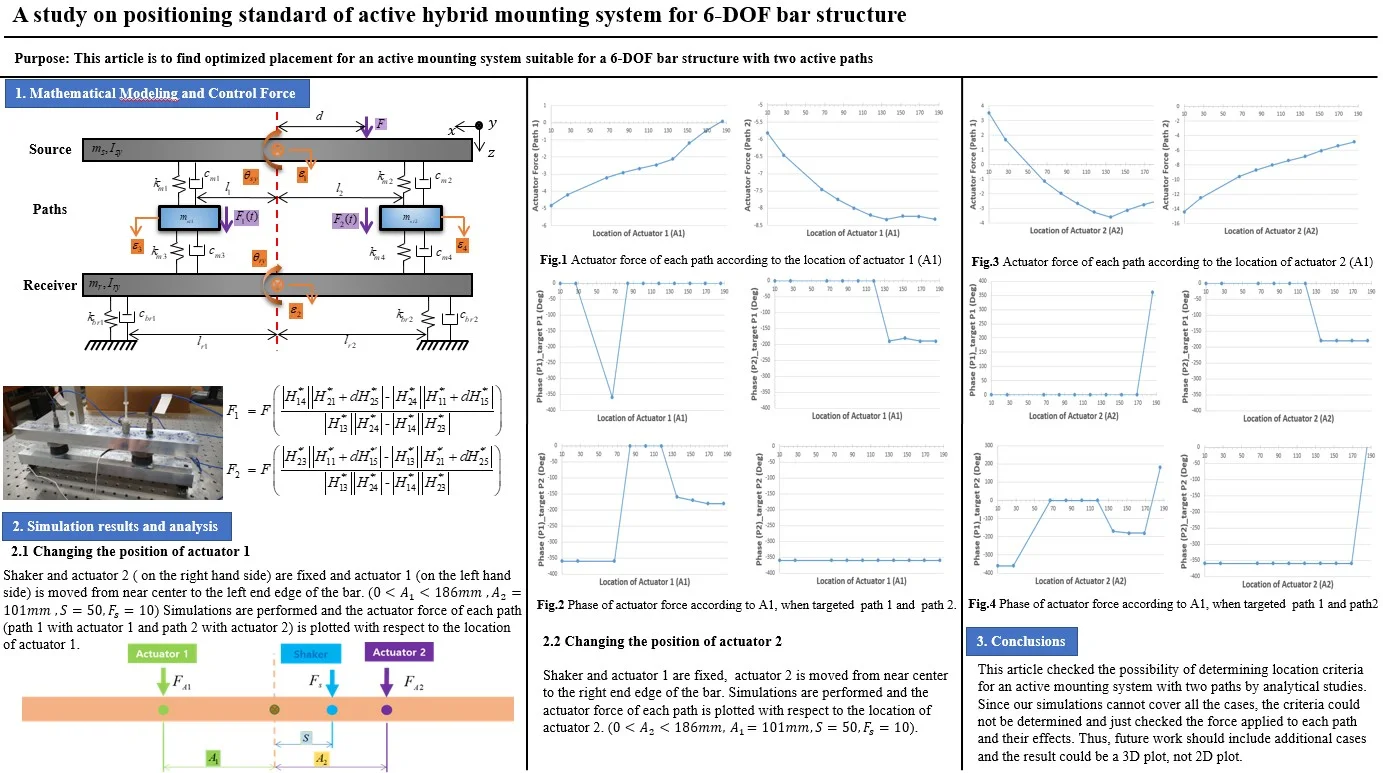
This article is to find optimized placement for an active mounting system suitable for a 6-DOF bar structure with two active paths. When a sinusoidal excitation force is applied to the structure, secondary force and phase of the two active supports can be calculated mathematically. When the position changes, the magnitude and phase of the secondary forces in each path will be analyzed using simulation. If the forces applied to the two active mounting system are relatively small and the phase does not change by 180 degrees, these specific positions of paths are considered as optimized positions of the active mounting system. Based on the simulation results, criteria for selecting the location are proposed, which will be very useful for proper selection of actuators for engine mount system.
Highlights
- In this article, analysis secondary force and phase of the two active supports when a sinusoidal excitation force is applied to a 6-DOF bar structure
- According to free body diagram, the equation of motions are derived .Based on the lumped parameter modeling, secondary force and phase of the two active supports can be calculated mathematically
- Simulation results and discussion according to change the position of actuator 1 and actuator 2
- In order to validate the above analytical results, a static analysis is performed on the 6-DOF model. Results show the same trend from the simulation results
- The location criteria cannot be determined based on those analysis results. This defect could be overcome by considering both paths moving and cover all the cases
1. Introduction
In automotive industries, engine vibration isolation has been always a difficult task and due to the trend of lighter weight and higher power of vehicles, it has become a more serious problem. In order to improve the NVH performance of mounting systems, active control methodologies have been applied and many research has focused on the position of the engine mount system to optimally reduce vibration. Genetic algorithms are utilized to find the optimized locations of piezoelectric actuators and sensors for active vibration control [1]. For different engine installation positions, vibration characteristics of heavy commercial vehicles are studied. They demonstrate how to achieve the engine isolation by arranging the engine isolator in the longitudinal direction of the powertrain [2]. Vibration reduction of a coupled path structure with a piezoelectric laminated actuator and a rubber bearing is studied and active path interactions are quantified based on the dynamic characteristics of the passive system [3]. However, under the same excitation conditions, the vibration reduction could be changed as the position of the movable active engine mount changes. Thus, this research will focus on optimizing the location of active elements.
In this study, the experimental setup shown in Fig. 1 is prepared and its numerical analysis would be presented. Upper and lower bars are representing the vehicle engine and the sub-frame, respectively. There are two paths made of a piezo-stack actuator and a rubber mount to provide active vibration isolation between the bars. At first, a parametric model is proposed for a given laboratory experiment structure and establish a motion equation. Then, numerical simulation will be performed and the results will be analyzed to determine the criteria for selecting the best location for the mounting system.
2. 6-DOF modeling
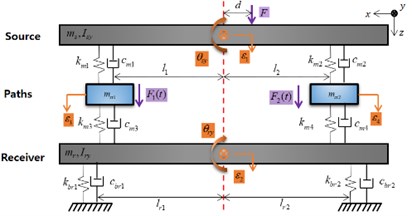
Lumped parameter modeling for numerical analysis and its corresponding free body diagram are shown in Fig. 2. ms, mr refer to the mass of source and receiver and F1(t), F2(t) are the control forces in each path. Also, F(t) is exciting force and εi are displacement of vertical motions. d represents a distance from center of bar to exciting force. Θsy, Θry are rotational motions and Isy, Iry represent the inertia of y axis on the source and receiver. l1,2, lbr1,2 are the lengths from center to active mount and rubber mount. kmi, kbri refer to stiffness.
Fig. 1Laboratory experiment setup
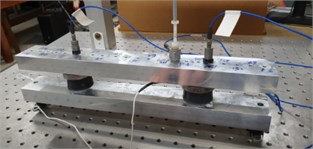
Fig. 26-DOF model and free body diagram.
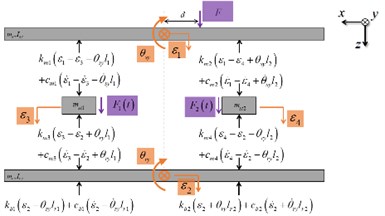
In addition, M, q(t), W(t), and F(t) are the inertia and displacement matrices, exciting force and control force vectors. K, C are the complex valued stiffness matrix and damping matrix:
2.1. Control force calculation
Assume that the control forces F1(t), F2(t) are complex valued variables. At the same time, the dynamic stiffness matrix is defined as ˜κ=[-ω2M'+K']-1 and the complex valued compliance matrix values H*'=[κ']-1 can be obtained though following matrix. By the phase-matching method, the phase difference caused by disturbance force and control force can be eliminated [3]. Using the condition that the motions to be reduced to virtually zero, the equation is set about the control force and it is calculated, as shown in Eqs. (8-9):
F1=F(|H*'14||H*'21+dH*'25|-|H*'24||H*'11+dH*'15||H*'13||H*'24|-|H*'14||H*'23|),
F2=F(|H*'23||H*'11+dH*'15|-|H*'13||H*'21+dH*'25||H*'13||H*'24|-|H*'14||H*'23|).
3. Simulation results and analysis
3.1. Changing the position of actuator 1
In this case, shaker and actuator 2 (the one on the right hand side) are fixed, and actuator 1 (the one on the left hand side) is moved from near center to the left end edge of the bar. (0<A1<186 mm, A2= 101 mm, S= 50, Fs= 10) Simulations are performed and the actuator force of each path (path 1 with actuator 1 and path 2 with actuator 2) is plotted with respect to the location of actuator 1.
Fig. 3Actuator force of each path according to the location of actuator 1 (A1)
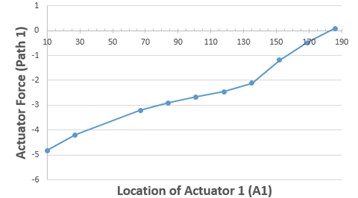
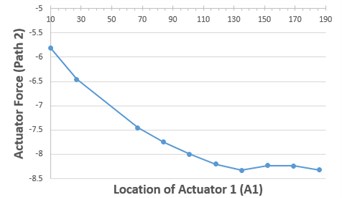
Fig. 4The positional relationship among shaker, actuator 1, and actuator 2

Actuator 2 is fixed at a certain location and actuator 1 moves away from the center of the bar to the left edge. Fig. 3 shows that smaller control force is needed in path 1 and larger control force is needed in path 2, as the actuator 1 moves to the left. Also, the control forces in both paths have the same sign – meaning that they act in the same direction – while they have opposite sign to the shaker force. When the vibration attenuation or isolation happen and the level becomes ideally zero, this condition can be assumed a type of motion equilibrium and static analysis could be applied to this situation. Thus, if the distance between the center and the actuator 1 increases, the control force in path 1 will be decrease, considering the moment equilibrium in the y-axis. In addition, in order to establish the moment equilibrium, as well as cancel out the z-direction force from the shaker, actuator 2 would have larger force than actuator 1. Moreover, it can be thought that since actuator 2 is closer to the shaker, relative force amplitude required could be larger.
In order to validate the above analytical results, a static analysis is performed on the 6-DOF model. Fig. 4 shows the positions of shaker, actuator 1 and 2. Two equations can be derived based on the force equilibrium and the moment equilibrium about the center of the bar structure.
The positive direction of the shaker is assumed to be downward and the equilibrium equation of force is established as Eq. (10). Also, the positive direction of the moment is assumed to be clockwise and the equilbrium equation of moment is established as Eq. (11). Substituting Eq. (10) into Eq. (11), Eq. (12) can be obtained and the required force in each path is plotted:
FA2=(-A1-SA1+A2)Fs=(-1+A2-SA1+A2)Fs.
Fig. 5Actuator force estimated from the static equilibrium

Fig. 6Phase of actuator force according to A1, when targeted a) path 1 and b) path 2

a)

b)
Above results show that FA1 decreases with the increase of A1 and FA2 increases with the increase of A1, which shows the same trend from the simulation results. The phase values of each actuator are also changing according to the location of actuator 1. As the actuator 1 is placed away from the center of the bar structure and the path 1 is targeted (the vibration level of path 1 is to be zeroed), the clockwise moment becomes larger and larger and in order to balance it, the phase of actuator 2 (path 2) should be changed by 180 degree at a certain range, while the phase of actuator 1 (path 1) is kept the same. In the similar manner, when the path 2 is targeted (the vibration level of path 1 is to be zeroed), the clockwise moment becomes larger and larger and in order to balance it, the phase of actuator 1 (path 1) should be changed by 180 degree at a certain range, while the phase of actuator 2 (path 2) is kept the same.
3.2. Changing the position of actuator 2
In this case, shaker and actuator 1 are fixed, and actuator 2 is moved from near center to the right end edge of the bar (0<A2<186 mm, A1= 101 mm, S=50, Fs= 10). Simulations are performed and the actuator force of each path is plotted with respect to the location of actuator 2.
Fig. 7Actuator force of each path according to the location of actuator 2 (A2)
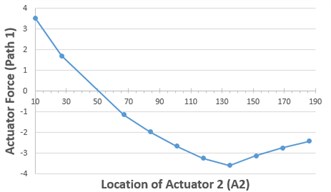
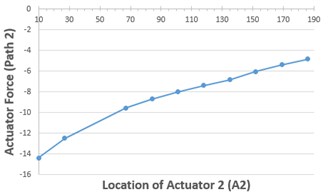
Fig. 8Actuator force estimated from the static equilibrium

Fig. 9Phase of actuator force according to A2, when targeted a) path 1 and b) path 2

a)

b)
Actuator 1 is fixed at a certain location and actuator 2 moves away from the center of the bar to the right edge. Fig. 7 shows that positive force for the actuator 1 is needed and the absolute value of the force is decreased when the actuator 2 is on the left hand side of the shaker. In the other way, negative force is needed and the absolute value of the force is increased when the actuator is on the right hand side of the shaker. When the actuator is placed on the left of the shaker, two paths exist simultaneously on the left side of the shaker. In this case, when the force of two paths have the same sign (since the force has always negative sign for actuator 2), the moment is inevitable. Thus, in order to attain static equilibrium, two actuator force should be in different direction. In addition, larger control force is needed in path 2, as the actuator 2 moves to the right. Moreover, it can be thought that since actuator 2 is closer to the shaker, relative force amplitude required could be larger.
A static analysis results are as follows. Eq. (12) is utilized and the location of actuator 2 is changed at this time. It can be seen that that FA1 decreases with the increase of A2 and FA2 increases with the increase of A2. Also, the plot crosses the x-axis near A2=50 mm. It can be seen that the results show the same trend from the simulation results. The phase values of each actuator has similar trend with the previous case, as shown in Fig. 9.
3.3. Location criteria
It can be considered as a better condition if the actuator force is relatively smaller and the phase is not changing abruptly and keeping 0 degree, preventing malfunctioning of the actuator. Based on the above analysis, the location criteria can be considered as follows: 1) Smaller control force is needed in path 1 and larger control force is needed in path 2, as the actuator 1 moves to the left. Thus, no condition is available for making both paths good and it is irreconcilable. 2) Smaller control force is needed in path 1, as the actuator 2 is near the shaker and larger control force is needed in path 2, as the actuator 2 moves to the right. Also, no condition is available for making both paths good and it is irreconcilable.
Therefore, the location criteria cannot be determined based on those analysis results. Since one path is fixed in those cases, they are just special cases and can be utilized to check the force applied to each path and their effects. This defect could be overcome by considering both paths moving and cover all the cases.
4. Conclusions
This article checked the possibility of determining location criteria for an active mounting system with two paths by analytical studies. Since our simulations cannot cover all the cases, the criteria could not be determined and just checked the force applied to each path and their effects. Thus, future work should include additional cases and the result could be a 3D plot, not 2D plot.
References
-
Bruant I., Coffignal G., Lene F., Verge M. A methodology for determination of piezoelectric actuator and sensor location on beam structures. Journal of Sound and Vibration, Vol. 243, Issue 5, 2001, p. 861-882.
-
Kumar M. N., Chinnaraj K., Loganathan E. Study of effect of varying engine mount locations and stiffness on vibration in heavy commercial vehicles. International Journal of Engineering Research and Technology, Vol. 3, Issue 2, 2014, p. 2765-2768.
-
Liette J., Dreyer J. T., Singh R. Interaction between two active structural paths for source mass motion control over mid-frequency range. Journal of Sound and Vibration, Vol. 333, 2014, p. 2369-2385.
About this article
This study was supported by the National Research Foundation of Korea (NRF) grant funded by the government of Korea (Ministry of Science, ICT and Future Planning) (No. 2019R1F1A1061172).

