Abstract
Rock contains a large number of micro-pores, which are of different shapes and complex structures. The structure information of sandstones is extracted based on different porosities through X-ray CT (Computer Tomography) scanning, photo processing techniques and complex network method to explore the topological structure of sandstone seepage network. The results show that sandstone seepage network has scale-free property. The minute quantities of pores with more throat connections have vital functions of overall connectivity of sandstone seepage network, while sandstone seepage network has strong robustness with random error. This research can provide reference for across scales research of porous seepage and multi-disciplinary application of complex network theory.
Highlights
- It can be seen in this study that scale-free network can reasonably describe the topological structure of sandstone seepage network.
- The seepage degree of sandstone seepage network with different porosity meets the power-law distribution.
- The seepage network of sandstone with different porosity has similar fault-tolerant mechanism to reduce the number of pores.
- The sandstone seepage network is robust to random errors, so the influence of pore plugging on the whole seepage can be analyzed.
- The minute quantities of pores with more throat connections have vital functions of overall connectivity of sandstone seepage network.
1. Introduction
Rational description and quantitative characterization of pore structure is the key to reveal the microscopic mechanism of the macroscopic percolation phenomenon and improve the oil and gas recovery in the process of rock seepage [1-4]. At present, rock pores are commonly characterized by porosity, fractal dimension and coordination number [5-7]. The detailed topological structure of the pore network, and the inherent relationship between the topological structure and the macroscopic percolation phenomenon are uncertain. In recent years, as an emerging interdisciplinary field, the theory of complex network is gradually infiltrating into biology, sociology and many other subjects [8]. And with the development of X-ray micro area imaging technology, it enables us to recognize and distinguish pore structure of micro and nanometer scale [9]. On this basis, the complex network theory is adopted to show the microscopic topology structure and the robustness of sandstone seepage network to explore microscopic mechanism of seepage phenomenon.
1.1. Network structure description method
Regular network, ER random network and WS small world network are three classical models of describing network structure. Regular network, as shown in Fig. 1(a), in this network degree k (the number of edges connected to the node) of each node is equal, has the smallest average path length (the average shortness distance for all nodes) L=1 in all networks with the same quantity of nodes, and P(k) shows the probability of nodes. In ER random network, as shown in Fig. 1(b), connection probability of two nodes is P whether or not they have a common neighbor node. Most of the node degree is 〈k〉, which represents average value. The degree distribution meets Poisson distribution with high average path length. As transition from rule network to random network, Fig. 1(c) shows the degree of WS small world network. Most nodes are not connected to each other, but different nodes can be arrived through less edge, which also can be approximately expressed by Poisson distribution, especially in the situation with more nodes has less average path length. These models all belong to uniform network models. The empirical study shows that mobile internet, cell metabolism network, Internet network and many other real networks belong to non-uniform network. As a model characterizing the heterogeneous network, the degree of BA scale-free network [10] follows the power-law distribution P(k)≈k-γ without an obvious characteristic value (Fig. 1(d)), where γ is the power exponent, making it highly robust to the random node failure. However, as long as the nodes with biggest jot degree are consciously removed, it will have a great influence on the connectivity of the whole network. The research on the distribution, average path length, robustness and other structural characteristics of sandstone pore network helps to deeply understand the formation and evolution process [11] of seepage network, and provides reference for exploring subsurface fluid reservoir and migration mechanism further.
Fig. 1Network model structure
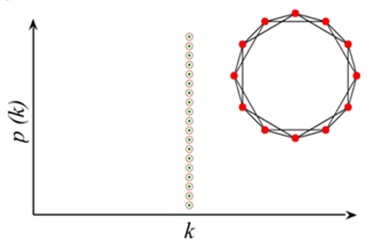
a) Regular network
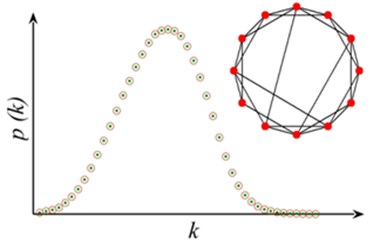
b) Erdős-Rényi random graph
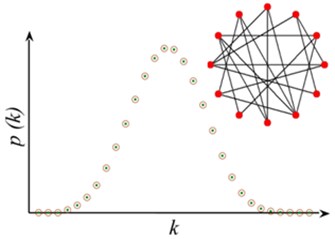
c) WS small world network
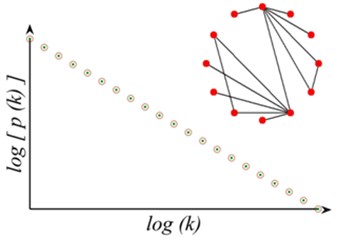
d) BA scale-free network
2. Experimental details
2.1. The production of artificial sandstone core
The original material consists of natural sandstone powder with the granularity is 50 mesh to 300 mesh. The command of sandstone grain size is achieved by different rules of sifter. As resin coated sands, epoxy resin is used to make sand combining better. The matching between sand and epoxy resin is subject to weight ratio.
Evenly keep stirring sandstone and epoxy resin in power mixer for 3 hours. Four-column hydraulic press is used to take compaction process after putting them in models. Hydraulic electric system is controlled by PLC (Programmable Logic Controller). Hydraulic system adopts two-way cartridge valve integrated. All tests are adopted built-in cooling piston technology. Piston guide sleeve and support guide ring set on phosphorous copper to enhance orientation stability. The piston rod electroplating hard chromium with the layer whose thickness is 0.04 mm to 0.05 mm. The column is adopted medium carbon steel after surface hardening treatment with the layer whose thickness is 0.04 mm to 0.05 mm. The kinematic viscosity of hydraulic medium is 45.8 mm2/s with flash point of 240 ℃. The testing pressure is 2 MPa to 10 MPa, and the pressure error is controlled in ±30 KPa. The pressure data aren't used friction correction. Keeping pressure for 24 hours.
After taking out the sample, put it into temperature-controlled instrument fabricated with mirror stainless argon-arc welding of mirror and started the temperature-controlled instrument with 60 ℃. Four hours later, turned up the temperature to 130 ℃ in which the artificial sandstone started to curing, keeping the temperature for 8 hours and controlled the temperature error in ±1 ℃, and the temperature resolution is 0.1 ℃. Adopt microcomputer P.I.D(Proportion Integration Differentiation) of temperature-controlled instrument with the function of over-temperature deviation protection and digital display and adopt the synthetic silicon sealing strip to keep temperature-controlled instrument to run under the high temperature for a long time. Then close temperature-controlled instrument to make temperature in the incubator can be reduced to indoor temperature. The porosity of the artificial sandstone are 12 %, 19 %, 26 % and 33 %.
2.2. X-ray synchrotron radiation image test
XradiaMicro_XCT_200 is used to scan the cylindrical core with the diameter of 25 mm and form the image. X-ray energy generated by bend magnets of advanced photon source. In order to achieve the best penetration rate, adjust the X-ray source voltage to 150 KV and the power to 10 W. The distance between core and rapid CCD (Charge-coupled Device) detector is about 80 mm to 100 mm to meet Fresnel diffraction conditions. Interference fringes of phase boundaries can improve structure sensitivity property of low contrast image. Rotating sample from –180° to 180°, having a data collection of rock core for each spin of 0.18°. The single data acquisition time is 3-5 s, and the effect pixel resolution is 12-14 μm. On the APS computer cluster, use Re-constructor to reconstruct tomography.
2.3. X-ray synchrotron radiation image test
Qualitative and quantitative analysis of element composition in the micro area of artificial sandstone samples, which are tested by Hitachi S-4800 field emission scanning electron microscope are shown in Table 1. The results in Table 1 are the mean values of 16 independent tests.
Table 1Element composition in the micro area of artificial sandstone samples
Element | Weight (%) | Atomic (%) | Compd (%) | Formula |
Na | 0.2 | 0.1 | 0.2 | Na2O |
Al | 5.7 | 4.3 | 10.7 | Al2O3 |
Si | 40.1 | 28.9 | 85.8 | SiO2 |
K | 2.7 | 1.4 | 3.3 | K2O |
O | 51.3 | 65.2 | ||
Totals | 100 | 100 |
3. Results and discussion
Skeleton algorithm is used to make pore as node, and made bottleneck as edge extract pore structure information to set up pore network model [12]. Our imaging technique could not recognize nano-scale pore structure, but through Fig.2 it could still be found that from when porosity is more than 12 %, the pore network has good connectivity.
Fig. 23D sandstone pore networks. (3 mm×3 mm×3 mm)
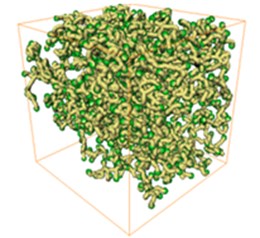
a) Porosity = 12 %
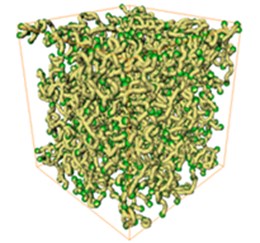
b) Porosity = 19 %
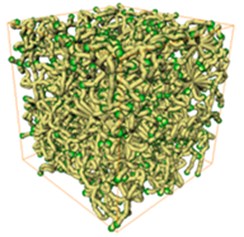
a) Porosity = 26 %
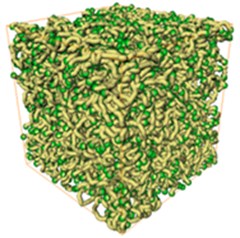
b) Porosity = 33 %
3.1. Pore network extraction
The data information is chosen from cubes of the four porosities of 3 mm by 3 mm by 3 mm. The number of pore (node) extracted by each core is about 6000. In order to consider about seepage network but not the pore network of sandstone, some corrections are made in the automatically generated pore structure. For example, isolated pores which don’t connected with the main network are deleted. Pores with degree of 1 have no function in seepage process, so they are deleted too. Ring-shaped throats are deleted, and made the pore with degree of 2 as a point connected with throat and not separated as a node.
Table 2Basic information of percolation network of artificial sandstone with different porosity
φ (%) | N | d | γ | 〈k〉 | L |
12 | 1898 | 3097 | 5.31 | 3.26 | 22.835 |
19 | 1487 | 2386 | 6.92 | 3.21 | 17.113 |
26 | 1914 | 3267 | 2.73 | 3.42 | 11.299 |
33 | 3323 | 5514 | 3.53 | 3.32 | 14.672 |
3.2. Pore network topology structure
Firstly, distribution function P(k) is adopted to show the distribution situation in node degree of network. P(k) shows the degree of node that randomly selected just is the probability of k. The experimental results show that the different degrees of sandstone porosity seepage network all meet power-law distribution (Fig. 3(a)). So the sandstone seepage network belongs a class of scale-free network, which means there are a small number of nodes with high degree which are called “hub” of the network. In a sense, these nodes may have leading functions in seepage progress [13].
Then the average path distance L of four seepage networks are analyzed (Fig. 3(b)). Consider an unweighed graph G with the set of vertices V. Let d(v1,v2), where v1, v2∈V denote the shortest distance between v1 and v2. Assume that d(v1,v2)=0 if v1=v2 or v2 cannot be reached from v1. Then, the average path length LG is: LG=1N⋅(N-1)⋅∑i,jd(vi,vj), where N is the number of vertices in G. The error is figured by variance formula, d shows the shortest path distance between any two nodes (minimum number of edges connecting any two nodes), and Π is the shortest path distribution. Fig. 3(b) shows that the distribution of the shortest path length between any two points is random. When the porosity ϕ is less than or equal to 26 %, the node number of the percolation is similar, but the average path length is gradually reduced (Table 2). When the porosity is 33 %, the node number of the network is about 2 times of the number of other core nodes, and the average path length is only slightly higher than the porosity of 26 %. It can be speculated that when the network sizes (number of nodes) are similar, the average path length is inversely proportional to the porosity. The average path length in the percolation network is shown as the average value of the shortest throat number in the fluid flowing between any two nodes. The average path of the percolation network is shorter, the connection between the two pores is less, and the easier the fluid flows through the core.
Fig. 3Topology of the seepage networks of sandstone with different porosities
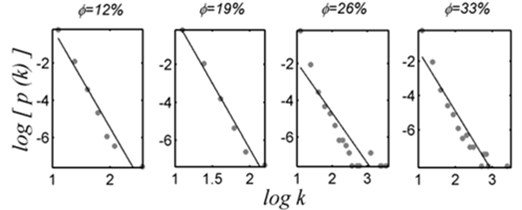
a) Double logarithmic curve of sandstone seepage network degree k distribution
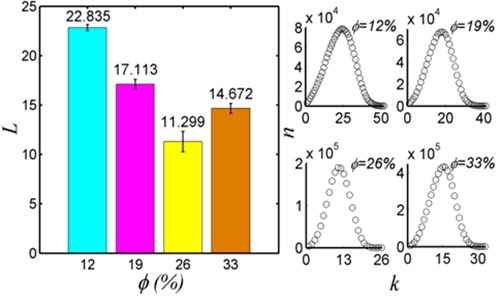
b) Average path distance of sandstone seepage network L
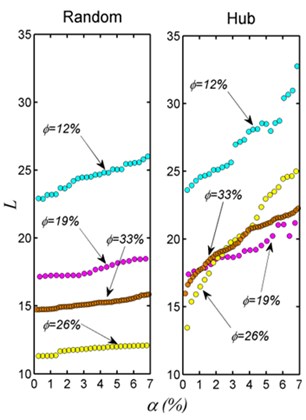
c) The average path length influenced by different node deletion mechanism
Both of improving rate of oil-gas recovery and the change of pore structure under the action of stress refer to the issues that how to effectively control capability of network dissemination. So the robustness features of sandstone seepage networks under the effect of external attack are analyzed. At present, network attack mainly includes two methods: deliberate attacks on the central node and network nodes randomly eliminate [14, 15]. Fig. 3(c) shows that different sandstone porosity seepage networks all present the trend of rapid growth when eliminate degree maximum node in turn, where α is the deleted node number account for the summary points. At the moment, seepage network collapses into several isolated sub-network and loses original connectivity, which indicates that pores with big degree play vital roles in the network. In contrast, when randomly eliminate pore node, though average path distance of seepage network increased, the change is not obvious. Network is able to basically maintain the initial connectivity, which means sandstone seepage network has strong robustness with random attack.
In addition, sandstone seepage networks with different porosities have similar fault-tolerant mechanism for reducing porous. Firstly, sandstone seepage networks have strong robustness with random error, which reflects when the quantity of sandstone randomly reduced, it can better maintain connections of the seepage networks. For instance, the overall seepage ability of pore sandstone has no big changes when solid particle plugging a small amount of connected pores or random reduce of a part of pores caused by ground pressure. Furthermore, consciously eliminate the pores with the biggest degree will impact connectivity. Therefore, it can be predicated that if add the quantity of big degree pore, even the quantity is small, the connectivity of sandstone porous may greatly strengthened, and the permeability may significantly enhanced. Although the quantitative relationships between average path distance and penetration rate are not clear, the conclusion may provide a certain reference of underground energy exploited, pollution sequestration and not rock class porous seepage mechanism explored from a new perspective [16, 17].
4. Conclusions
The topological structure of sandstone seepage network is the result of the interaction of physical and chemical properties of sandstone and external environment. It can be seen from the experiment that the seepage degree of sandstone seepage network with different porosity meets the power-law distribution. In the network connectivity, the nodes with large degree of nodes play an important role. Therefore, scale-free network can reasonably describe the topological structure of sandstone seepage network. This conclusion provides a theoretical basis for establishing a reasonable transport model of complex network of sandstone seepage and simulating the process of sandstone seepage with Boltzmann method.
In addition, the seepage network of sandstone with different porosity has similar fault-tolerant mechanism to reduce the number of pores. Firstly, the sandstone seepage network is robust to random errors. This feature can be used to maintain the connectivity of seepage network when the number of pores in sandstone decreases. For example, when a small amount of connected pores or a small amount of pressure is blocked by solid particles, the porosity of sandstone changes little. Secondly, eliminating pores to the greatest extent will have a great impact on connectivity. Therefore, it can be predicted that if the number of macropores increases, even if the number decreases, it may significantly change the connectivity of sandstone pores, thus greatly improving permeability. Although the quantitative relationship between the average path length and permeability is not clear at present, the conclusion of this paper may provide a new perspective for the analysis of underground energy development, pollutant storage and porous material seepage mechanism.
In the next study, we will build the pore network structure model based on BA scale-free theory in order to analyze the microstructure more accurately and conveniently. At the same time, we will solve the shale gas seepage flow field and pressure field based on the complex network structure model, and discuss the influence of shale pore topological parameters on the seepage characteristics, providing the basis for establishing the accumulation and productivity evaluation system of shale gas reservoirs.
References
-
Arand F., Hesser J. Accurate and efficient maximal ball algorithm for pore network extraction. Computers and Geosciences, Vol. 101, Issue 1, 2017, p. 28-37.
-
Au P., Liu J., Leong Y. Yield stress and microstructure of washed oxide suspensions at the isoelectric point: experimental and model fractal structure. Rheologica Acta, Vol. 55, Issue 10, 2016, p. 847-856.
-
Bauer B., Cai X., Peth S., Schladitz K., et al. Variational-based segmentation of bio-pores in tomographic images. Computers and Geosciences, Vol. 98, Issue 1, 2017, https://doi.org/10.1016/j.cageo.2016.09.013.
-
Blunt M. J., Bijeljic B., Dong H., et al. Pore-scale imaging and modeling. Advances in Water Resources, Vol. 51, Issue 1, 2013, p. 197-216.
-
Ju Y., Wang H., Yang Y. Numerical simulation of mechanisms of deformation, failure and energy dissipation in porous rock media subjected to wave stresses. Science in China Series E-Technological Sciences, Vol. 53, Issue 4, 2010, p. 1098-1113.
-
Liu R., Jiang Y., Li B., et al. A fractal model for characterizing fluid flow in fractured rock masses based on randomly distributed rock fracture. Computers and Geotechnics, Vol. 65, Issue 1, 2015, p. 45-55.
-
Miao T., Cheng S., Chen A., et al. Analysis of axial thermal conductivity of dual-porosity fractal porous media with random fractures. International Journal of Heat and Mass Transfer, Vol. 102, Issue 1, 2016, p. 884-890.
-
Williams R. Methodology or chance? the degree distributions of bipartite ecological networks. PLoS ONE, Vol. 6, Issue 6, 2011, p. e17645.
-
Inokuma Y., Yoshioka S., Ariyoshi J., et al. X-ray analysis on the nanogram tomicrogram scale using porous complexes. Nature, Vol. 495, Issue 7442, 2013, p. 461-466.
-
Takaguchi T., Sato N., Yano K. Importance of individual events in temporal networks. New Journal of Physics, Vol. 14, Issue 9, 2012, p. 2750-2753.
-
Kim H., Anderson R. Temporal node centrality in complex networks. Physical Review E, Vol. 85, Issue 2, 2012, p. 605-624.
-
Zhu W., Gaetani G. A., Fusseis F., et al. Microtomography of partially molten rocks: three-dimensional melt distribution in mantle Peridotite. Science, Vol. 332, Issue 6025, 2011, p. 88-91.
-
Wang W., Tang M., Zhang H. F., et al. Epidemic spreading on complex networks with general degree and weight distributions. Physical Review E, Vol. 90, 4, p. 2014-42803.
-
Vragovic I., Louis E., Guilera A. Efficiency of informational transfer in regular and complex networks. Physical Review E, Vol. 71, Issue 3, 2005, p. 142-154.
-
Albert R., Jeong H., Barabási L. Error and attack tolerance of complex networks. Nature, Vol. 406, Issue 6794, 2000, p. 378-482.
-
Fredrich T., Giovanni D., Noble R. Predicting macroscopic transport properties using microscopic image data. Journal of Geophysical Research, Vol. 111, Issue B3, 2006, p. B03201.
-
Thompson E. Pore-scale modeling of fluid transport in disordered fibrous materials. AIChE Journal, Vol. 48, Issue 7, 2004, p. 1369-1389.
Cited by
About this article
This work was supported by the open fund of Jiangsu Key Laboratory of Coal-based Greenhouse Gas Control and Utilization (Grant No. 2017B06), the Priority Academic Program Development of Jiangsu Higher education Institutions, china scholarship council and the National Natural Science Foundation of China (11202228).

