Abstract
Novel approach to clustering of ECG segments based on Lagrange descriptors is presented in this paper. The approach starts by extracting 2D features with the help of Lagrange descriptors. Then the features are transformed to latent vectors which are clustered using K-means algorithm. The object of the research is to visualize the dynamics of clusters of 2D features of segments of ECG before sudden cardiac death happens to a patient.
1. Introduction
Sudden cardiac death (SCD) is often described as the result of a change of typical sinus rhythm of a heart to a rhythm which does not support adequate pumping of the blood to the brain [1]. A number of techniques were used for predicting SCD and they achieve very different accuracy [2]. Despite the numerous methods and attempts to predict SCD there still exists challenges. Pacemakers and other devices requires high level of accuracy while interacting with human beings. More on these challenges could be found in [3].
Clustering and classification approaches in ECG data analysis is not a new direction [4-6]. But the novelty of this paper arises from the fact that we incorporate here Lagrangian descriptors (LD) as the first step in feature extraction. LD were introduced in [7]. The methodology is able to visualize the structure of a phase space. The method is based on computing the length of the trajectory a particle (trajectory) travels.
Convolutional autoencoder neural network (CNN) is employed here for extracting latent vectors. More on such techniques could be found in [8, 9].
1.1. Data description
In this paper we use Sudden Cardiac Death Database available at PhysioNet [10]. The database contains 23 complete Holter recordings. Each recording comprises 2 time series – two lead ECG. For short description of the data used refer to Table 1.
Table 1ECG data annotations for Sudden Cardiac Death Database
Data file | Gender | Age | Signal duration | Underlying cardiac rhythm |
30m.mat | Male | 43 | 24:33:17 | Sinus |
31m.mat | Female | 72 | 13:58:40 | Sinus |
32m.mat | Unknown | 62 | 24:20:00 | Sinus, intermittent VP |
… | … | … | … | … |
52.mat | Female | 82 | 07:31:05 | Sinus |
We have analyzed each data file of the database but provide results here for the first entry i.e. file “30m.mat”.
1.2. Methodology
Consider ECG signal Xt, t=1,2,…,N. Since the aim here is to investigate the dynamics of extracted features in different segments of ECG, the signal is divided into 5 data sets of equal length: x(q)t=X(q-1)∙⌊N/5⌋+t, t=1,2,…,⌊N/5⌋, q=1,2,…,5. Each segment is investigated separately using the same methodology.
Datasets x(q)t are further divided into a number of non-overlapping vectors y(q,c)i,c=⌊⌊N/5⌋/256⌋, i=1,2,…,256. Now, time embedding is performed for each vector and collection of triples of ECG values are computed: (ui,vi,wi)τ1,τ2:=(y(q,c)i,y(q,c)i+τ1,y(q,c)i+τ1+τ2), τ1,τ2=1,2,…,48, i=1,2,…,166. This is in fact a standard non-uniform time series embedding approach. Thus, the triples obtained could be treated as points of a trajectory in 3D space. Lengths L(τ1,τ2) of the vectors (ui,vi,wi)τ1,τ2 are the simplest LD estimates and are computed by Eq. (1).
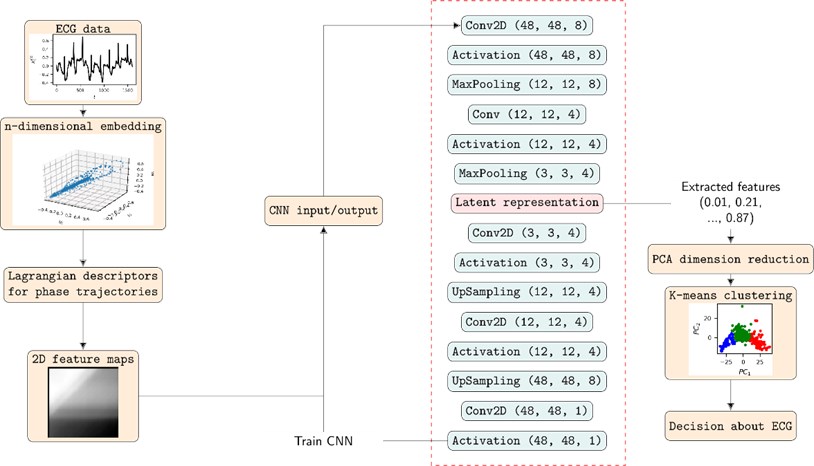
LD estimates are then used for 2D feature computation. We place a dot of grayscale intensity L(τ1,τ2) in the two-dimensional plane at coordinates (τ1,τ2). After considering τ1,τ2=1,2,…,48 two-dimensional features are obtained for ECG segments x(q)t. Clustering of the features is a rather straightforward task. So CNN is employed for extracting second level features – latent vectors. These are later fed to dimensionality reduction by PCA (leaving only 2 components, just for the visualization purposes) and clustered by K-means. Fig. 1 shows full diagram of the methodology proposed for clustering of ECG segments.
Fig. 1Full diagram of the methodology presented in this paper together with the structure of CNN for extracting latent vectors (second level features) from 2D features of ECG
1.3. Numerical experiments
At first 2D feature maps must be computed. Actually, this step of preprocessing implies a very big number of numerical experiments to be carried out. We have used two-dimensional time embedding together with the simplest LD estimate as mentioned before. One can try different dimensions as well as different LD estimates but that would only lead to optimal feature extraction technique and not tell more details about the methodology itself.
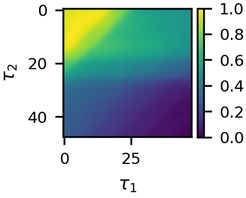
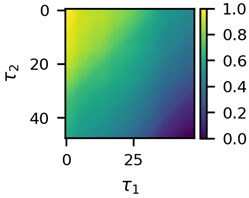
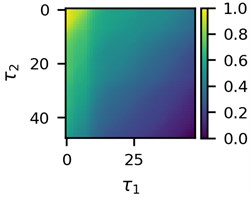
First three 2D feature maps for the first data file and the measurements of the first lead are shown in Fig. 2.
Fig. 2A subset of 2D features of ECG segments before sudden cardiac death for “30m.mat” data file
a)
b)
c)
Visual differences in Fig. 2 implies that clustering of such mages would be a logical step to try to find different clusters for the beginning of the recordings and for the end of the recordings. This is the ultimate goal of the research presented here.
Next, optimal CNN must be trained on the obtained 2D feature maps and latent vectors computed. It should be noted that we linearly transform the values in the maps to the interval [0;1] before applying CNN. For training of CNN we have tested filter sizes 4 and 8, 4 and 8 for number of convolutional filters in the first layer of the network, 2 and 4 for number of filters in the second layer as well as 2 and 4 for parameters in downsampling (MaxPooling) layers. We have used python with keras for training of CNN. Computations took significant amount of time to complete. For that matter cuda hardware acceleration was employed. Training performance was measured by the mean squared error (MSE). Table 2 shows best CNN architectures for the first data file.
Table 2Best CNN architectures for the data file “30m.mat”. Depending on the network parameters the length nlatent of the latent vectors is different. Training and validation sets were selected randomly with ratio 70/30
Data file | Lead | Segment | Conv. dim. | nc1 | nc2 | np1 | np2 | nlatent | MSEtrain | MSEval |
30m.mat | 1 | 1 | 4 | 8 | 4 | 2 | 4 | 144 | 0.0072 | 0.0063 |
30m.mat | 1 | 2 | 8 | 8 | 4 | 2 | 2 | 576 | 0.0074 | 0.0061 |
30m.mat | 1 | 3 | 8 | 8 | 4 | 2 | 4 | 144 | 0.0069 | 0.0056 |
30m.mat | 1 | 4 | 8 | 8 | 4 | 2 | 4 | 144 | 0.0072 | 0.0062 |
30m.mat | 1 | 5 | 8 | 8 | 4 | 4 | 2 | 144 | 0.0075 | 0.0073 |
30m.mat | 2 | 1 | 4 | 8 | 4 | 2 | 2 | 576 | 0.0067 | 0.0060 |
30m.mat | 2 | 2 | 8 | 8 | 4 | 4 | 2 | 144 | 0.0070 | 0.0055 |
30m.mat | 2 | 3 | 4 | 8 | 4 | 2 | 2 | 576 | 0.0063 | 0.0054 |
30m.mat | 2 | 4 | 8 | 8 | 4 | 2 | 2 | 576 | 0.0082 | 0.0055 |
30m.mat | 2 | 5 | 4 | 8 | 4 | 2 | 2 | 576 | 0.0081 | 0.0079 |
Table 2 shows that bigger filter sizes are preferred in terms of MSE. It could be also noted that MSE in validation set is always lower compared to the MSE in the training set. This ensures that there was no overfitting during the training process. Since there are no big differences between the MSEs for different optimal CNN architectures we fix parameters nc1=8, nc2=4, np1=2, np2=2 and 8 as the dimension of convolutional filters for the experiments presented in this paper.
The change in training performance of CNN is depicted in Fig. 3. Note that the plots of training performance for other data files are of almost identical shape.
Fig. 3Training performance of CNN
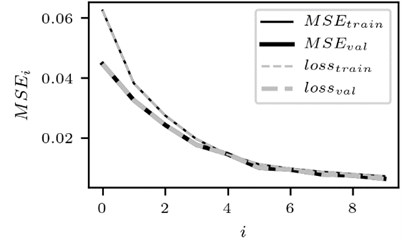
a) The case for the signal of the lead 1
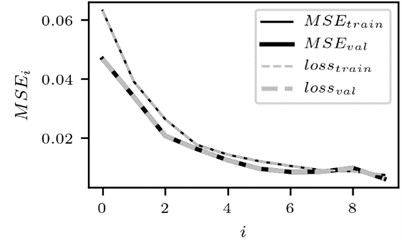
b) The case for lead 2
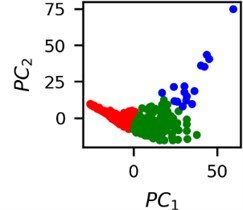
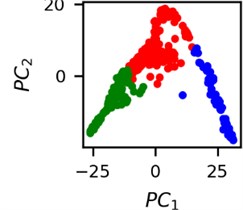
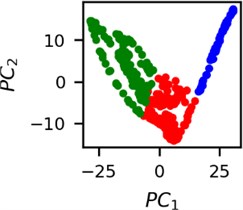
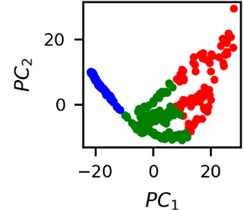
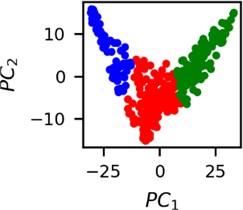
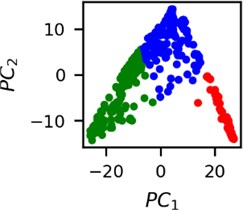
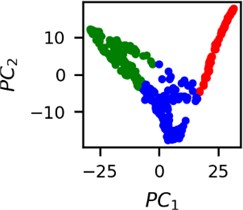
Optimal CNN network was employed and sets of latent vectors were computed for each segment of ECG. Clustering of the latent vectors for the measurements from the first lead from “30m.mat” data file is depicted in Fig. 4.
Fig. 4Clusters of latent vectors corresponding to different segments of ECG before sudden cardiac death (1st lead of the “30m.mat” data file). Colors depict different clusters and are not related in any manner between different parts a) – e)
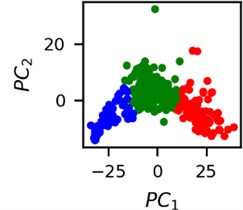
a)
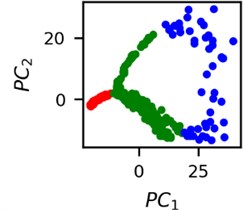
b)
c)
d)
e)
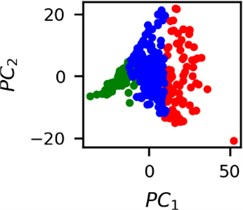
It is known that 2 hours before sudden cardiac death is the time window in which an expert can spot unnatural and potentially risky ECG activity [1]. In Fig. 4 we clearly see that 5 segments during the last 25 minutes have visibly different clusters of latent space vectors. Same applies to the lead 2 (Fig. 5). Unfortunately, the data sets used do not have more measurements which could span more than 2 hours. That would be especially valuable for the validation if the methodology proposed actually signals something unusual before the SCD happens.
Note that shapes of clusters of the vectors of latent space in general have some similar areas between different segments of ECG and even between different data files. This suggests that the proposed methodology might not be completely random. Of course, bigger data sets are required to prove or disprove this.
Fig. 5Clusters of latent vectors corresponding to different segments of ECG before sudden cardiac death (2nd lead of the “30m.mat” data file). Colors depict different clusters and are not related in any manner between different parts a) – e)
a)
b)
c)
d)
e)
2. Conclusions
The main finding of this research is the fact that LD based feature extraction is capable of differently labeling different ECG segments although some similarities also exist.
The methodology is an interesting tool which can be tested for more different CNN parameters, different clustering approaches or different LD estimates. And that is a huge testbed for possible research outcomes which could potentially be an alternative to visual analysis of ECG performed by an expert.
Keeping track of the extracted features in the way showed here could also be considered as a universal tool or even an expert system for anomaly detection in other dynamical systems. One just needs to note cluster centers and/or sizes for the expert system to be completely automated.
References
-
Lerma C., Glass L. Predicting the risk of sudden cardiac death. The Journal of Physiology, Vol. 594, Issue 9, 2016, p. 2445-2458.
-
Goldberger A. L. Nonlinear Dynamics, Fractals, Cardiac Physiology and Sudden Death. Temporal Disorder in Human Oscillatory Systems. Springer, Berlin, Heidelberg, 1987, p. 118-125.
-
Murukesan L., Murugappan M., Iqbal M. Sudden cardiac death prediction using ECG signal derivative (heart rate variability): a review. 9th International Colloquium on Signal Processing and its Applications, 2013, p. 269-274.
-
Abawajy J. H., Kelarev A. V., Chowdhury M. Multistage approach for clustering and classification of ECG data. Computer Methods and Programs in Biomedicine, Vol. 112, Issue 3, 2013, p. 720-730.
-
Zhang C., Wang G., Zhao J., Gao P., Lin J., Yang H. Patient-specific ECG classification based on recurrent neural networks and clustering technique. 13th IASTED International Conference on Biomedical Engineering (BioMed), 2017, p. 63-67.
-
He H., Tan Y. Automatic pattern recognition of ECG signals using entropy-based adaptive dimensionality reduction and clustering. Applied Soft Computing, Vol. 55, 2017, p. 238-252.
-
Mendoza C., Mancho A. M. Hidden geometry of ocean flows. Physical review letters, Vol. 105, Issue 3, 2010, p. 038501.
-
Das D., Ghosh R., Bhowmick B. Deep representation learning characterized by inter-class separation for image clustering. Winter Conference on Applications of Computer Vision (WACV), 2019, p. 628-637.
-
Bhamare D., Suryawanshi P. Review on reliable pattern recognition with machine learning techniques. Fuzzy Information and Engineering, 2019, https://doi.org/10.1080/16168658.2019.1611030.
-
Goldberger A. L., Amaral L. A. N., Glass L., Hausdorff J. M., Ivanov P. Ch., Mark R. G., Mietus J. E., Moody G. B., Peng C-K, Stanley H. E. PhysioBank, PhysioToolkit, and PhysioNet: components of a new research resource for complex physiologic signals. Circulation, Vol. 101, Issue 23, 2000, p. 215-220.
Cited by
About this article
This research was supported by the Research, Development and Innovation Fund of Kaunas University of Technology (project acronym DDetect).

