Abstract
This paper describes a fiber Bragg grating based biaxial accelerometer prototype intended for seismic applications. The work includes the accelerometer structural scheme, optical scheme, sensibility, frequency response and the laser beam deflection method used for calibration. Results of this work show that the device is suitable for seismic measurements because its measurement range goes from 0.5 Hz to more than 20 Hz in frequency and from 0 g to 1.2 g in acceleration amplitude.
1. Introduction
During the last 41 years Mexico City has been affected by dozens of earthquakes and lot of small seismic events [1], furthermore Mexico City has sites considered as lake-bed zones where the seismic waves suffer amplification reaching until an amplification factor of 500 at a frequency range between 0.2 Hz and 0.7 Hz making earthquakes more dangerous than in hill-zones [2].
Because of this, it is necessary to count on reliable accelerometers to measure and register these events to better characterize soil types and to have more stringent structural design.
The seismic waves period in lake-bed zones ranges predominantly between 1 s and 2 s (0.5-1 Hz) and the map of ground motion records shows an amplitude range between 0 g and 1.2 g and a period range between 0.05 s and 5 s (0.2 Hz-20 Hz) [3].
The use of optical accelerometer has been expanded due to its Electromagnetic Interference (EMI) immunity, small size and high sensibility [4].
The previous work puts forward a single axis accelerometer [5] and now it is described the characteristics of a biaxial optical accelerometer based on Fiber Bragg Grating (FBG) which can measure in -axis and -axis making the measurement task cheaper than using two single axis accelerometers, the results show that it meets the requirements to measure seismic waves for the amplitudes and periods mentioned before. The sensibility at 1 Hz in the -axis is 497 µV/g and in the -axis is 275 µV/g (where 1 g = 9.8 m/s2).
2. Accelerometer´s structure and sensing principle
2.1. Accelerometer structural scheme
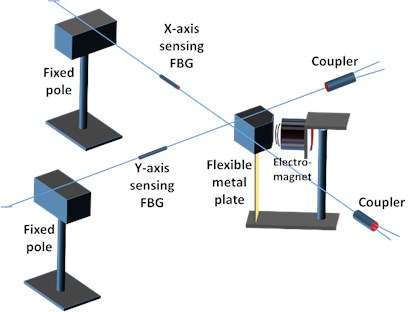
In Fig. 1 can be seen the accelerometer structure in which two FBG are fixed with three clamps between a fixed pole and a flexible metal plate. The clamp on the flexible metal plate fixes one side of each fiber and it is used as prove mass over which an electromagnet induces an attraction force to provoke a strain of the same magnitude in both FBGs, the electromagnet exerts a force forming 45 degrees with the FBGs.
The electromagnet works as if the table over which the accelerometer is on were in movement. A function generator is used to feed the electromagnet with sine waves with variable frequency and voltage.
Fig. 1A schematic diagram of the optical accelerometer
2.2. Accelerometer optical scheme
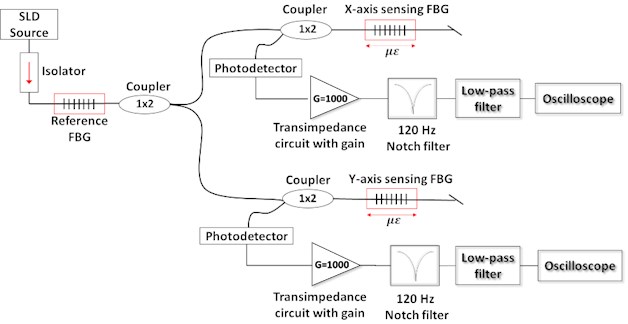
The optical setup for the biaxial accelerometer made in this work is shown in Fig. 2. A superluminescent diode is used as light source and one FBG serves as reference for both sensing FBGs. After, the light without the reference FBG reflection spectrum goes throw a 1×2 coupler and it reaches both sensing FBGs. After that, the -axis sensing FBG reflects one portion of the light which reaches the photodetector, when the sensing FBG is strained, the optical power reflected varies and finally the electrical current that the photodetector gives is converted to voltage, amplified, filtered and shown in an oscilloscope. The same thing happens with the light that reaches to the -axis sensing FBG. The method that use a reference FBG and a sensing FBG is called as reflective-matched fiber Bragg grating sensing interrogation scheme [6] and converts the Bragg wavelength displacement to an optical power change letting us to avoid the use of an interrogator which is expensive and not suitable for in field application where there is only one sensor per station.
Fig. 2Optical scheme of the accelerometer
2.3. Laser beam deflection method
The laser beam deflection method [7] was used to calibrate the optical accelerometer, this method can measure small displacements with high precision. It only needs a laser, a mirror fixed in the clamp that is in movement and a photodetector with a blade covering a half of the photodetector surface [5]. To calculate the displacement corresponding to the voltage given by the photodetector, the geometric arrangement was analyzed.
3. Results
Two tests were carried out to verify the accelerometer characteristics using the diagrams shown in Fig. 1 and Fig. 2.
3.1. Sensitivity
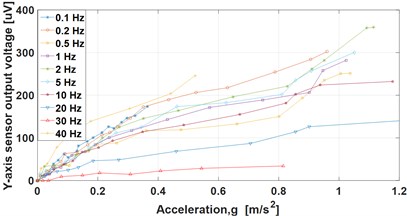
The first test consisted in leaving a fixed frequency and to vary the amplitude of the voltage excitation applied to the electromagnet from 0.1 V to 8.5 V. Using the beam deflection method the acceleration is found and plotted versus -axis output voltage which is the voltage given by the photodetector corresponding to the -axis sensing FBG.
The same test was repeated ten times for the -axis and ten times for the -axis changing the excitation frequency and plotted in Fig. 3 and Fig. 4 respectively.
Fig. 3 and Fig. 4 show a linear response which is desired, the -axis gives a sensibility of 497 µV at 1 Hz and the -axis gives a sensibility of 275 µV at 1 Hz.
Fig. 3X-axis amplitude sensor response
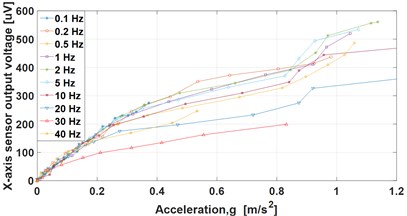
Fig. 4Y-axis amplitude sensor response
3.2. Frequency response
The second test consisted in leaving a fixed electromagnet excitation voltage and to vary the frequency to know the sensor frequency response. The frequency was varied from 0.1 Hz to 110 Hz and the test was repeated for 1 V, 2 V, 3 V and 4 V of excitation. The results are shown in Fig. 5 and Fig. 6.
The resonance frequency is at 47 Hz, the -axis sensor output voltage gives a flat response from 0.1 Hz to 20 Hz, the -axis sensor output voltage does not give a flat response but it gives a slope which can be compensated to obtain a flat response.
Fig. 5X-axis frequency response
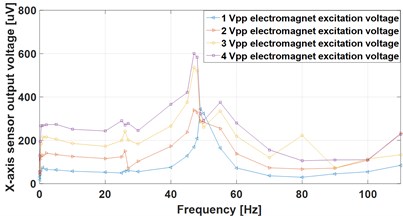
Fig. 6Y-axis frequency response
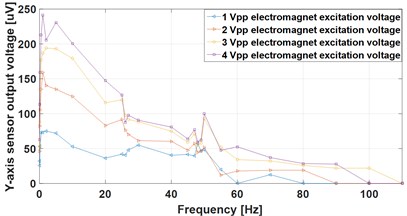
4. Conclusions
The biaxial optical accelerometer described here is appropriated for seismic measurements because the measurement range needed is from 0.2 Hz to 20 Hz in frequency and from 0 g to 1.2 g in acceleration amplitude and the accelerometer presented here can measure in the flat range (or constant sensibility) from 0.2 Hz to 30 Hz in frequency and from 0 g to 1.2 g in amplitude.
The interrogation principle used here is cheap and it uses only one grating as reference instead of two that are normally used for a biaxial sensor.
References
-
Segou M., Parsons T. Testing earthquake links in Mexico from 1978 to the 2017 M = 8.1 Chiapas and M = 7.1 Puebla Shocks. Geophysical Research Letters, Vol. 45, 2018, p. 708-714.
-
Ordaz M., Krishna S. Source spectra and spectral attenuation of seismic waves from Mexican earthquakes, and evidence of amplification in the hill zone of Mexico City. Bulletin of the Seismological Society of America, Vol. 82, Issue 1, 1992, p. 24-43.
-
Galvis F., Miranda E., Heresi P., et al. Preliminary Statistics of Collapsed Buildings in Mexico City in the September 19, 2017 Puebla-Morelos Earthquake. Department of Civil and Environmental Engineering Stanford University, 2017.
-
Weng Y., Qiao X., Guo T., et al. A robust and compact fiber Bragg grating vibration sensor for seismic measurements. IEE Sensors Journal, Vol. 12, Issue 4, 2011, p. 800-804.
-
Pérez-Alonzo A., Sandoval-Romero G. E. Experimental study of a fiber Bragg grating accelerometer for seismic measurement. Vibroengineering Procedia, Vol. 22, 2019, p. 53-56.
-
Lobo A., Ferreira, L., Santos J., Jackson D. Analysis of the reflective-matched fiber Bragg grating sensing interrogation scheme. Applied Optics, Vol. 36, Issue 4, 1997, p. 934-939.
-
Beaulieu L., Godin M., Laroche O., et al. A complete analysis of the laser beam deflection systems used in cantilever-based systems. Ultramicroscopy, Vol. 107, Issues 4-5, 2007, p. 422-430.
About this article
This work was supported by DGAPA-UNAM through financing of Project PAPIIT IT101019.
