Abstract
In terms of resource transportation, pipelines play a very important role, however, it’s leakage is almost inevitable, so leakage monitoring has always been a research hotspot. The leakage identification of water supply pipeline is studied in this paper. The vibration caused by turbulence and cavitation at the leak point has chaotic characteristics, and the spectral distribution of which has its own special area. Chaos can be judged by the Lyapunov exponent, this means that the occurrence of the leak is judged. By this method, the leakage can be effectively identified. The above theory is verified by experiments in this paper.
1. Introduction
In the oil, natural gas transmission, urban water and other pipe network, the condition monitoring of pipelines has always been a problem. The small defects on the pipeline will slowly expand, eventually lead to large leaks and even breaks, which will not only cause economic losses, but also cause environmental pollution problems and serious consequences of harming safety. Take the water supply pipe network as an example, in China, some cities have frequent pipeline leakage accidents due to the overuse of water pipes and unreasonable pipeline design. According to statistics, the average loss rate of urban water supply in China is about 15 %, in some areas, it will even reach 50 % due to the old pipe network [1]. Therefore, it is of great practical to study the detection technology of pipeline leakage.
Common leak identification methods are: listening method, tracer method, pressure/flow detection method, ground penetrating radar detection, infrared detection, pipeline robot inspection, fiber/cable detection method, ultrasonic detection method, leak sound/vibration signal detection method [2], etc. Among them, the correlation detection method based on acoustic vibration signal has become an important method for water supply pipeline leakage detection because of its high ability of identifying and locating leakage.
Majid Ahadi et al. believed that the waveform of the leakage signal has certain regularity, and some fixed waveforms shape can be used for leak identification [3]. Osama Hunaidi et al. analyzed the frequency components of environmental noise and leakage signals through experiments [4]. The results show that the leakage signal’s frequency of the buried plastic pipe is distributed at 5-50 Hz, and the frequency is affected by the pipe diameter and the water pressure inside the pipe. Wan Qin analyzed the spectrum of the signal and identified the pipeline leakage according to the different characteristics of the high frequency band of the power spectrum [5].
Sun Liying decomposed acoustic emission signals by Empirical Mode Decomposition method (EMD), and extracted leakage signal features from the intrinsic mode function (IMF), then reconstructed a signal with these components which contain leak features, and finally used cross-correlation to locate leaks [6]. Tang Xiujia applied the neural network method to pipeline leakage identification [7]. He used signal amplitude, average value, etc. as characteristic quantities to identify whether the pipeline leaked. Wen Yumei et al. used spectral width parameters and approximate entropy in different frequency bands as features into support vector machine (SVM) to judge pipeline leakage under different conditions [8]. Toshitaka and Akira proposed to identify the leakage by combining the SVM with the power spectral density of the leakage signal and the destruction factor based on AR model as the characteristics of the leakage acoustic signal [9].
2. Problem description
Papastefanou et al. observed the state of the leaking water flow from a transparent plastic pipe and analyzed the mechanism of the leakage vibration [10]. They concluded that the vibration on pipe was caused by turbulence at the leakage location, and the rupture of bubbles caused by the cavitation.
Turbulence causes the motion of the fluid micro-elements to appear random within a certain range. In 1971, Ruelle and Takens first proposed the chaotic properties of turbulence [11]. In recent years, more and more studies have shown that turbulence is not a complete random motion, but there is a certain regular orderly motion in random, that is, turbulence meets the definition of chaos. The formation of cavitation bubbles in the low-pressure zones can also be considered as random, and when and where them collapse are random, but cavitation bubble’s collapse has a certain regularity, so the vibration generated by cavitation has both randomness and regularity, which is also consistent with definition of chaos. Zhang Fenghua demonstrated the chaotic phenomenon in cavitation through experiments [12]. Xiong Ping et al. established a mathematical model to verify the chaotic characteristics of bubble vibration [13].
Therefore, it can be considered that the pipeline vibration signal caused by leakage has chaotic characteristics. The maximum Lyapunov exponent can determine whether the sequence is a chaotic system. If the maximum Lyapunov exponent is positive, it means that the system is chaotic, or it is less than zero. This method can identify leaks expediently.
In fact, there are a lot of noise mixed in the actual collected signals. According to Dr. Yang Jin’s research, the autocorrelation function can remove the noise effectively during signal processing [14]. Liu Jingbin used signal’s overall Lyapunov exponent after signal autocorrelation processing as the basis for leakage identification [15], achieved the purpose of leak identification, but using a single Lyapunov exponent leads to a high false positive rate. According to the experimental results of Osama Hunaidi [4], the vibration of the leak is only distributed in a certain frequency band. Similarly, Wang Guoyu et al. found that the vibration frequency of cavitation collapse was between 10 k and 23 kHz, and which had an obvious center frequency [16], which also proved that the vibration caused by cavitation was relatively concentrated within a certain range. Therefore, it is more valuable to study leakage signals in different frequency bands.
3. Leak identification based on Lyapunov exponent of different frequency bands
The signal processing process in this paper is shown in Fig. 1. First, the collected signal is band-pass filtered, and the signal is divided into 8 segments of equal bandwidth. Then, the autocorrelation calculation is performed on each segment of the signal to denoise. Finally, the maximum Lyapunov exponent of each frequency band is calculated. Leak can be identified by analyzing the maximum Lyapunov exponent spectrum.
Fig. 1Flowchart of signal processing

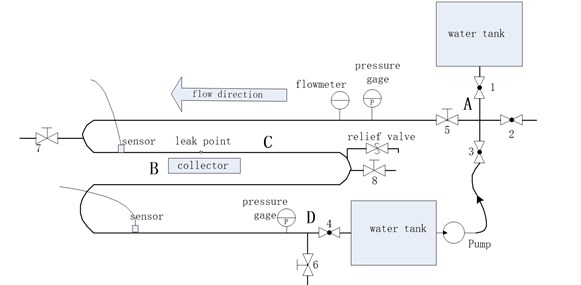
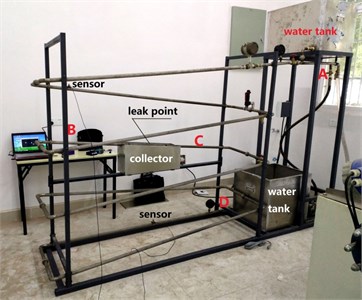
In order to verify the correctness of the above theory, a leaking pipe test platform is built in the laboratory. Fig. 2 shows the piping system design, and Fig. 3 shows the real picture of the system.
Fig. 2Flowchart of signal processing

Fig. 3The real picture of the piping system

The main road is the section AD, it’s total length is 20 meters, and the flow direction of the water is from A to D during the experiment. The section BC is a detachable pipe section, which can be changed with a good pipe or a leaky pipe. In this experiment, piezoelectric acceleration sensors were placed in different locations of the pipe to acquire the leakage signals. Experimented with leaky and leak-free pipes respectively, and adjusted the pressure inside the tube, artificially made noise, etc. By the method calculated the maximum Lyapunov exponents of different frequency bands, and the obtained data is shown in table 1, where 1, 2, 3 are the environmental noise: footstep, speak and machine running, number 4, 5, 6 represent leak in these noise, number 7, 8 are leak without noise.
Table 1The maximum Lyapunov exponents of different frequency bands
Serial number | The maximum Lyapunov exponents of different frequency bands | |||||||
1 | 0.02433 | 4.45e-07 | 5.07e-06 | 1.4e-06 | 2.31e-06 | 1.47e-06 | 3.85e-07 | 7.77e-06 |
2 | –324.154 | 0.000198 | 0.000861 | 0.000204 | 0.000838 | 0.00232 | 8.98e-05 | 0.000962 |
3 | 0.014014 | 1.64e-06 | 1.76e-06 | 2.93e-07 | 2.73e-06 | 2.74e-06 | 1.75e-06 | 1.69e-05 |
4 | 0.066347 | 0.02278 | 0.026403 | 0.017647 | 0.001948 | 0.003033 | 0.000859 | 0.00555 |
5 | 0.015389 | 0.004879 | 0.041438 | 0.021207 | 0.006009 | 0.009685 | 0.006443 | 0.072014 |
6 | –0.17084 | 0.087524 | 0.00844 | 0.011067 | 0.000916 | 0.015942 | 0.003567 | 0.001337 |
7 | 0.010838 | 0.002559 | 0.001827 | 0.004905 | 0.008951 | 0.0309 | 0.008779 | 0.004115 |
8 | 0.020522 | 0.025068 | 0.126072 | 0.090662 | 0.012269 | 0.049284 | 0.000729 | 0.001097 |
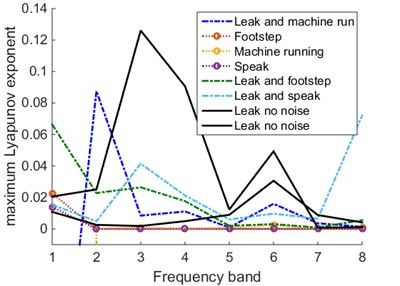
As shown in Fig. 4, drawing the data in table 1 can more clearly identify the leak, from the figure, the maximum Lyapunov exponent of the ambient noise is small, close to 0 or negative, in all frequencies, but the situation leakage with strong background noise is completely different, which has larger Lyapunov exponent in several frequencies, similar to situation of leakage without noise. Leakage can be identified by applying simple statistical methods for Lyapunov exponent, in this paper, a three-layer neural network system is applied, train the system with 50 sets of data collected, the accuracy rate of leak identification can be higher.
Fig. 4Signals’ Lyapunov exponent spectrum under different conditions

4. Conclusions
According to the reason that the vibration frequency of turbulence and cavitation at the leakage of water supply pipeline is within a certain range and has chaotic characteristics, Use the maximum Lyapunov exponents of different frequency bands as the leak identification feature in this paper. This method can effectively identify leaks.
References
-
Shu Xutong, Qian Qi, Cao Jinqing Analysis of unmeasured water and leakage of urban water supply in China. National Pipeline Leakage Control Seminar. 2001.
-
Colombo A. F., Lee P., Karney B. W. A selective literature review of transient-based leak detection methods. Journal of Hydro-environment Research, Vol. 2, Issue 4, 2009, p. 212-227.
-
Ahadi M., Bakhtiar M. S. Leak detection in water-filled plastic pipes through the application of tuned wavelet transforms to acoustic emission signals. Applied Acoustics, Vol. 71, Issue 7, 2010, p. 634-639.
-
Osama Hunaidi, Wing Chu T. Acoustical characteristics of leak signals in plastic water distribution pipes. Applied Acoustics, Vol. 58, 1999, p. 235-254.
-
Wan Qin, Koch Daniel Multichannel spectral analysis for tube leak detection. Proceedings of Southeastcon, 1993.
-
Sun Liying, et al. Acoustic emission signal processing method based on wavelet package and HHT transform. Chinese Journal of Scientific Instrument, Vol. 29, Issue 8, 2008, p. 1-1.
-
Tang Xiujia, et al. Water pipelines leak detection and location method and instrument. Journal of Hydraulic Engineering, Vol. 3, 1997, p. 19-26.
-
Wen Yumei, et al. Identification of water pipeline leakage based on acoustic signal frequency distribution and complexity. Chinese Journal of Scientific Instrument, Vol. 35, Issue 6, 2014.
-
Thompson M., Chapman C. J., Howison S. D., et al. Noise generation by water pipe leaks. 40th European Study Group with Industry, Keele, 2001.
-
Papastefanou A. S., Joseph P. F., Brennan M. J. Experimental investigation into the characteristics of in-pipe leak noise in plastic water filled pipes. Acta Acustica United with Acustica, Vol. 98, Issue 6, 2012, p. 847-856.
-
Ruelle D., Takens F. On the nature of turbulence. Communications in Mathematical Physics, Vol. 20, Issue 3, 1971, p. 167-192.
-
Zhang Fenghua, Liao Zhenfang, Tang Chuanlin Numerical study on nonlinear dynamics of cavitation motion. Journal of Chongqing University (Natural Science), Vol. 24, Issue 4, 2001.
-
Xiong Ping, et al. Research on application of chaos characteristic of non-ideal bubble. Ship Science and Technology, Vol. 32, Issue 9, 2010, p. 91-94.
-
Yang Jin, Wen Yumei, Li Ping Feature extraction and identification of leak acoustic signal in water distribution pipelines using correlation analysis and approximate entropy. Chinese Journal of Scientific Instrument, Vol. 30, Issue 2, 2009, p. 272-279.
-
Jingbin Liu, Ji Wang, Shuyong Liu, Xuanyan Qian Feature extraction and identification of leak acoustic signal in water supply pipelines using correlation analysis and Lyapunov exponent. Vibroengineering Procedia, Vol. 19, 2018, p. 182-187.
-
Wang Guoyu, Cao Shuliang, Zhao Lingjia, et al. Study on vibration and erosion induced by vortex cavitation around a hollow-jet valve. Journal of Engineering Thermophysics, Vol. 23, Issue 6, 2002, p. 707-710.
About this article
The research is support by the University Scientific Foundation (425517 K143).

