Abstract
This paper proposes the Taguchi based optimization technique for the production of biodiesel from palm oil. For this purpose, L9 orthogonal array was successfully used for better yield estimation by using Minitab-18 software. Different process variables like molar ratio, catalyst concentration, reaction time and reaction temperature were studied. A predicted yield of 92.06 % was achieved by regression analysis by maintaining the process variables of molar ratio 5:1 (methanol to oil), 4 grams of catalyst concentration (NaOH), 180 minutes of reaction time and 44°C of reaction temperature. Experimentations were conducted on the same process variables and achieved a yield of 91.65 %. By this it is clear that both experimentation and regression analysis by Taguchi are in good agreement with an error of 0.41 % which may be acclaimed as experimental error. The fatty acid compositions (FAC) were also analyzed and it is found that 37.12 % saturated and 62.88 % unsaturated fatty acids present in the palm methyl ester (PME). By using the FAC of PME the Cetane number was predicted as 55.38. The predicted Cetane number from FAC tally with experimental Cetane number. The PME is characterized for different fuel properties by following the international standards. And it is concluded that catalyst concentration and reaction temperature are the important parameters which influence PME yield, Taguchi based optimization technique will helps in predicting the maximum yield with minimum number of experiments.
Highlights
- Transesterification of palm methyl ester
- Taguchi based optimization technique
- Fatty acid compositions by gas chromatography
- Prediction of cetane number by fatty acid compositions
- Molar ratio (MR), Catalyst Concentration (CC), Reaction Time (RTi) and Temperature (RTe)
1. Introduction
The concept of using vegetable oils as a fuel in diesel engines is not a new invention. The inventor of diesel engine Rudolf Diesel (1890) used different variety of fuels which includes vegetable oil also. The high viscosity of the vegetable oils can be reduced by splitting of fatty acids from glycerin was initiated in early 1930s. In 1937, G. Chavanne was granted a Belgian patent for an ethyl ester of palm oil (Biodiesel). In 1938, a passenger bus fueled with palm oil ethyl ester plied the route between Brussels and Louvain [1, 2]. The word “Biodiesel” was probably first used in 1984 [2]. The first biodiesel manufacturing plant specifically designed to produce fuel was started in 1985 at an agricultural college in Austria. Since 1992, biodiesel has been commercially manufactured across Europe, with Germany being the largest producer [3].
Earlier, petroleum products are cheaper therefore much attention is payed on it. At present the scenario has totally changed, fossil fuels are in a verge of depletion and their cost is also increasing. Apart from their availability and cost the exhaust emissions from petroleum product fueled engines are at alarming state. World Health Organization (WHO) has released a list of most polluted cities around the word in that eleven out of twelve most polluted cities were in India. Diesel engines are one of the contributors for the increase of air pollution levels in the country. Now it is a thinking stream to regulate these exhaust emissions. Among the various option’s available biodiesel from vegetable and animal fats are the most suitable to replace the diesel fuel [4].
Biodiesel, a promising renewable, alternative fuel for diesel fuel. The potential advantages of using biodiesel are: It reduces the exhaust emissions like unburnt hydrocarbons (HC), Oxides of nitrogen (NOx), Carbon monoxide (CO), Carbon dioxide (CO2), Particulate matter (PM), smoke and etc. It also acts as a best lubricant and the presence of molecular oxygen (6 %) helps to improve the combustion by reducing the exhaust emissions to a greater extent. Biodiesel from different feed stocks of edible, nonedible and animal fats are gaining more importance as an alternative fuel [5-7].
Researchers and demonstrated experiments reveal that biodiesel can be used as an alternative fuel to diesel fuel without changing the basic design of the engine [8-10]. Developed countries have already implemented the alternative fuel technology for exhaust emission reduction. countries like in India, it is in a progressive stage and inclining towards the fuel refinement by introducing stringent emission norms of Bharath Stage (BS). At present BS-IV which is equivalent to International standards (Euro-IV) is implemented all over the country. Govt of Indian has already passed a rule that by the year 2020 BS-VI emission norms has to implement throughout the country Table 1 refers the latest emission norms implementing in the country.
In India, there are different potential feedstocks for biodiesel production since the climatic conditions are favorable for the cultivation for different oil plants. Which will generate the income, employment and at the same time reduce the reliance on foreign oil products. More than 35 million tons of oils like jatropha, pongamia, mahuava, neem, rubber seed oil and etc., are produced in India every year [11].
By considering the above factors in this research an attempt was made on optimization of biodiesel production from palm oil. Optimization techniques helps in reducing the experimental cost and gives the better results. In this research Taguchi based optimization technique is followed to determine the different key parameters like molar ratio, catalyst concentration, reaction time, temperature and their influence on the biodiesel yield.
Table 1Bharat emission norms as per international euro standards (g/km)
S. No. | Bharat emissions | International | Year | CO | NOx | HC+NOx | PM |
1 | Bharat stage-I | Euro-I | 2000 | 2.72 | – | 0.97 | 0.14 |
2 | Bharat stage-II | Euro-II | 2001 | 1.0 | – | 0.7 | 0.08 |
3 | Bharat stage-III | Euro-III | 2005 | 0.64 | 0.5 | 0.56 | 0.05 |
4 | Bharath stage-IV | Euro-IV | 2010 | 0.5 | 0.25 | 0.30 | 0.025 |
5 | Bharath stage-VI | Euro-VI | 2020 | 0.5 | 0.080 | 0.170 | 0.005 |
2. Materials and methods
2.1. Materials and equipment’s used
Refined Palm oil was purchased from Ruchi Soya Industries Ltd. Pure Methanol (CH3OH 99 % Pure), Sodium hydroxide pellets (NaOH 85 % Pure) were purchased from the Sigma-Aldrich Chemicals Ltd. The experimental setup consists of thermometer, magnetic stirrer with temperature and speed controller, separating funnel, conical and glass beakers of Borosil make were used for transesterification of methyl esters.
2.2. Transesterification
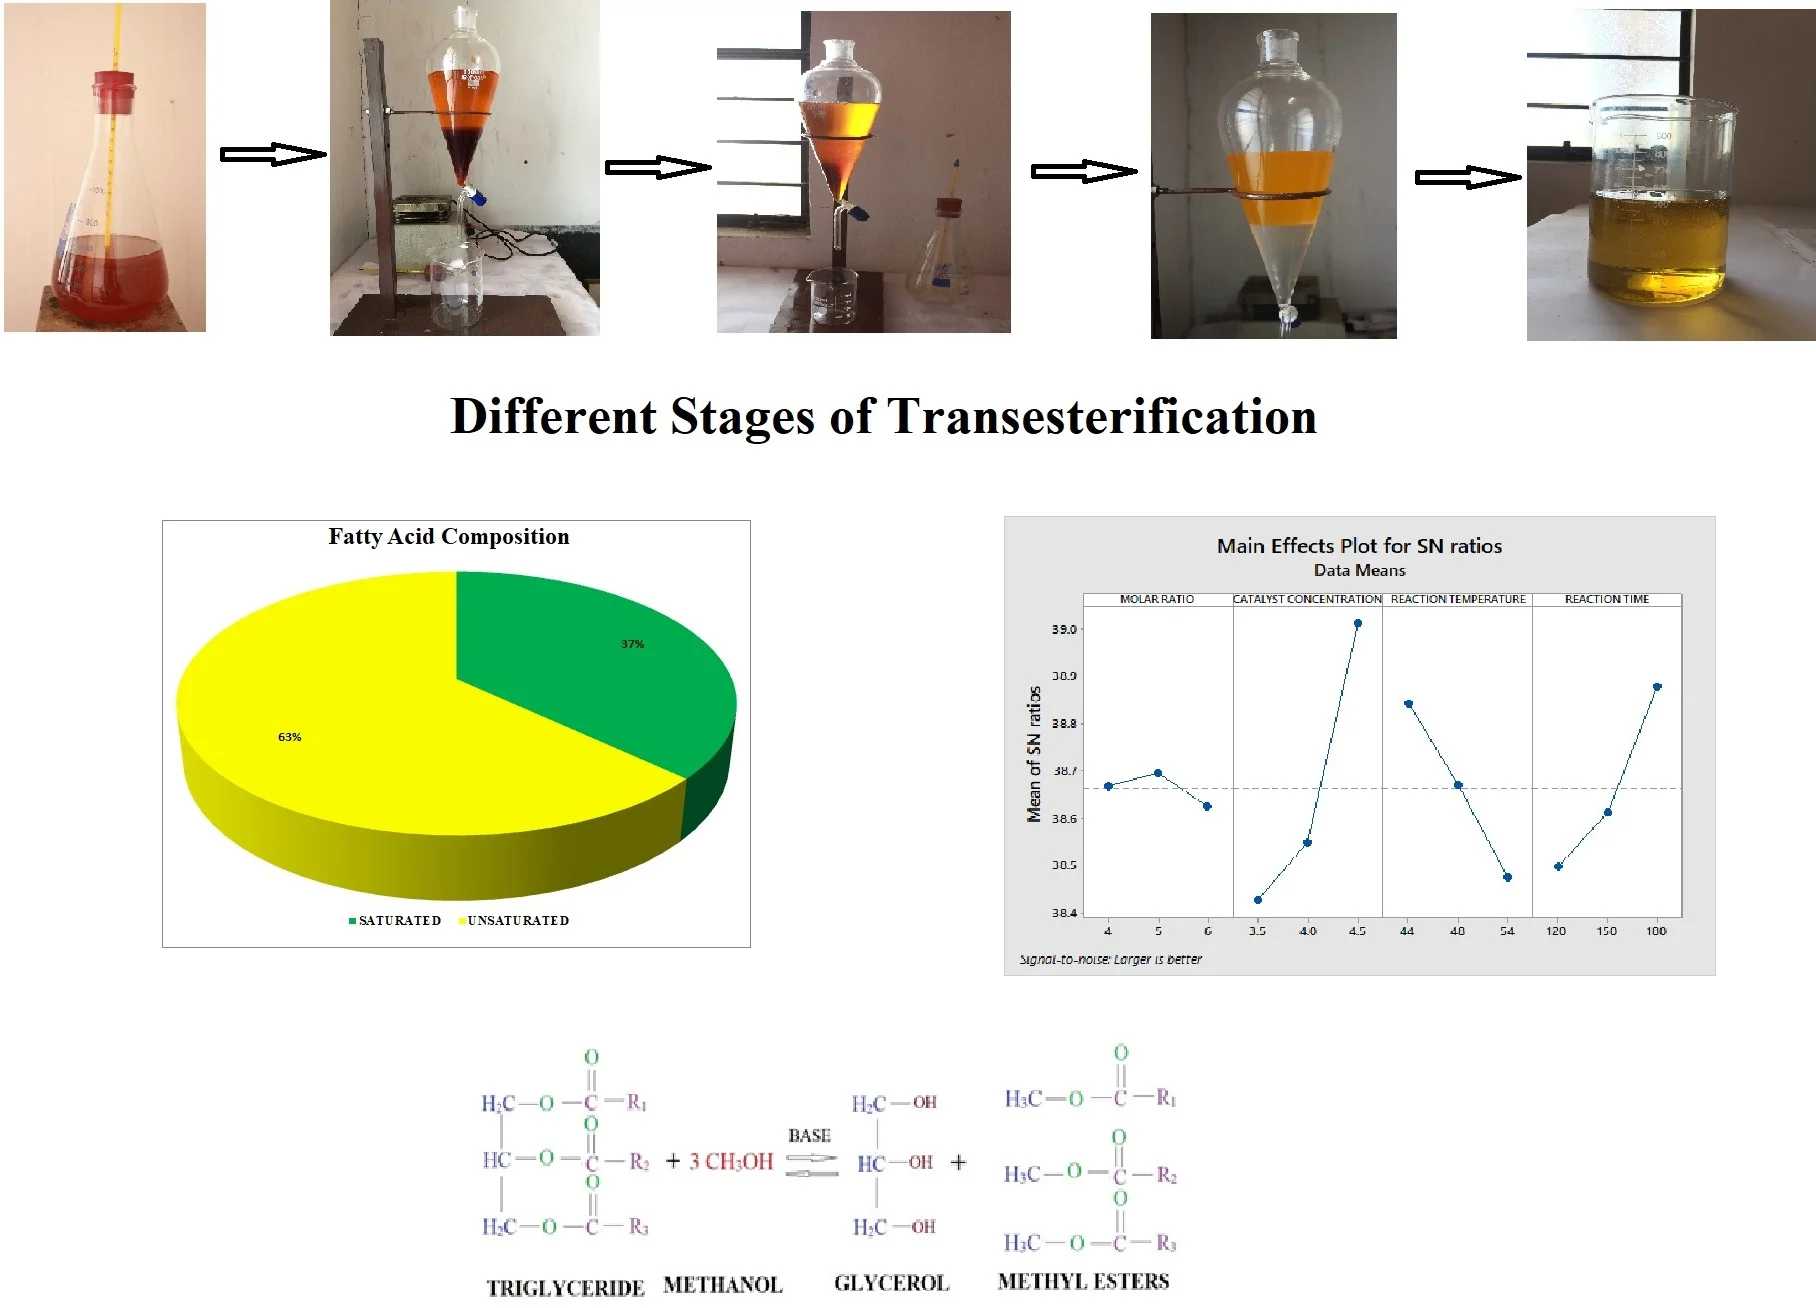
Raw oil is heated and filtered with surgical cotton to remove water molecules and suspended traces. Purified raw oil of measured quantity is heated up to 40°C with the help of a magnetic stirrer (reactor). Methanol (CH3OH) added in Sodium hydroxide pellets (NaOH) formed as methoxide solution of required quantity is mixed with the raw oil. Proper care is to be taken while preparing the methoxide solution. If any undissolved sodium hydroxide pellets in methanol will lead to formation of soap. The mixture is stirred continuously for a time period by maintaining the 55 °C temperature. The temperature of the mixture should not exceed 62 °C this may result in the escaping of methanol and lead to incomplete reaction. After the desired reaction time and temperature, the glycerin will form. The high-density glycerin will settle in the bottom of the separating funnel. The glycerin is removed, and methyl ester is washed thoroughly with distilled water to remove the acids present in it. The water wash is repeated until a clear separation of methyl ester and oil. Fig. 1 represents the different stages of transesterification process and Fig. 2 represents the mechanism of transesterification process. The finally obtained palm methyl ester (PME) is tested for different physicochemical properties. The maximum percentage of PME yield was calculated by the formula as represented in the Eq. (1):
For the better yield of methyl esters there are four parameters which influence the maximum yield are methanol to oil ratio, catalytic concentration, reaction temperature and time. Taguchi based optimization technique is applied in this transesterification process by varying the above parameters.
Fig. 1Transesterification flow chart
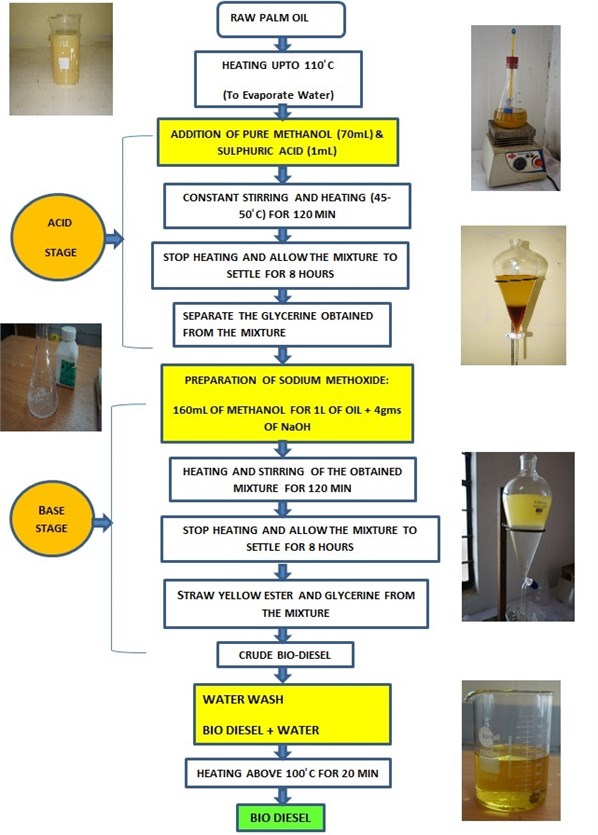
Fig. 2Transesterification mechanism

2.3. Characterization
The obtained methyl esters were tested for different properties by following international standards. Table 2 represents the different property, equipment’s used and their standards for palm methyl ester and diesel.
Table 2Characteristics of PME in comparison with diesel
S. No. | Property | Diesel | PME | Standards |
1 | Density (kg/m3) | 853.97 | 864.42 | ASTM-D1298 |
2 | Viscosity (mm2/s) | 4.33 | 4.71 | ASTM-D445 |
3 | Flash point (°C) | 64 | 196 | ASTM-D93 |
4 | Pour point (°C) | –4 | 11 | ASTM-D97 |
5 | Calorific Value (MJ/kg) | 42-46 | 37.27 | ASTM-D240 |
6 | Cetane Number | 47.5 | 55.38 | ASTM-D613 |
7 | Cloud Point (°C) | –5.0 | 16.0 | ASME-D2500 |
8 | Cold Filter Plugging Point (°C) | –6.0 | 12.0 | ASME-D6371 |
2.4. Design of experiments
There are many factors which influence the biodiesel yield out of many molar ratio (methanol to oil ratio), catalytic concentration, reaction time and temperature are of most significant. In this research an attempt was made to analyze these parameters to achieve the maximum biodiesel yield. Dr. Taguchi has introduced the statistical technique to analyze the different parameters which influence the process conditions. By implementing these techniques can reducing the experimental cost with minimum number of experiments. This technique uses orthogonal array for designing the experiments and it can predict the important influencing parameters for biodiesel yield. In the present analysis L9 orthogonal array is chosen for optimization of PME. Eq. (2) represents the number of experimentations that has to carried out and it is clear that number of experimental runs depend upon chosen level and number of factors. From the equation it is found that there are Nine set of experiments that has to conduct in order to calculate response parameters:
where: represents the chosen level, – the number of factors.
3. Results and discussions
3.1. Fatty acid compositions
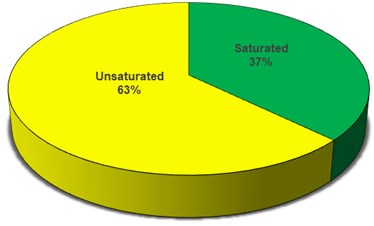
Fatty acid compositions play a vital role during the combustion in the combustion chamber. In general, these fatty acids are mainly divided into two major categories, one is saturated fatty acids and another is unsaturated fatty acids, unsaturated fatty acids further divided as mono and poly unsaturated fatty acids. The exhaust emissions like unburnt HC, NOx, smoke and etc. will depends on the fatty acid composition present in the biodiesel. If the presence of excess linoleic fatty acid in the biodiesel may lead to formation of NOx and exhibits low thermal efficiencies [12, 13]. And it also difficult to convert the raw oil into methyl ester if the presence of free fatty acids (FFA) more than 2.5 %. Table 3 represents the different fatty acid composition of PME and Fig. 3 represents the contribution of saturated and unsaturated fatty acids in PME.
Table 3Fatty acid composition of Palm methyl ester (PME)
S. No. | FAC of PME | Wt (%) |
1 | Lauric | 0.1 |
2 | Myristic | 1.06 |
3 | Palmitic | 35.52 |
4 | Stearic | 0.04 |
5 | Palmitoleic | 0.4 |
6 | Oleic | 35.67 |
7 | Linoleic | 14.52 |
8 | Linolenic | 12.69 |
Fig. 3Saturated and unsaturated contribution of PME
3.2. Prediction of Cetane number (CN) using fatty acid compositions (FAC)
The quality of combustion depends on the quality of the fuel, Cetane number (CN) is known for the diesel quality index. In general, the CN for biodiesel is always greater than the conventional diesel fuel. The cost involved in determining the CN through experimental approach is high and sometimes even less accurate due to the experimental errors. In order to overcome the experimental cost and errors different methods have been proposed to predict the CN. Van Gerpen [14] tested the CN of soybean biodiesel and concluded that CN is depends on the distribution of fatty acid composition (FAC) in the oil. The CN is more in saturated FAC, less in unsaturated FAC and moderate in mono unsaturated FAC [15]. A. I. Bamgboye [16] suggested that, with the FAC it is possible to predict the CN. Eq. (3) represent the relation between biodiesel FAC and CN. From the FAC of PME the predicted CN is 55.38 and by experimental approach [17] the CN is 54 [16]:
where , , , , , , , , are constants taken from regression analysis and to are the % of FAC:
where to were taken from the Table 2.
3.3. Optimization by Taguchi
The main objective of the present analysis is to maximize the PME yield, for this purpose Taguchi based optimization technique was adapted. Initially a nine set of experiments were performed, and yield percentages were calculated for each case by varying the four different parameters of molar ratio, catalyst concentration, reaction time and temperature. The obtained experimental results were furnished in Minitab software and analyzed for larger the best (Eq. (4)). Table 4 represents the different parameters which are varied at three levels. Table 5 represents the PME yield and signal to noise ratio level (SNRL) for nine set of experiments:
where:
Table 4Parameters at three different levels
S. No. | Parameters | Level-1 | Level-2 | Level-3 |
1 | Molar ratio (methanol to oil ratio) | 4 | 5 | 6 |
2 | Catalyst concentration | 3.5 | 4 | 4.5 |
3 | Reaction time | 170 | 200 | 220 |
4 | Reaction temperature | 40 | 43 | 45 |
Table 5Orthogonal array for DOE with different parameters
S. No. | Molar ratio | Catalyst concentration (wt %) | Reaction time (min) | Reaction temperature (°C) | Yield (wt %) | SNRL |
1 | 4 | 3.5 | 120 | 44 | 83.64 | 38.44 |
2 | 4 | 4.0 | 150 | 48 | 84.25 | 38.67 |
3 | 4 | 4.5 | 180 | 54 | 89.60 | 38.70 |
4 | 5 | 3.5 | 150 | 54 | 81.49 | 38.89 |
5 | 5 | 4.0 | 180 | 44 | 88.90 | 38.19 |
6 | 5 | 4.5 | 120 | 48 | 87.98 | 38.70 |
7 | 6 | 3.5 | 180 | 48 | 85.20 | 38.58 |
8 | 6 | 4.0 | 120 | 54 | 80.88 | 39.01 |
9 | 6 | 4.5 | 150 | 44 | 90.21 | 38.49 |
Table 6 represents the catalyst concentration, molar ratio and reaction temperatures for different levels. Here the SNRL represents the algebraic mean of particular parameter at that level. The delta represents the difference in maximum and minimum values of particular parameters, based on the higher and lower values of delta, the ranks were assigned. Catalyst concentration is ranked as one and it is determined as influencing parameter for the PME yield.
Table 6Response table for signal to noise ratios (larger is better)
Level | Reaction time (RTi) | Catalyst concentration (CC) | Molar ratio (MR) | Reaction temperature (RTe) |
1 | 38.43 | 38.65 | 38.50 | 38.84 |
2 | 38.55 | 38.70 | 38.61 | 38.67 |
3 | 38.99 | 38.62 | 38.86 | 38.46 |
Delta | 0.57 | 0.07 | 0.36 | 0.39 |
Rank | 1 | 4 | 3 | 2 |
3.4. Analysis of variance
The signal to noise ratio (SNR) represents the ratio of mean value of biodiesel yield to standard deviation. SNR helps in predicting the optimum level of parameters with respect to optimum conditions to maximize the biodiesel yield. The exact parameter which influence the biodiesel yield at that particular condition is unable to predict by using SNR. Hence, a statistical analysis of variation is used for the biodiesel yield (ANOVA). In the present analysis ANOVA test is used for the prediction of PME and also the different parameters that influence the PME yield. Table 7 represents the different process parameters for and values. The percentage of contribution was also calculated by the contribution factor formula as shown in the Eq. (5). Higher the value represents the significant parameter in the preparation of methyl esters and its yield. The Contribution factor will also revel the significant process parameter but this value give the reconfirmation. From the Table 5 the maximum value (28.86) and the corresponding low value (0.006) are significant:
where:
represents the sum of the squares for the th parameter, represents the total sum of the squares of all parameters, is the number of experiments at level of factor .
Table 7Analysis of variance for different process parameters
S. No. | Source | DF | Adj SS | Adj MS | value | value |
1 | Regression | 4 | 87.6484 | 21.9121 | 13.35 | 0.014 |
2 | Molar ratio | 1 | 0.0600 | 0.0600 | 0.04 | 0.858 |
3 | Catalyst concentration | 1 | 47.3766 | 47.3766 | 28.86 | 0.006 |
4 | Reaction time | 1 | 18.7267 | 18.7267 | 11.41 | 0.028 |
5 | Reaction temperature | 1 | 21.4851 | 21.4851 | 13.09 | 0.022 |
3.5. Signal to noise ratio (SNR)
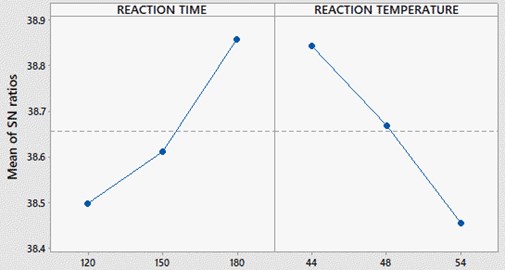
Fig. 4, 5 represents variations of molar ratio, catalyst concentration, reaction time and temperature of the reaction in terms of signal to noise ratio. The maximum value in each parameter represents the optimum level for PME yield. Therefore, at molar ratio of 5:1, catalyst concentration of 4.0 grams, reaction time of 180 minutes and temperature of 44°C gives the maximum yield for PME.
Fig. 4SNR plot for molar ratio and catalyst concentration
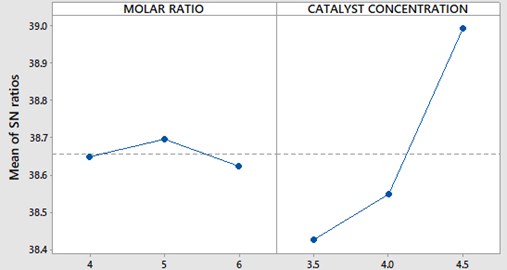
Fig. 5SNR plot for reaction time and temperature
3.6. Regression equation
The optimum yield of PME is calculated by using the regression equation. From the SNR graphs the optimum value of each parameter for the maximum yield are obtained. By substituting these optimum values in the regression equation, the optimum yield value is 92.06 %.
Yield = 73.21 – 0.100 (Molar ratio) + 5.62 (Catalyst Concentration) + 0.0589 (Reaction time) – 0.376 (Reaction Temperature) = 92.06 %.
The optimum values from SNR plots of molar ratio (5:1), catalyst concentration Eq. (4), reaction time (180 min) and reaction temperature (44 °C) were considered for experimentation. By following these conditions, the experimentation is performed and for better accuracy the experimentation is repeated for three trails, the average of three experimental yield is 91.65 % as shown in the Table 8.
Table 8Experimental response of yield percentage
S. No. | Trails | Yield (%) |
1 | 1 | 91.25 |
2 | 2 | 92.01 |
3 | 3 | 91.69 |
4 | Average | 91.65 |
4. Conclusions
Based on the optimization and their experimental validation the following conclusions are illustrated:
1) To maximize the palm biodiesel yield with minimum number of experiments a Taguchi based optimization technique was proposed. In this, four process parameters of Catalyst concentration, methanol to oil ratio, reaction time and temperature were analyzed.
2) The process variables were optimized by using statistical techniques of L9 orthogonal array and analysis of variance (ANOVA). The optimum values of process variables were: 5:1 molar ratio, 4 grams of catalyst concentration, 180 minutes of reaction time and 44 °C of reaction temperature.
3) The maximum yield from regression analysis is 92.06 % and by experimentation it is 91.65 % and an error of 0.41 % which is acclaimed to experimental error and it may be accepted.
The combustion propensity will depend on the fatty acid compositions present in the biodiesel. Therefore, fatty acid compositions were analyzed by Gas Chromatography and it is found that 37.12 % saturated and 62.88 % unsaturated fatty acids were present in the palm biodiesel.
4) Cetane number of the fuel revels the combustion quality, high cetane value in the fuel helps in improved combustion. To determine the cetane number is an arduous and expensive. In this research, by using the fatty acid profiles the cetane number is determined as 55.38 and by the experimental analyses the cetane name is 54. The predication of cetane number from fatty acid compositions and by experimentation were in good agreement.
5) Different physicochemical properties of PME were measured by following international standards. And these properties are almost similar to standard diesel fuel.
6) Therefore, Taguchi based optimization analysis with appropriate process variables are effectively used to maximize the biodiesel yield.
References
-
Knothe Gerhard The History of Vegetable Oil-Based Diesel Fuels. The Biodiesel Handbook. Champaign, AOCS Press, 2005.
-
Van Gerpen, Jon H., Charles Peterson L., Carroll Goering Biodiesel: An Alternative Fuel for Compression Ignition Engines. St. Joseph, 2007.
-
Pahl Greg Biodiesel: Growing a New Energy Economy. Chelsea Green Publishing Company, 2005.
-
Aditya Kolakoti, Appa Rao B. V. A comprehensive review of biodiesel application in IDI engines with property improving additives. I-manager’s Journal on Mechanical Engineering, Vol. 5, Issue 4, 2015, p. 35-45.
-
Talamala V., Kancherla Pr, Appa Rao Basava V., Kolakoti A. Experimental investigation on combustion, emissions, performance and cylinder vibration analysis of an IDI engine with RBME along with isopropanol as an additive. Biofuels, Vol. 8, Issue 3, 2016, p. 307-321.
-
Prasada Rao K., Appa Rao B. V. Parametric optimization for performance and emissions of an IDI engine with Mahua biodiesel. Egyptian Journal of Petroleum, Vol. 26, Issue 3, 2017, p. 733-743.
-
Chang D. Y. Z., Van Gerpen J. H. Fuel properties and engine performance for biodiesel prepared from modified feed socks. SAE paper No. 971684, 1997.
-
Channapattana S. V., Kantharaj C., Shinde V. S., et al. Emissions and performance evaluation of DI CI-VCR engine fuelled with honne oil methyl ester/diesel blends. Energy Procedia, Vol. 74, Issue 1, 2015, p. 281-288.
-
Aditya Kolakoti, Appa Rao B. V. System and Method for a Supercharged IDI Engine Run by Biodiesel. Indian Patent No. 201741014482, 2017.
-
Aditya Kolakoti, Appa Rao B. V. Performance and emission analysis of a naturally aspirated and supercharged IDI diesel engine using palm methyl ester. Biofuels, 2017. https://doi.org/10.1080/17597269.2017.1374770.
-
Sukumar Puhan, Vedaraman N., Rambrahamam B. V., Naga-Rajan G. Mahua seed oil: a source of renewable energy in India. Journal of Scientific and Industrial Research, Vol. 64, Issue 1, 2005, p. 890-896.
-
Aditya Kolakoti, Appa Rao B. V. Effect of fatty acid composition on the performance and emission characteristics of an IDI supercharged engine using neat palm biodiesel and coconut biodiesel as an additive. Biofuels, 2017, https://doi.org/10.1080/17597269.2017.1332293.
-
Puhan S., Saravanan N., Nagarajan G., et al. Effect of biodiesel unsaturated fatty acid on combustion characteristics of a DI compression ignition engine. Biomass Bioenergy, Vol. 34, Issue 1, 2010, p. 1079-1088.
-
Van Gerpen J. A. Cetane number testing of biodiesel. Proceedings of the 3rd Liquid Fuels Conference, Nashville, USA, 1996.
-
Geller D. P., Goodrum J. W. Effects of specific fatty acid methyl esters on diesel fuel lubricity. Fuel, Vol. 83, Issue 1, 2004, p. 2351-2356.
-
Bamgboye A. I., Hansen A. C. Prediction of cetane number of biodiesel fuel from the fatty acid methyl ester (FAME) composition. International Agrophysics, Vol. 22, Issue 1, 2008, p. 21-29.
-
Pischinger G. M., Falcon A. M., Siekmann R. W., Fernandes F. R. Methylesters of plant oils as diesels fuels, either straight or in blends vegetable oil fuels. International Conference on Plant and Vegetable Oils as Fuels, Fargo, ND, USA, 1982.
Cited by
About this article
The authors would like to thank Prof. B V Appa Rao and Prof. T V Hanumantha Rao for the kind assistance provided during in this study.
