Abstract
In recent decades, the provisions of new challenges to railway track demanded for a better understanding of the track dynamic, especially to track geotechnical dynamics. For geotechnical problems the presence of water in the void of soils has influence on the behavior of the soil effects such as temporarily development of excess pore water pressure of the soil or even liquefaction and mud pumping can occur. To account these effects considering the soil as two-phase material would be helpful to better understand the saturated railway line failures. Hence, this paper describes the pore fluid analysis of fully saturated railway embankment response subjected to train induced vibrations using three-dimensional finite element package ABAQUS. The modelized 3D track consists of train loads, rail, pads, sleeper, sub-ballast, ballast, saturated sub-grade, saturated subsoil layer and semi-infinite bedrock. The water-saturated soil layers modeled as poroelastic and the infinite bed rock as elastic medium. To this end, the influence of relative density, hydraulic conductivity, un-drained Young’s modulus and depth of embankment on excess pore water pressure development are compressively studied. The predicated results show that hydraulic conductivity, un-drained Young’s modulus and depth of embankment have quite significant effect on the induced excess pore water pressure; while the influence of relative density is very small. The result also shows that positive excess pore water pressure mainly distributes on the soil and this will permit fine grain soils to flow out from interior to exterior region of the model. Hence, mud pumping and liquefaction is developed not in specific type of soil instead can be developed in any type of soil with low hydraulic conductivity, high depth of embankment and low un-drained Young’s modulus.
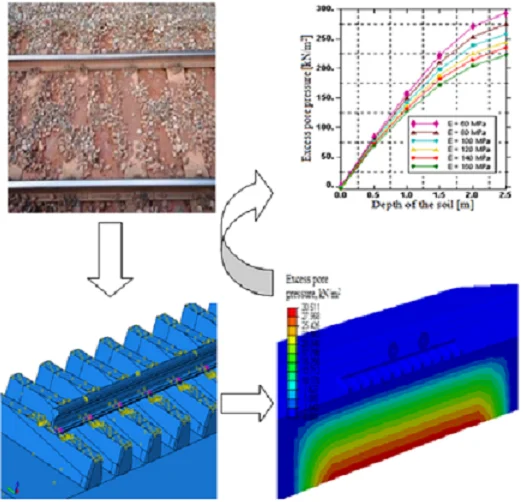
Highlights
- A 3D solid elements consisting of all railway components is developed using three dimensional finite element package ABAQUS.
- ABAQUS Pore fluid analysis was used to analyze train induced excess pore water pressure generation.
- The water saturated soil layers are modeled as pore elastic and the infinite bed rock as elastic medium.
- All of the analysis is completed when the steady state is essentially reached.
- The potential influence of most important parameters on mud pumping and liquefaction were evaluated.
1. Introduction
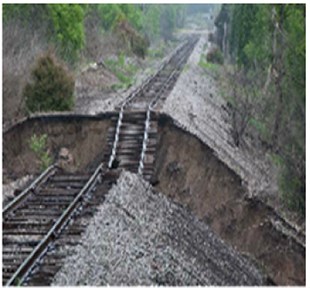
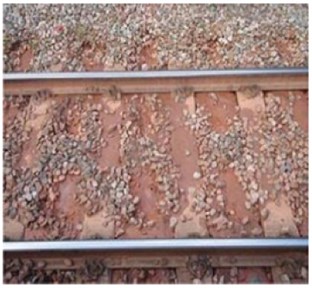
A number of failure of railway embankments have been attributed to the liquefaction and mud pumping of the saturated sub-grade surface caused by vibrating or seismic loading, since moving train load is recognized as source of ground vibration [1], and resulting upward flow of water frequently turns the soil in to liquefied condition and mud pumping. Besides, the motivations of the attention given to such areas were deducted from the pictures shown in Fig. 1. Showing failures of saturated railways embankments happened recently in different regions of the world [2-3]. Furthermore, some failure of railway line in presence of water is reported in literature [4-6]. Hence, the dynamic responses of saturated sub-grade railway structures induced by moving train loads are fundamental to alleviate liquefaction and mud pumping disturbance in a number of engineering fields such as transportation engineering. An important stage to predicate the liquefaction is the predication of excess pore water pressure at given point [7].
Due to vibration problems mentioned in the above literatures, great efforts have been made to study the response of railway caused by train induced vibrations. The focus of existing researches can be classified on superstructure (rail, sleeper) and sub-structures (ballast, sub-ballast, sub-grade and subsoil layers). For example, dynamic response of superstructure has been examined [8-14], These models are helpful in understanding the influence of the railway superstructure and the load from trains, but the influence of sub-grade and subsoil model was not well considered. Thus, the sub-grade and subsoil problems under moving train loads considering them as homogeneous or layered elastic/viscoelastic has been examined [15-18], the approaches have been found successful in performing analysis in dry medium, where pore fluid analysis is ignored and saturation of the sub-grade was not considered. Due to flooding, heavy rainfall and natural ground water, the sub-grade may become saturated, therefore poroelastic /poroviscoelastic models are obviously closer to this condition than elastic models. To consider the saturation of the sub-grade, Biot’s theory [19] was introduced to model saturated poroelastic/poroviscoelastic soil [20-23]. However, saturated sub-grade soils can be composed of soils with different important parameters such as hydraulic conductivity, relative density, Un-drained Young’s modulus and depth of the soil layers. Only single phase of materials (e.g. loose or dense) material cannot properly describe the potential problems to liquefaction or mud pumping.
Fig. 1Failures of: a) saturated railway embankment in 2011, b) mud pumping under dynamic train loads in UK
a)
b)
Although the above works have made a great effort on solving problems regarded to the dynamic response of track-sub-grade system, dynamic responses of this sub-grade model coupled with track system are still unclear, such as the influence of key parameters of saturated soils. In this study, the excess pore water pressure distribution of the railway saturated sub-grade layers under different key parameters such as relative density, hydraulic conductivity, un-drained young's modulus and depth of embankment are comprehensively investigated. Therefore, this article looking for an attribute which can separate the influence of parameters from specific soil types. Furthermore, the goal is to identify the parameters that cause high excess pore water pressure development and evaluate the variations in the predicated value in each parameters required.
2. Numerical modelling
2.1. Track geometry under study
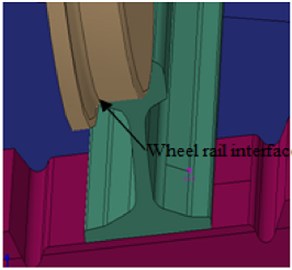
A 3D solid elements consisting of moving wheel loads, rail, sleeper, sub-grade and the ground models is developed using ABAQUS after imported the models from CATIA software. Train loads are simplified as a series of two wheel loads carrying a load of 125 kN and as the railway track was symmetric about its center, the FE model only concerned half of the track-ground system, as it has been previously presented in [18]. The wheel flange and rail contact illustrated in Fig. 2 was deemed to have an effect on the response of railway like on lateral loads that moving wheels are exerting on the track, thus the wheel flange was considered in the FE model. The mass of rail-pads is neglected and considered as spring and dashpot, since the rail-pads mass is negligible with respect to concrete sleeper mass, while comparing mass and stiffness between rail-pads and concrete sleepers.
Fig. 2Wheel-rail contact interface
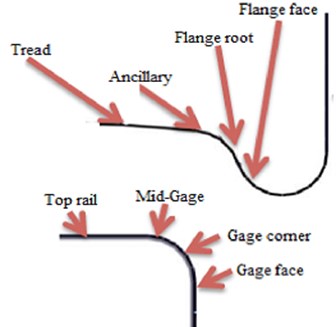
Fig. 3Schematic view of the FE models
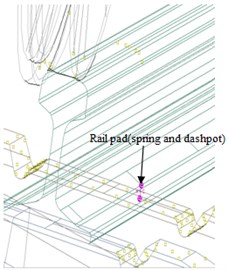
a)
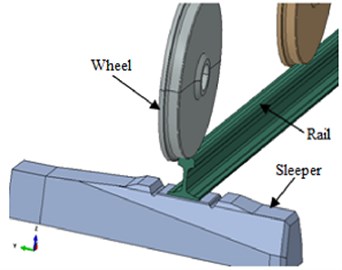
b)
c)
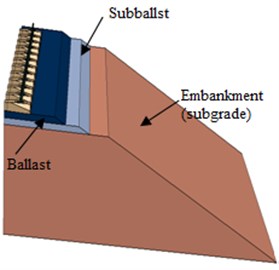
d)
2.2. Materials and element assignments
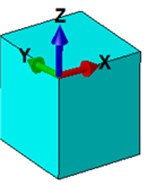
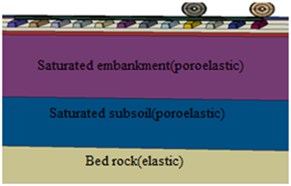
The saturated layer lies on semi-infinite bedrock is considered as elastic half-space, while the saturated soil layers are taken as poroelastic layer and are given in Table 1. The water table is to be maintained at the top surface of the soil. The saturated normally consolidated soil is modelled by a brick of 8-node trilinear displacement, trilinear pore pressure, reduced integration hourglass control elements and the corners of each element have a variables dx, dy, dz and pore pressure as a variable.
Fig. 4a) Element type, b) longitudinal overview of the model
a)
b)
Table 1Pore elastic of the sand and elastic behaviour of the bed rock
Parameters | Description | Saturated embankment | Saturated subsoil | Bed rock |
E | Young’s modulus [kN/m2] | 6e+4 | 6.5e+4 | 3e+6 |
υ | Poisson’s ratio | 0.49 | 0.49 | 0.2 |
Ks | Bulk modulus solid [kN/m2] | 6.7e+7 | 7.2e+7 | – |
Kw | Bulk modulus water [kN/m2] | 5.1e+6 | 5.5e+6 | – |
ρs | Density of the soil particles [kN/m2] | 1.8e+4 | 1.8e+4 | 2.7e+4 |
ρw | Density of water [kN/m2] | 10 | 10 | – |
RD | Relative density | 0.2 | 0.2 | – |
k | Hydraulic conductivity [m/s] | 1e-4 | 1e-4 | – |
2.3. Interfacing and boundary conditions
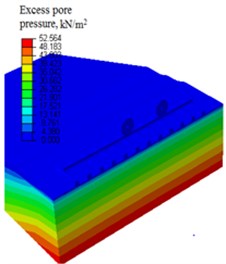
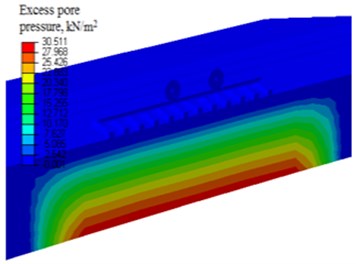
The interface between railway track components were formulated using surface-to surface discretization methods with finite sliding formulations, the master and a slave surfaces for each contact pairs were defined using frictional coefficients. On the pertinent boundaries of finite element model of real system infinite elements are used to absorbs imperfect waves i.e. reflecting back from the boundaries. This reflected wave energy may affect the excess pore water pressure of region adjacent to the boundaries. For such reason, after trials the boundaries are therefore found to place at 8 m far from the track in order to form a reasonable distance necessary to minimizing the influence of the wave reflection on the pore water pressure development. As can be seen in Fig. 5(a), it is observed that excess pore water pressure development through the waves reflect back in the regular model. However, in the model with infinite elements only very small excess pore water pressure is developed through reflected wave energy, since the excess pore water pressure developed by the moving train loads at the pertinent boundary is approx. to zero (Fig. 5(b)). Note that the axle loads were driven at 120 km h-1.
Fig. 5The contour plot of: a) excess pore water pressure distribution regular model, b) model with infinite element at t= 0.12 s
a)
b)
2.4. Analysis
ABAQUS is general finite element package, that provides capabilities of analysis on a wide range of engineering problems. To perform the dynamic analysis procedure of ABAQUS Pore fluid/stress analysis, the recommended automatic time increment is used, since the time increments in typical diffusion can increase by several orders of magnitude during the simulation [24].
The state of analysis for this article consists of five phase; i.e. applied to compute the dynamic response of the track in time domains. The first phase was the loading phase that served to apply the gravity loads to the system and applying the wheel load by setting the wheels in its starting positions. Second phase was used to extinct the pore water pressure developed during loading that could be affect the responses any more in the moving train loads. Third phase, with the loading applied, the wheels were then moved along the rail and reached at the end of the rail. Fourth phase, the analysis continues and the change in the pore water pressure becomes negligible at the end of movement of the wheels, but the simulation must end later, if not the steady state response can be claimed. Fifth phase, the analysis completes when the change in pore water is negligibly small (zero) (i.e. the steady state is essentially reached). The demonstrations are shown in Fig. 6.
Fig. 6The contour plot of pore water pressure distribution at different phases
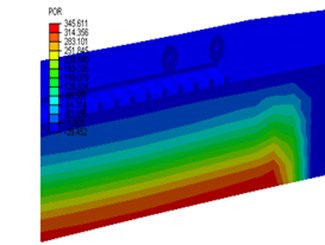
a) Phase 1: loading
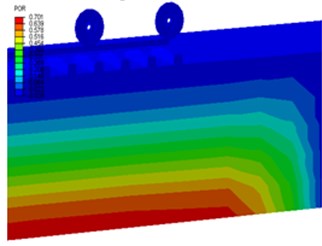
b) Phase 2: POR due to loading disappeared
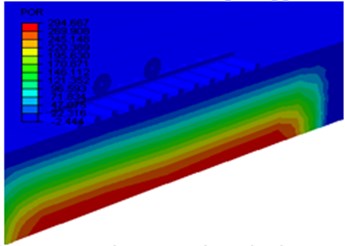
c) Phase 3: POR due to moving wheels
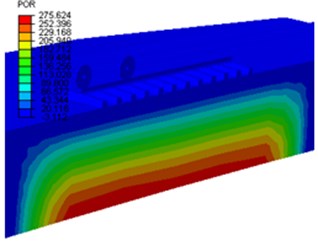
d) Phase 4: End of movement of wheels
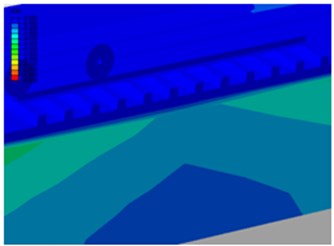
e) Phase 5: The pore water pressure was stabilized
Note that the article focused on numerical comparison irrespective of the absolute value, but the accuracy of the numerical methods has been verified with those reported by Thack et al. [15] in which the maximum vertical displacement of the track-ground system at different locations is investigated. Furthermore, the verification of the numerical method is detailed in [18]. The resulting values of peak response after verification are listed in Table 2.
Table 2Resulting value by Thack et al. [15] and this numerical method for maximum peak displacement at different points
Distance (m) | Location | Peak vertical displacement (mm) | Time (s) |
0 | Top ballast | 12 | 1.6 |
5 | Edge of embankment | 6 | 1.7 |
10 | Toe of embankment | 4 | 1.55 |
3. Results and discussions
The influence of each parameter is here presented and discussed in this section. The excess pore water pressure has been predicated and comparisons are made based on the measured result by varying the parameters. The discussion and suggestions drawn from the results presented herein as follows.
3.1. The influence of the relative density on pore water pressure
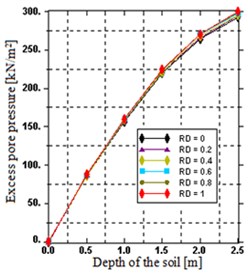
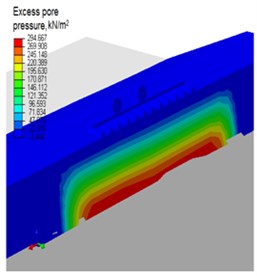
Since the stiffness of the sand depends on the void ratio, the relative density of the sand influences the excess pore water pressure additionally. In Fig. 7, the relative density (RD) is varied and the excess pore water pressure developed is displayed at t= 0.15 s after beginning of wheel moving. The maximum excess pore water increases from 292.4 kN/m2, in case of very loose sand (RD = 0) to 299.7(+2.5 %) in case of very dense sand (RD = 1), see Fig. 7(a). From this, it’s easy to say that the direct influence of relative density on excess pore water pressure is very small, meanwhile increasing relative density has a minor influence on transfer of loading from the pore water to the solid phase.
Fig. 7Distribution of: a) excess pore pressure over a depth, b) typical field output of excess pore water pressure for RD = 0.2
a)
b)
3.2. The influence of the hydraulic conductivity on pore water pressure
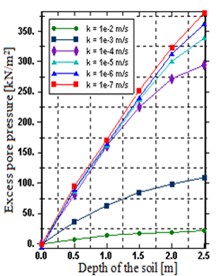
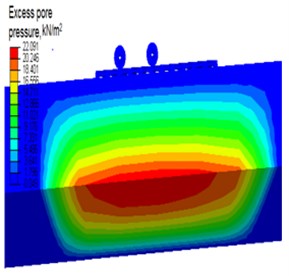
The influence of hydraulic conductivity on excess pore water pressure is shown in Fig. 8. Considering hydraulic conductivity of 1e-2 ≤ k ≤ 1e-7 m/s, a decrease in maximum excess pore water pressure of 89.5 % can be observed. Within hydraulic conductivity of 1e-5 ≤ k ≤ 1e-7 m/s, the soil shows un-drained behavior, since their influence on maximum excess pore water pressure is small (+10.84 %) compared to 1e-2 ≤ k ≤ 1e-5 m/s (+93.52 %). As a whole, for 1e-5 ≤ k ≤ 1e-7 m/s, the pore water has to flow out the void of the solid skeleton, before the soil can be compacted, but due to dissipation resistance caused by the solid skeleton the change in excess pore water pressure is small. Furthermore, considering hydraulic conductivity of k= 1e-2 and 1e-3, the influence of flow becomes obvious.
Fig. 8Distribution of: a) excess pore pressure over a depth, b) typical field output of pore water pressure for k= 1e-2
a)
b)
3.3. The influence of un-drained Young’s modulus on pore water pressure
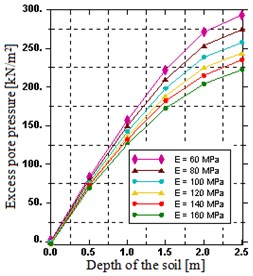
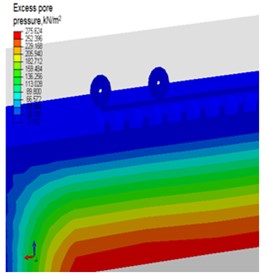
The maximum excess pore water pressure changing with sub-grade un-drained Young’s modulus are shown in Fig. 9. In Fig. 9(a), the maximum excess pore water pressure decreases with the increases the sub-grade modulus, since the maximum value of the excess pore water pressure can decrease by 24.73 % as sub-grade modulus increases from 60 to 160 MPa. The reason is that in case of un-drained conditions, the main part of the moving load is carried by the pore water and increasing un-drained Young’s modulus restrains the contracting behavior of the solid skeleton and hence the excess pore water becomes reduced due to this contracting resistance of the solid skeleton.
Fig. 9Distribution of: a) excess pore water pressure over a depth, b) typical field output of excess pore water pressure for E= 80 MPa
a)
b)
3.4. The influence of height of the embankment on pore water pressure
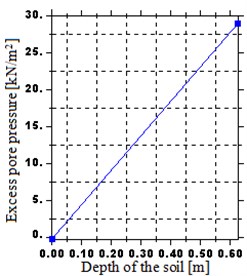
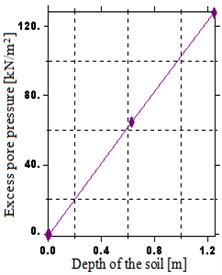
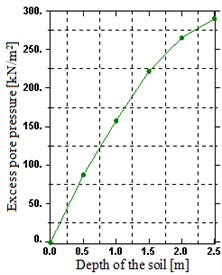
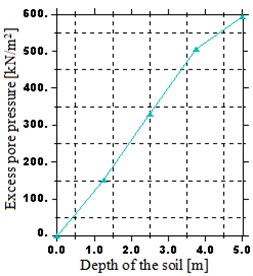
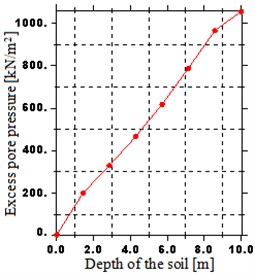
The investigation on the benefit of embankment height has been carried out as shown in Fig. 10. According to the figures, the maximum excess pore water pressure increases significantly with the increasing height of the embankment. Furthermore, the maximum pore water pressure increases by 77.92, 55.6, 50.29 and 43.85 % as height increases from 0.625 to 1.25, 1.25 to 2.5, 2.5 to 5 and 5 to 10 m, respectively. This is likely because, the excess pore water can dissipate freely throughout the upper surface above the interface and toward the lower boundary beneath the interface and this increase of height increase the path to the draining surface.
Fig. 10Distribution of excess pore water pressure over a depth: a) H= 0.625 m, b) H= 1.25 m, c) H= 2.5 m, d) H= 5 m, e) H= 10 m
a)
b)
c)
d)
e)
4. Conclusions
A 3D solid elements consisting of moving wheel loads, rail, sleeper, saturated soil layer and semi-infinite bed rock is developed using ABAQUS after imported the models from CATIA software. By using the Pore fluid analysis, the effects of relative density, hydraulic conductivity, un-drained Young’s modulus and embankment height on excess pore water pressure of the saturated sub-grade layer are investigated. Based on the results of parametric study, major conclusions are drawn as follows:
1) Since positive excess pore water pressure mainly distributes on the soil and this will permit fine grain soils to flow out from interior to exterior region of the model. Hence, mud pumping and liquefaction is not depending on the type of the soil instead it depends on the parameters such as relative density, hydraulic conductivity, un-drained Young’s modulus and embankment height.
2) The hydraulic conductivity significantly affects the development of excess pore water pressure in the saturated sub-grade layer. Meanwhile, lower hydraulic conductivity can lead to higher excess pore water pressure. Therefore, a good drained sub-grade layer should be required to reduce the dissipation resistance caused by the solid skeleton. Besides, embankment height and un-drained Young’s modulus have significant influence on the excess pore water development. Conversely, the direct influence of relative density is very small.
3) Excess pore water pressure, increases as the embankment height decreases, signing at liquefaction potential and mud pumping on such high sub-grade height. In order to reduce this phenomenon, a reasonable sub-grade height should be required. Furthermore, the increase of the sub-grade un-drained Young’s modulus decreases the development of excess pore water pressure. Therefore, especial attention should be paid regarding to sub-grade un-drained modulus to alleviate the liquefaction and mud-pumping.
References
-
Kayina A. M., Madshus C., Jackrisson P. Ground vibration from high-speed trains: Prediction and counter measures. Journal of Geotechnical and Geoenvironment, Vol. 126, Issue 6, 2000, p. 531-537.
-
Fuggini C., Zangani D. Numerical investigation of the effect of variable subsoil conditions and freight traffic on railway infrastructure. Transport Research Arena, Paris, 2014.
-
Ghataora G. Research into the geotechnics of railway track foundations. Railway Strategies, Vol. 278, 2009.
-
Polemio M., Lollino P. Failure of infrastructure embankments induced by flooding and seepage: a neglected source of hazard. Natural Hazards and Earth System Science, Vol. 11, 2011, p. 3383-3396.
-
Ghataora G., Burns B., Burrow M., Evdorides H. Development of an index test for assessing anti-pumping materials in railway track foundations. Proceedings of the 1st International Conference on Railway Foundations, Railfound06, Birmingham, UK, 2006.
-
Duong T. V., Cui Y. J., Tang A. M., Dupla J. C., Canou J., Calon N., Robinet A. Investigating the mud pumping and interlayer creation phenomena in railway sub-structure. Engineering Geology, Vol. 171, 2014, p. 45-58.
-
Nabili S., Jafarian Y., Baziar M. H. Seismic pore water pressure generation models, numerical evaluation and comparison. 14th World Conference on Earthquake Engineering, Beijing, China, 2008.
-
Hasna P. H. Study of dynamic behavior of rail track using finite element method. International Journal of Engineering Research and General Science, Vol. 3, Issue 6, 2015, p. 668-676.
-
Kumaran G., Menon D., Nair K. K. Dynamic studies of rail track sleepers in track structures system. Journal of Sound and Vibration, Vol. 15, Issue 4, 2003, p. 485-501.
-
François S., Schevenels M., Galvín P., Lombaert G., Degrande G. A. 2.5 D coupled FE-BE methodology for the dynamic interaction between longitudinally invariant structures and a layered halfspace. Computer Methods in Applied Mechanics and Engineering, Vol. 199, Issue 23, 2012, p. 1536-1548.
-
Galvin P., François S., Schevenels M., Bongini E., Degrande G., Lombaert G. A 2.5 D coupled FE-BE model for the prediction of railway induced vibrations. Soil Dynamics and Earthquake Engineering, Vol. 30, Issue 12, 2010, p. 1500-1512.
-
Costa P. A., Calçada R., Cardoso A. S. Track-ground vibrations induced by railway traffic: in-situ measurements and validation of a 2.5 D FEM-BEM model. Soil Dynamic and Earthquake Engineering, Vol. 32, Issue 1, 2012, p. 111-128.
-
Vogiatzis K. E., Kouroussis G. Prediction and efficient control of vibration mitigation using floating slabs: practical application at Athens metro lines 2 and 3. International Journal of Rail Transportation, Vol. 3, Issue 4, 2015, p. 215-232.
-
Carels P., Ophalffens K., Vogiatzis K. Noise and vibration evaluation of a floating slab in direct fixation turnouts in Ηaidari and Αnthoupoli extensions of Athens metro lines 2 and 3. Ingegneria Ferroviaria, Vol. 67, Issue 6, 2012, p. 533-553.
-
Thack P. N., Kongo G. Q. A prediction model for train-induced track vibrations. Electronic Journal of Geotechnical Engineering, Vol. 17, 2012, p. 3559-3569.
-
Connolly D., Giannopoulos A., Forde M. C. Numerical modelling of ground borne vibrations from high speed rail lines on embankments. Soil Dynamics and Earthquake Engineering, Vol. 46, 2013, p. 13-19.
-
Madshus C., Bessason B., Harvik L. Prediction model for low frequency vibration from high speed railways on soft ground. Journal of Sound and Vibration, Vol. 193, Issue 1, 1996, p. 195-203.
-
Aynalem M., Abraham T. Modelling the influence of sub-grade material parameters on the response of railway line under moving train loads. Journal of Vibroengineering, Vol. 20, Issue 3, 2018, p. 1501-1510.
-
Biot M. Theory of propagation of elastic waves in a fluid-saturated porous solid. I. Low-frequency range. Journal of the Acoustical Society of America, Vol. 28, Issue 2, 1956, p. 168-178.
-
Jin B., Yue Z., Tham L. Stresses and excess pore pressure induced in saturated poroelastic halfspace by moving line load. Soil Dynamics and Earthquake Engineering, Vol. 24, Issue 1, 2004, p. 25-33.
-
Lefeuve Mesgouez G., Mesgouez A. Ground vibration due to a high-speed moving harmonic rectangular load on a poroviscoelastic half-space. International Journal of Solids and Structures, Vol. 45, Issue 11, 2008, p. 3353-3374.
-
Theodorakopoulos D. D. Dynamic analysis of a poroelastic half-plane soil medium under moving loads. Soil Dynamic and Earthquake Engineering, Vol. 23, Issue 7, 2003, p. 521-533.
-
Xu B., Lu J. F., Wang J. H. Dynamic response of a layered water-saturated half-space to a moving load. Computers and Geotechnics, Vol. 35, Issue 1, 2008, p. 1-10.
-
ABAQUS Analysis User’s Manual. Version 6.13, Dassault Systemes Simulia Corp., 2013.
Cited by
About this article
The work was carried out at the School of Civil Engineering, University of Mekelle, Ethiopian Institute of Technology-Mekelle. Financial supports were provided by Ethiopia Roads Authority and University of Mekelle. This financial support is gratefully acknowledged.
