Abstract
Heat effect is one of the most important factors affecting the brake noise level. The finite element model for transient heat transfer analysis of disc brake is established based on heat transfer control equation and heat dissipation boundary conditions of dynamic convection. According to the NVH test and modal calculation, the brake noise characteristics are tested and analyzed. Meanwhile, the heat transfer simulation is verified and shows high accuracy. The discrete data for the response surface function are obtained by the Central Composite Design method with the peak temperature and mass as the target variables. The error of regression function is judged by fitting decision coefficient, correcting decision coefficient and root mean square error. By the optimizing mathematical model, the brake disc temperature peak can be greatly reduced and the heat transfer ability is obviously optimized without mass increasing, the time with temperature above 120 °C can be reduced by 46 %. Through the comparison of brake noise level before and after optimization, it can be known that the noise level can be significantly decreased after structural optimization, except the first order resonance frequency. The optimization result has good social and economic value.
Highlights
- According to the NVH test and modal calculation, the brake noise characteristics are tested and analyzed.
- The discrete data for the response surface function are obtained by the Central Composite Design method with the peak temperature and mass as the target variables.
- The noise level can be significantly decreased after structural optimization, except the first order resonance frequency.
1. Introduction
With the improvement of comfort requirements, noise reduction of automobile brakes is becoming more and more important. The high frequency squealing noise produced during braking is very harsh because of the thermal deformation [1] and vibration caused by the contact between friction material and sliding surface. According to the results of previous studies, it can be seen that when the excitation frequency is below 1000 Hz, low frequency noise [2] will be generated, which is mainly caused by the resonance of the brake caliper. When the excitation frequency range is 1-6 kHz, a low frequency squeal will be generated, which is mainly caused by the resonance of the brake disc.
The brake noise is mainly related to the physical properties of the friction material and brake heat [3, 4]. Among them, the brake heat is mainly affected by the heat transfer performance of brake disc, which can also determine the reliability of braking performance. So, it can be guessed that the thermal deformation and the probability of high frequency noise can be effectively reduced by optimizing the heat transfer characteristics of the brake disc. In order to improve the calculation efficiency of disc brake heat transfer performance optimization, an optimization mathematical model based on quadratic programming algorithm is proposed to verify the validity of the research scheme through error statistics and analysis of the approximate model. The influence of heat transfer performance optimization on brake noise can be effectively verified by NVH test.
2. Analysis of heat transfer characteristics of brake disc
2.1. Heat transfer control equation
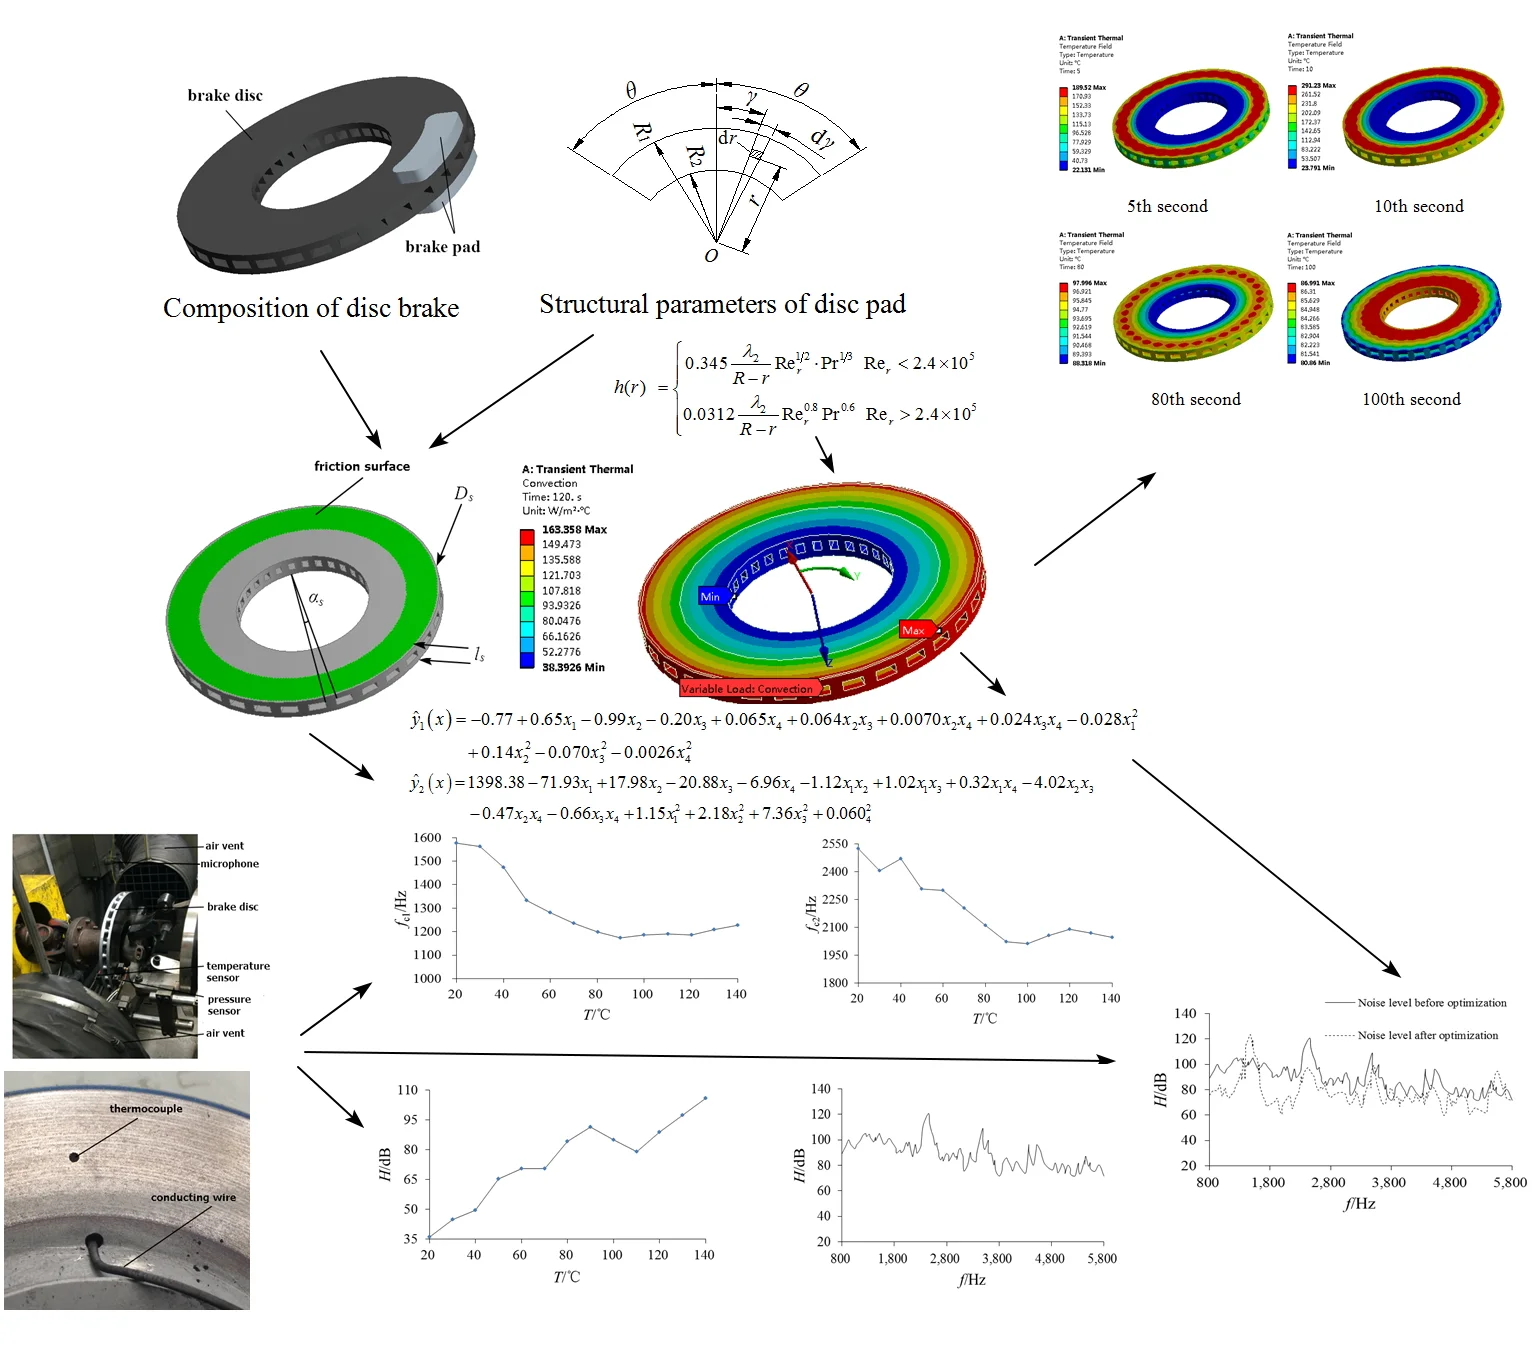
The disc brake is mainly composed of brake disc and brake pad, as shown in Fig. 1, and the structural parameters of disc pad is shown in Fig. 2. According to the experimental research of Ref. [5], it can be known that the key factor affecting the heat flux distribution under sliding friction is the thermal resistance of the contact surface between brake disc and brake pad, but it is difficult to calculate quantitatively. Therefore, the thermal conduction boundary between the contact surfaces should be approximately simplified. In the paper, the point contact in the true contact area of the friction pair is regarded as an isothermal region, while the outside point contact is non-isothermal region. For disc brake, the mathematical expressions is:
where T1 and T2 represent the characteristic temperature of the brake pad and the brake disc in the real contact area, unit of K; q1 and q2 are the heat flux density of the brake pad and the brake disc under the condition of dynamic friction, unit of J/(m2·s); q is the total heat flux during the brake process, unit of J/(m2·s).
Fig. 1Composition of disc brake
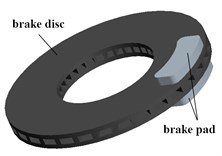
Fig. 2Structural parameters of disc pad
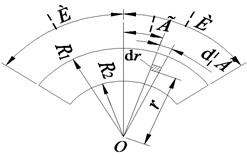
The heat flux distribution coefficient of brake pad is:
where λ1 and λ2 are the thermal conductivity of the brake pad and the brake disc, unit of W/(m·K); c1 and c2 are the specific heat of the brake pad and the brake disc, unit of J/(kg·K); ρ1 and ρ2 are the density of the brake pad and the brake disc, unit of kg/m3.
According to the energy conservation, the heat flow load on the brake disc surface can be calculated as followed:
where q12(r, γ, t) is the heat flux of the brake disc in polar coordinate of (r, γ), unit of J/(m2·s); In the coordinate, r is radial coordinate, (R2 ≤ r ≤ R1); γ is rotative angle; t is time. χ is the power and heat weight of friction, (0 ≤ χ ≤ 1); μ is the friction coefficient; S1 is the contact area between the friction disc and the brake disc, unit of m2; p(r, γ, t) is the friction disc pressure, unit of Pa; ω(r, γ, t) is the transient angular velocity of the brake disc, unit of rad/s.
According to the energy conservation equation, the three-dimensional transient heat transfer control equation of the brake disc can be obtained as follows:
where a is the thermal diffusivity of brake disc, which is related to material quality, unit of m2/s; T is temperature, unit of K; ˙Φ is internal heat source, unit of J/m3.
The physical heat transfer phenomena of the brake can be converted into a mathematical model by Eq. (4), which is essentially the solution of partial differential equations.
2.2. Solution of dynamic convection heat transfer coefficient and temperature field
Convective heat transfer is a ubiquitous physical phenomenon in nature, which is more complicated than pure heat conduction [5]. Therefore, the static convective heat transfer coefficient is generally calculated in engineering, but the accuracy is limited [6]. In order to obtained more accurate results, the dynamic change of convection heat transfer coefficient in space is considered in the paper.
According to the boundary layer theory, the local Nusselt number of the brake disc surface under laminar flow condition can be obtained as follows:
The local Nusselt number of brake discs under turbulent conditions is:
where Rex is local Reynolds number and Pr is air Prandtl number.
The dynamic convection heat transfer coefficient of the brake disc along the radial direction can be calculated as follows:
where R is the external diameter of brake disc.
The formula of local Reynolds number along the radial direction is calculated as follows:
where dt is architectural feature length of brake disc, unit of m; η is dynamic viscosity of air, unit of Pa·s; ρa is air density, unit of kg/m3.
In this paper, ANSYS/Workbench is used to analyze the heat transfer of disc brake under forced air convection. Transit thermal module is applied to realize the FEA solution [7], of which total analysis time is 120 s for uniform braking at long downhill simulation and the iteration time step is set as 0.1 s.
During the preprocessing stage of transient heat transfer calculation, the main tasks are accomplished as follows:
(1) Through the design modeler, the annular thermal loading surface with two ends is divided by curved slice as shown in Fig. 3.
Fig. 3FEA model diagram
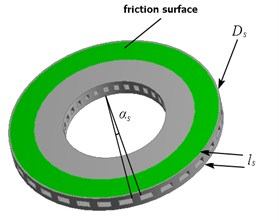
Fig. 4Convective coefficient distribution
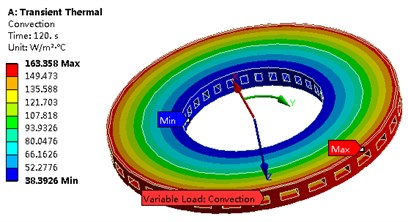
(2) The refined mesh of the whole model is partitioned by means of large numerical correlation and local optimization. The number of elements and nodes is obtained as 128553 and 205652 respectively.
(3) By calculating Eq. (3) in the condition of brake pressure of 1 MPa and brake speed of 60 km/h (the angular velocity of brake disc is 38.3 rad/s), the Tabular Data method was used to define the heat flux load of the friction surface within 10 s as 8.2×10⁵ W/m2. The direction of thermal radiation is defined as all around. The emissivity is set as 0.28, and the ambient temperature is set as 20 ℃.
(4) The cylindrical coordinate system is established, and the convective heat transfer coefficient is defined by Eq. (7), as shown in Fig. 4.
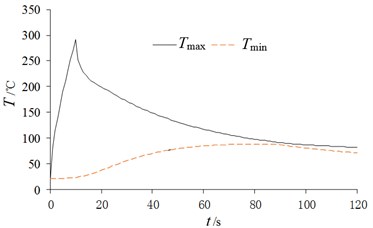
Then the transient temperature field of the brake disc can be obtained as shown in Fig. 5, and the extreme temperature variation curve is shown in Fig. 6. According to the solution, it can be known that the temperature field of the brake disc shows obvious difference at different times, and the conduction velocity of the temperature in the axial direction is greater than that in the radial direction.
Fig. 5Temperature field of brake disk at different time
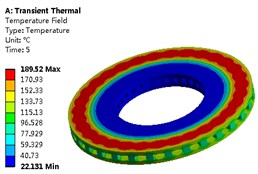
a) 5th second
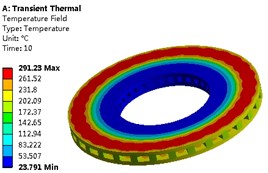
b) 10th second
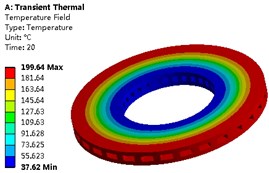
c) 20th second
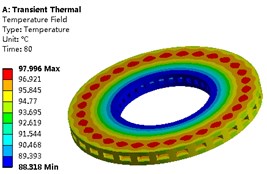
d) 80th second
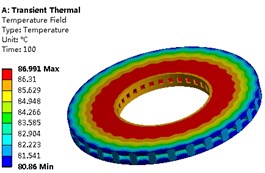
e) 100th second
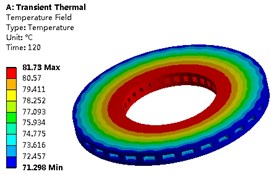
f) 120th second
Fig. 6The extreme temperature variation curve
3. NVH test validation and brake noise characteristics test
3.1. Test scheme design and validation of heat transfer analysis
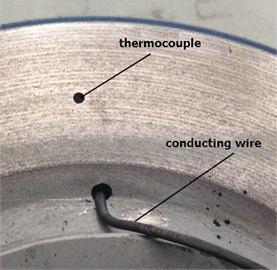
The experimental research is realized based on the bench test method of Link3900 NVH test platform in the paper. The overall installation diagram of the disc brake and sensor is shown in Fig. 7, and the noise signal is obtained by the microphone. The brake is mounted on the spindle and synchronously rotates along with the output shaft of the reducer. Sensor types mainly include temperature sensors, torque-speed sensors, displacement sensors and so on. High precision thermocouple is used in temperature detection. The drill hole is inserted into the brake disk and the conducting wire is directly connected to the test machine as shown in Fig. 8.
Fig. 7The overall installation diagram
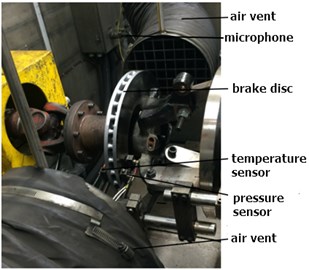
Fig. 8The thermocouple installation method
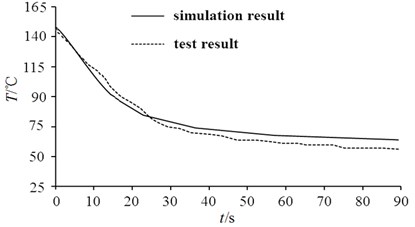
In the numerical simulation scheme, the node temperature corresponding to the installation position of the temperature sensor at the stopping time of heat flow load is 146 ℃. Because continuous fixed heat source is used instead of discrete moving heat source in the simulation process, the properties of heat source are inconsistent, so it is necessary to check the heat transfer characteristics under the condition of no heat source. Therefore, the program is set up to stop the pressure loading when the temperature sensor reaches 146 ℃ and sample the transient temperature parameters as 0 time. Finally, the check result between the test value and the simulation value is obtained as shown in Fig. 9. The result shows a good match, the average deviation between two curves is 3.9 %. It also can see that there is a small phase difference between the test results and simulation results, which is due to a certain error accumulation in the test speed control. In summary, the simulation results have high calculation accuracy.
Fig. 9Comparison between test results and simulation results
3.2. Analysis of brake noise characteristics
According to NVH test, the brake noise characteristics with time domain can be obtained directly. In order to research the relationship between cause and effect, noise level data is processed, and modal finite element analysis is supplemented to associate temperature and frequency in the paper. As shown in Fig. 10, it can be seen that the noise level (symbol of H) generally increases with the increase of braking temperature except the range of 90 ℃ to 120 ℃. The spectrum response of noise level can be get based on Fourier transform and filtering calculation as shown in the Fig. 11, which can measure noise characteristics of brake disc as the main basis. From Fig. 11, it can be seen that there are multiple peak frequencies in noise level, but the difference of equilibrium value is small.
Fig. 10Changes of noise level with sensor temperature
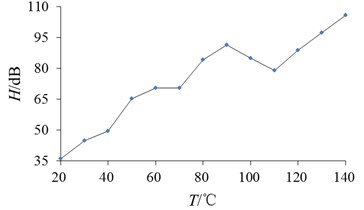
Fig. 11Changes of noise level with frequency
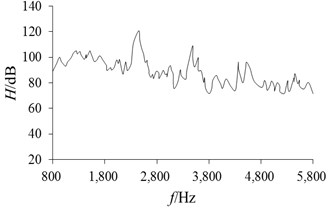
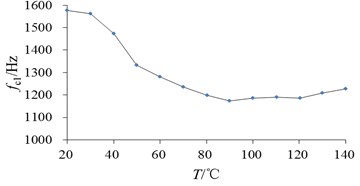
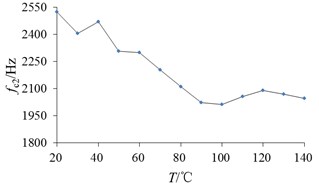
During the modal finite element analysis, the thermal expansion factor should be considered. Therefore, it is necessary to couple the temperature field results with the modal results. Through data acquisition of temperature field, the changes of natural frequency with temperature can be obtained as shown in Fig. 12, it can be seen that the value of first and second order natural frequency both decreases with the increase of temperature, and the maximum value mainly coincides with Fig. 11.
Fig. 12Changes of natural frequency with temperature
a) The first order natural frequency
b) The second order natural frequency
4. Heat transfer optimization
4.1. Establishment of response surface model and error calibration
The CCD (Central Composite Design) method [8] is applied to realize discrete data sampling during the optimal design research. It can provide a lot of information about sample variables and sample errors with minimal test cycles, and can more significantly reflect the impact of parameter changes on performance [9]. According to the working requirements of the brake disc, the peak temperature Tmax and mass m are taken as the optimization objectives, and the total thickness ls, ventilation groove height Ds, fin side angle αs and fin number N are taken as the design variables, as shown in Fig. 3. The range of design variables are defined as shown in Table 1. By using the values of the four optimization variables, 145 sample design points (including initial values) in the decision space can be constructed.
Table 1Range of design variable
ls / mm | Ds / mm | αs / ° | N | |
Initial value | 25 | 10 | 3 | 26 |
Upper limit value/lower limit value | 20/30 | 7/13 | 2/4 | 22/30 |
The response surface model is also called the fitting function, which can obtain objective function with discrete data [10]. Because the response of the objective function is not continuous linear with the parameters, it is difficult to express the first order response accurately. Considering that the optimum scale space of the brake disc is relatively small, and the response surface function is relatively weak with the variation of independent variables, the quadratic response expression is selected to represent the fitting function.
Define ls as x1, Ds as x2, αs as x3 and N as x4, the fitting objective function ˆy(x) can be expressed as:
where b0, bi, bij are undetermined regression coefficient.
According to the least square method, the regression analysis of error εcan be obtained:
where yi is actual discrete response value, n is the number of samples.
The formula of regression coefficient is:
Substituting sample data into Eq. (9), Eq. (10) and Eq. (11), then the regression coefficient of fitting function can be solved by Matlab as follows:
+0.32x1x4-4.02x2x3-0.47x2x4-0.66x3x4+1.15x21+2.18x22+7.36x23+0.06024,
where ˆy1(x) is the peak temperature fitting function, ˆy2(x) is the mass fitting function.
The error between the response surface model and the real response model is inevitable, which has a decisive influence on the reliability of the optimal design. In order to ensure the accuracy of the fitting function, it is necessary to verify the fitting accuracy. If the error is within the allowable range, the fitting function has good feasibility. In this paper, the fitting accuracy of response surface function is evaluated by fitting decision coefficient R2, correcting decision coefficient R2adj and root mean square error RMS. The computational formula is shown as follows:
where yi is actual response value of optimization objective, ˉyi is average response value, p is term number of fitting function.
The fitting decision coefficient R2, correcting decision coefficient R2adj and root mean square error RMS of optimization objectives can be calculated as in Table 2. It can be seen that the response surface function has good fitting accuracy and can effectively ensure the reliability of the optimization results.
Table 2Evaluation parameter of error
Error checking parameter / optimization objective | R2 (the ideal value is 1) | R2adj(the ideal value is 1) | RMS (the ideal value is 0) |
Tmax | 0.99598 | 0.99111 | 0.00802 |
m | 0.97894 | 0.95383 | 0.04168 |
4.2. Establishment and solution of optimization mathematical model
In order to improve the efficiency of objective function extremum search, the multi-objective optimization problem of brake disc can be transformed into a single-objective optimization problem [11, 12]. By defining a mass range, the mass objective function can be transformed into a constraint condition. For the constraint condition of the mass m, it is required to search the extremum of the objective function in the range of less than or equal to 9.61 kg. For the constraint condition of the temperature peak Tmax, the screening condition is less than or equal to 298.52 ℃. The objective function and constraint function can be represented respectively as Eq. (18) and Eq. (19):
where X is the design variable matrix; y1(X) is the mass response function; y2(X) is the temperature peak response function; Yt is the initial value of the optimization target calculated for the parameter test sample; x_i is lower limit of design variables; ˉxi is upper limit of design variables (search results of x4 need to be integers).
In the optimization of mathematical models, define y2(X)=f(X), y1(X)-Yt=g(X)≤ 0, then the quadratic programming of objective function and constraint condition at iteration point can be expressed as matrix form by Taylor expansion [13] as follows:
B=[g1(XK),...,gp(XK)].
The constraints of the optimal mathematical model are transformed from quadratic function to linear function, and the solution of the optimal solution problem can be solved through the one-dimensional search in the SK direction [14].
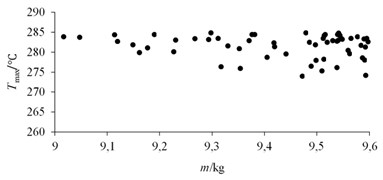
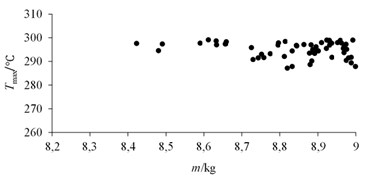
Through continuous iteration operation, the Pareto solution sets [15] of temperature peaks in different mass ranges can be obtained as in Fig. 13.
Fig. 13Pareto solution of objective function in different mass ranges
a) 9 < m ≤ 9.6
b)m ≤ 9
Six sets of typical solutions are selected, and the transient heat transfer finite element analysis is carried out according to these different design variables. The optimal value of response surface function and the validation value of finite element model are obtained as in Table 3.
Table 3Results of comparison between fitting function and FEA model
Number | Calculation type | ls / mm | αs / ° | Ds / mm | n | Tmax / ℃ | Calculation error of fitting function / % |
1 | Fitting function | 24.02 | 2.29 | 8.26 | 30 | 274.013 | 0.7 |
FEA model | 276.36 | ||||||
2 | Fitting function | 24.56 | 2.08 | 8.16 | 26 | 277.983 | 0.8 |
FEA model | 282.20 | ||||||
3 | Fitting function | 22.87 | 3.47 | 8.38 | 30 | 279.678 | 1.4 |
FEA model | 275.32 | ||||||
4 | Fitting function | 22.76 | 2.16 | 8.05 | 30 | 287.252 | 1.0 |
FEA model | 284.76 | ||||||
5 | Fitting function | 23.48 | 2.23 | 8.25 | 26 | 289.442 | 0.3 |
FEA model | 290.83 | ||||||
6 | Fitting function | 22.55 | 3.00 | 8.80 | 30 | 291.760 | 1.0 |
FEA model | 288.86 |
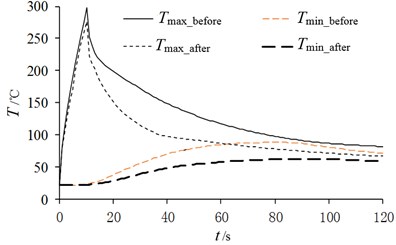
Take the first optimization result (Number 1 in Table 3) as the analysis object, the variation characteristics of the maximum and minimum temperatures can be shown in Fig. 14. It can be seen that the optimized structure is more conducive to heat transfer than the initial parameters, especially when the heat flow load is relieved, the temperature drop speed increases significantly, thus promoting the heat dissipation efficiency of the brake disc. It can shorten the time of continuous high temperature stage and effectively enhance the reliability of continuous braking. From Fig. 14, it also can be seen that the time with temperature above 120 ℃ is reduced by 46 %, the heat dissipation capacity is significantly improved.
Fig. 14Comparison of temperature before and after optimization
5. Comparison of brake noise characteristics before and after optimization
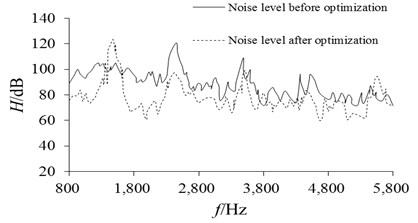
Using the same method to test the noise level of the optimized brake, and through the Fourier transform and filtering processing of the time-domain data, the noise level comparison results before and after optimization can be obtained as shown in Fig. 15. It can be seen that the noise level can be significantly reduced after structural optimization except the first order natural frequency, and the average noise level was reduced by 12.5 %. However, the general trend of change is similar, and the frequency corresponding to the peak noise varies little.
Fig. 15Comparison of noise level before and after optimization
6. Conclusions
The braking noise that closely related to the heat transfer characteristics could be effectively reduced by heat transfer optimization. Thus, it can be seen, heat transfer optimization is quite an important and necessary research topic. According to NVH test, the relationship between noise level and temperature and excitation frequency can be obtained. Meanwhile, the relationship between natural frequency and temperature can be get based on modal FEA analysis that considering thermal expansion. Through the advanced and reasonable optimization calculation for brake disc heat transfer, the heat dissipation efficiency can be promoted evidently with no mass addition and less resonance frequency variation. From the research results, it also can be proved that the heat transfer characteristics are the key factor that affects noise level, but not the only factor.
References
-
Palmer E., Mishra R., Fieldhouse J. Analysis of air flow and heat dissipation from a high performance passenger car front brake rotor. University of Huddersfield, Vol. 215, 2006, p. 1219-1228.
-
Renaud F., Chevallier G., Dion J. L. Motion capture of a pad measured with accelerometers during squeal noise in a real brake system. Mechanical Systems and Signal Processing, Vol. 33, 2012, p. 155-166.
-
Yang S., Yin Y., Bao J. Research status on frictional vibration and noise of mechanical brake. Recent Patents on Mechanical Engineering, Vol. 10, 2017, p. 120-131.
-
Liu D. X., Wang L. N., Han J. Selection research in automotive friction materials test equipment. Journal of Testing Technology, Vol. 3, 2016, p. 215-220.
-
Mcphee A. D., Johnson D. A. Experimental heat transfer and flow analysis of a vented brake rotor. International Journal of Thermal Sciences, Vol. 47, 2008, p. 458-467.
-
Dong F., Guo G. L. Diesel engine cooling water cavity structure optimization analysis based on the heat flow directly coupling method. Civil Engineering Technology, Vol. 3, 2015, p. 77-84.
-
Cho C., Ahn S. Transient thermoelastic analysis of disk brake using the fast Fourier transform and finite element method. Thermal Stresses, Vol. 25, 2002, p. 215-220.
-
Chakraborty S., Sen A. Adaptive response surface based efficient finite element model updating. Finite Elements in Analysis and Design, Vol. 80, 2014, p. 33-40.
-
Fang S. E., Zhang Q. H., Ren W. X. An interval model updating strategy using interval response surface models. Mechanical Systems and Signal Processing, Vol. 60, Issue 61, 2015, p. 909-927.
-
Deb K., Gupta H. Introducing robustness in multi-objective optimization. Evolutionary Computation, Vol. 14, 2014, p. 463-494.
-
Mohanty C. P. Studies on some aspects of multi-objective optimization: a case study of electrical discharge machining process. Journal of the Electrochemical Society, Vol. 146, 2015, p. 3295-3299.
-
Attar P. J., Dowell E. H. Stochastic analysis of a nonlinear aeroelastic model using the response surface method. Journal of Aircraft, Vol. 43, 2015, p. 1044-1052.
-
Wang X. F. SQP algorithms in balancing rotating machinery. Mechanical Systems and Signal Processing, Vol. 21, 2007, p. 1469-1478.
-
Duan H. J., Tao H. Random vibration isolation and parameter optimization on two-stage vibration isolation system in vehicle. Noise and Vibration Control, Vol. 3, 2007, p. 79-82.
-
Ch Shi P., Li W. J. Mounting system optimization based on vibration transmissibility and energy decoupling. Advanced Manufacturing Technology, Vol. 26, 2009, p. 16-21.
About this article
The paper is supported by Doctoral Research Fund (2017Y22), National Natural Science Foundation of China (51705028) and Shandong Natural Science Foundation (ZR2016EEB36).

