Abstract
In this paper, we propose an effective mechanical-electrical-hydraulic-interfacial coupling vibration model for hot rolling mills and obtain a practical measure to relieve mill vibration. First, an experiment related to mill modulus control gain in automatic gauge control (AGC) is carried out during manufacturing. Rolling mill vibration is observed to gradually be enhanced with increasing mill modulus control gain. Then, to explain this phenomenon, the mechanical-electrical-hydraulic-interface coupling dynamic model is modeled based on Sims’ rolling force method. Finally, we analyze the influence of mill modulus control gain on the vibration numerically on the basis of the coupling dynamic model. Moreover, the agreement between the experiment result and the simulation result is confirmed and the measure reducing the mill modulus control gain is obtained to relieve mill vibration.
1. Introduction
The mill vibration has become a bottleneck in the thin steel strip manufacturing [1, 2], as the mill vibration can cause unacceptable product quality degradation in the steel strip, and even severely damage the mill equipment [3, 4]. Therefore, damping rolling mill vibration has become a very important objective in the rolling industry.
To obtain an in-depth understanding of mill vibration, a large number of mathematic models with various degrees of simplification have been proposed. Many researchers think that rolling mill vibration is a kind of self-excited vibration. Tlusty et al. [5] proposed a basic theory of chatter in cold rolling based on the influence of the variable strip tension on the rolling force and on the variations in contact length. They concluded that the rolling force variation caused by the rate of change of the exit strip thickness would lag the vibration displacement by 90°, which results in a negative damper. However, they considered only the effect of the change in the roll gap spacing on rolling force and on rolling torque. Yun et al. [6-8] proposed a dynamic model that takes into account the effect of both the change in the roll gap spacing and the rate of change of the roll gap spacing on the rolling force and on the rolling torque. However, in their model, the forward slip and the backward slip, which are not measured or controlled directly, must be known beforehand to calculate the rolling force. As a result, the calculated result is not accurate. Improving on the dynamic model from Yun, Hu et al. [9-12] proposed a new rolling process dynamic model that took strip tensions at entry and exit, strip thickness at entry, roll gap spacing and its rate of change, horizontal displacement of the rolls and its rate of change, and roll peripheral velocity as dynamic system inputs and regarded vertical rolling force, horizontal force, rolling torque, and strip velocity at entry and exit as outputs. This choice is more reasonable from the standpoint of the manufacturing conditions in industrial rolling mills. Zhao et al. [13] established a state-space model and proposed a stability criterion in terms of a negative damping mechanism.
However, the rolling mill is a complex and large machinery equipment which consists of various subsystems, such as mechanical, electrical, hydraulic and interfacial subsystems [14]. Moreover, there are various degrees of coupling effects between these subsystems [15]. The above-mentioned mathematic models include only mechanical and interfacial subsystems and give no considerations to the hydraulic and the electrical subsystems.
In the published literature, there are few researchers who refer to the coupling effect among the control subsystem, the hydraulic subsystem and the rolling mill vibration. Xu et al. [16, 17] proposed a dynamic model coupled with the rolling process, the roll system, the mill rack and the hydraulic servo system and designed a robust controller based on the quantitative feedback theory. Ling [18] established a mechanical-electrical-hydraulic coupling dynamic model and optimized the control system parameter to obtain the lowest vibration intensity. Gao [19] designed proportional-integral-derivative (PID) control with a low-pass filter to suppress the vibration, by means of cutting off the delivery of the dominant vibration frequency in a closed-loop control system.
However, in those studies, the control system includes only hydraulic automatic position control (HAPC) and not automatic gauge control (AGC). AGC is also an important part of the control system [20] and the influence of AGC on rolling mill vertical vibration should be considered [21].
In this paper, we study the influence of mill modulus control gain of AGC on the vibration in hot rolling mills. Firstly, a coupling dynamic mathematic model of hot rolling mill vibration, which includes the roll system, the mill rack, the hydraulic subsystem, automatic position control (APC), mill modulus control AGC and rolling process, is proposed. On basis of this coupling dynamic model, the influence of mill modulus control AGC on rolling mill vertical vibration is investigated using numerical simulation. In addition, an experiment related to mill modulus control gain is carried out during manufacturing and the agreement between the experiment result and the simulation result is confirmed and the measure reducing the mill modulus control gain is obtained to relieve mill vibration.
2. Experiment
To research the coupling effect among mechanical, electrical, hydraulic and interfacial subsystems, an experiment related to mill modulus control gain is carried out during manufacturing. The experimental equipment is shown in Fig. 1(a) and the layout of rolling mill is shown in Fig. 1(b). They are 4-high hot tandem rolling mill. Vibration velocity sensors are installed on the top surface of every mill rack to long-term monitor mill vibrations.
Fig. 1Experiment equipment and layout of rolling mill
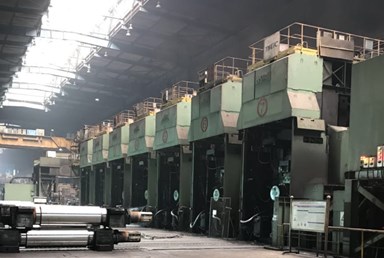
a)
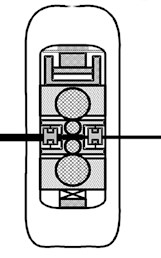
b)
The mill modulus control gain is set as 0.4, 0.6 or 0.8 with the same other conditions, and each gain value is applied to six coils. A few seconds of vibration data at the steady rolling speed are used to calculate the virtual value of the vibration velocity.
Because the dominant frequency is not always a single frequency, the vibration amplitude is not suitable to evaluate the vibration intensity. The virtual value of vibration velocity on behalf of vibration energy is used to evaluate the vibration intensity. The virtual value of vibration velocity is calculated by:
where N is the number of data; x(n) is the discrete test data.
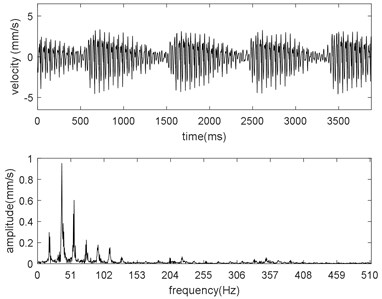
The time-domain and frequency-domain graphs for different mill modulus control gains are shown in Fig. 2. From Fig. 2, the vibration is multi-frequency. We count the vibration amplitude for different frequency. These counted data are fitted with spline and the fitting result is shown in Fig. 3(a). Moreover, the relation between the virtual value of vibration velocity and the mill modulus control gain is presented in Fig. 3(b).
Fig. 2Time-domain and frequency-domain graphs with different mill modulus control gains: a) α= 0.4, b) α= 0.6, c) α= 0.8
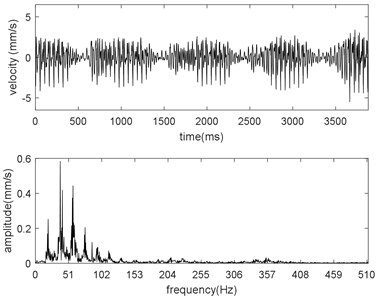
a)
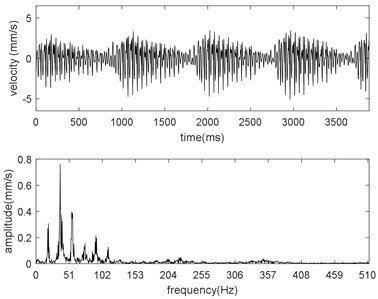
b)
c)
From Figs. 2 and 3(a), we can see that in low-frequency range (approximate 10 Hz), amplitude increases with decreasing mill modulus control gain due to the positive compensation; in mid-frequency range (approximate 40 Hz), amplitude increases with increasing mill modulus control gain due to the negative compensation; in high-frequency range (more than 55 Hz), there are no obvious positive correlation between the amplitude and the mill modulus control gain, and as the frequency increases furtherly the vibration amplitude tends to be equal due to the disappearance of compensation.
Fig. 3(b) clearly indicates that rolling mill vibration is gradually enhanced with increasing mill modulus control gain. To investigate this phenomenon, a coupling dynamic model including the roll system, the mill rack, the hydraulic subsystem, APC, mill modulus control AGC and rolling process is modeled and numerically analyzed.
Fig. 3Analysis of the experiment result
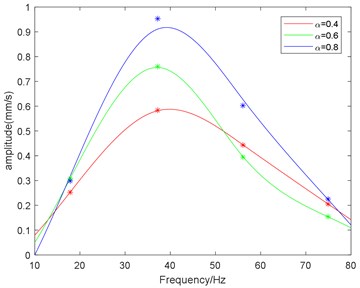
a) Fitting curves of the amplitude-frequency relation
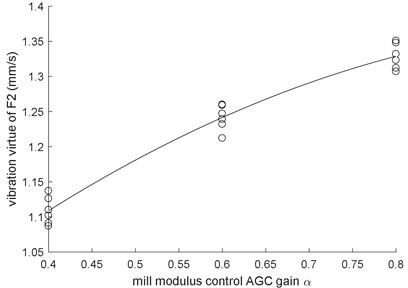
b) Relation between the virtual value of vibration velocity and the mill modulus control gain
3. Coupling dynamic model of rolling mill vibration
3.1. Mathematic model of rolling process
The slab method is one of the most widely used methods to describe the plastic deformation of rolled materials. Sims derived the specific roll force equation, which is often applied in hot rolling mills. In this section, based on Sims’ rolling force model, a dynamic rolling process model with vibration is proposed.
3.1.1. Strip entry and exit position
The roll bite geometry with vibration is illustrated in Fig. 4. It is assumed that the exit plane does not coincide with the centerline of work rolls once the rolls begin to vibrate. In addition, work rolls vibrate out of phase.
Fig. 4Roll bite geometry with vibration
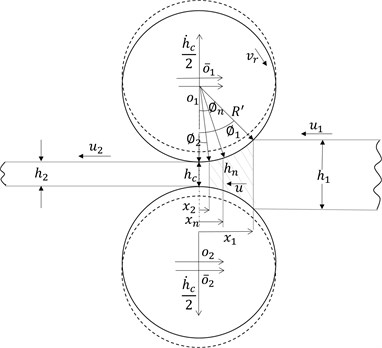
ˉo1 and ˉo2 are the original work roll centers; o1 and o2 the work roll centers with vibration; h1, h2 and hn are the strip entry thickness, the strip exit thickness and the strip thickness of the neutral plane, respectively; x1, x2 and xn are the strip entry position, the strip exit position and the neutral point position, respectively; R' is the deformed radius of the work roll; u1 and u2 are the strip speed at entry and exit, respectively; ϕ1, ϕ2 and ϕn are the strip entry angle, the strip exit angle and the neutral angle, respectively; vr is the roll speed; hc is the roll gap spacing along the centerline of the work rolls; and ˙hc is the rate of change of the roll gap spacing.
The high rolling force causes the work roll deformation. According to the Hitchcock equation, the deformed radius is calculated as follows:
where R is the undeformed radius of the work roll; ν is Poisson’s ratio; E is the Young’s modulus; and FR is the total rolling force.
In the roll bite, the roll surface is usually assumed to be a parabolic curve. From Fig. 4, the strip thickness at an arbitrary cross-section can be calculated by:
By combining Eq. (3), x1=R'sin(ϕ1) and sin(ϕ1)≈ϕ1, the strip entry angle can be derived from:
By applying the principle of mass conservation to the roll bite, the flow of metal through an arbitrary cross-section can be written as:
By applying Eq. (5) to the neutral point position and the exit position, the corresponding mass conservation equations are listed as:
From Fig. 4, the following equation can be found:
By substituting Eq. (3) and Eq. (6) into Eq. (7), the strip exit angle can be obtained:
3.1.2. Neutral point position
Hot rolling mills roll with low tension which can be neglected. The stress distribution in a volume element in the roll gap is illustrated in Fig. 5, where the circumferential thickness of the slice is dϕ; the horizontal composite force acting on a cross-section is Q; the normal roll pressure is pϕ; the specific shear stress is τϕ; and the surface angularity is ϕ.
Fig. 5Stresses distribution acting on a volume element in the roll gap
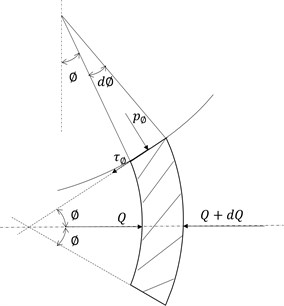
According to Sims’ method, the horizontal force equilibrium equation can be derived as:
where the constant k is the deformation resistance of the arc of contact.
Eq. (9) is solved by starting at the plane of exit and extending towards the plane of entry. Thus, the normal roll pressure between the exit position and the neutral point position is obtained:
Eq. (9) is solved by starting at the plane of entry and extending towards the plane of exit. Thus, the normal roll pressure between the entry position and the neutral point position is obtained:
The neutral angle can be calculated by the equalization of the normal roll pressure obtained from Eq. (10) and Eq. (11) at the neutral point:
3.1.3. Calculating roll force
Because the angular coordinate ϕ is small, the differences between the normal roll pressure and the vertical pressure are negligible. When plane deformation occurs, the roll force can be calculated by:
where w is the width of strip steel.
By substituting Eq. (10) and Eq. (11) into Eq. (13), the roll force can be derived as:
+12ln(h1h2)+ln(h2hn)].
3.1.4. Linearized dynamic model of the rolling process
Since the vibration is dynamic rather than static, the variations in system parameters are more important. The first-order Taylor approximation can be used to linearize the dynamic model.
The variation in strip entry thickness dh1, the variation in roll gap spacing dhc and the rate of change of roll gap spacing d˙hc are defined as inputs, and the variation in roll force dFR is defined as an output.
From Eq. (14), the variation in roll force dFR can be expressed as:
3.2. Dynamic model of mill structure
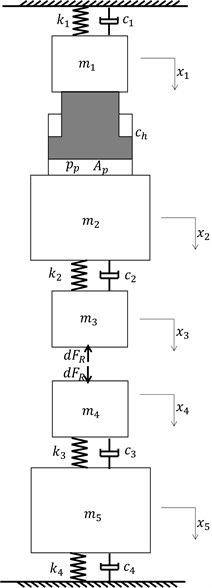
The lumped-mass model is suitable for our research purpose. To balance the trade-off between full consideration and facilitative study, the mill structure, which includes the rack, rollers and hydraulic cylinder, is described as a 5-dof (five degrees of freedom) lumped-mass model. Notably, the up back roll and the cylinder body are assumed as a whole, and the piston rod and the mill rack are assumed as a whole. As the servo valve only adjusts the pressure of piston side, and does not change the pressure of rod side, then which can be assumed to be constant. In addition, the lower part of the rack is assumed to be the ground. The schematic diagram of the mill structure is depicted in Fig. 6.
To study the vibration only dynamic parts of parameters are considered in our model. According to the vibration and the fluid theory, the kinetic equations of the mill structure are written as follows:
where m1 and x1 are the equivalent mass and the displacement of the rack, respectively; m2 and x2 are the equivalent mass and the displacement of the up back roll, respectively; m3 and x3 are the equivalent mass and the displacement of the up work roll, respectively; m4 and x4 are the equivalent mass and the displacement of the bottom work roll, respectively; m5 and x5 are the equivalent mass and the displacement of the bottom back roll, respectively; k1 and c1 are the equivalent stiffness and damping, respectively, between the rack and the ground; k2 and c2 are the equivalent stiffness and damping, respectively, between the up work roll and the up back roll; k3 and c3 are the equivalent stiffness and damping, respectively, between the bottom work roll and the bottom back roll; k4 and c4 are the equivalent stiffness and damping, respectively, between the bottom back roll and the ground; Ap is the area of the piston side; pp is the pressure of the piston side; ch is the internal leakage coefficient of the cylinder; and dFR is the dynamic part of the vertical rolling force.
The dynamic roll force from the rolling process acts on the work rolls and causes them to vibrate. The vibration of the work roll reacts to the rolling process. Therefore, there is coupling effect between the rolling process and the structure of rolling mill. The coupling relationship between the work roll vibration and the dynamic roll gap spacing is shown as follows:
Fig. 6Schematic diagram of mill structure
3.3. Hydraulic servo system model
The hydraulic servo system is an important component to adjust the delivery thickness. The dynamic response of a hydraulic servo system is a determinant of gauge control and plays an important role in rolling mill vibration due to the closed-loop control system. Therefore, in the rolling mill vibration, it is necessary to take into account the hydraulic servo system. In general, the hydraulic servo system consists of a double-acting single-rod hydraulic cylinder and a three-position four-way spool valve as shown in Fig. 7.
During rolling, the servo valve always works near zero. Thus, the variation in variable is equal to the absolute variation. Furthermore, the bandwidth of the hydraulic AGC system is approximately 15-20 Hz. As a consequence, the dynamic response of the servo valve can be described as a second-order system:
where Q is the flow of the servo valve; I is the input current of the servo valve; Kv is the amplification gain of the servo valve; ξv is the damping ratio of the servo valve; Wv is the natural frequency of the servo valve; s is the complex frequency.
Fig. 7Diagram of hydraulic servo system
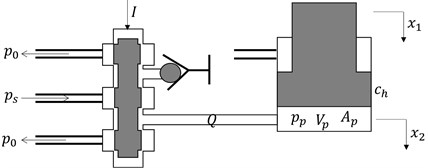
As the servo valve only adjusts the pressure of piston side, and does not change the pressure of rod side, then which can be assumed to be constant. The flow continuity equation is applied to the piston side and can be written as follows:
where Vp is the volume of the piston cavity; βe is the elastic modulus of the liquid; and ch is the internal leakage coefficient of cylinder; Ap is the area of the piston side; pp is the pressure of the piston side; Q is the flow of the servo valve; x1 is the displacement of the rack; x2 is the displacement of the up back roll.
3.4. Overview of coupling dynamic model
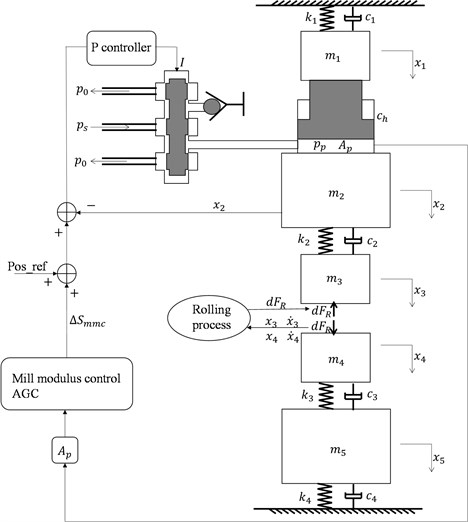
The roll system, the hydraulic servo system, the rolling process and the control system constitute the coupling dynamic model, which is depicted in Fig. 8.
In Fig. 8, there are two closed loops. The inner control loop is HAPC, and the outer control loop is mill modulus control AGC. The mill modulus control modifies the gap position to maintain a constant delivery strip thickness from each stand and uses the gauge meter equation to estimate change in the stand exit strip thickness [22]. Thus, the mill modulus control equation can be expressed as:
where K is the natural mill modulus and α is the mill modulus control gain.
The mill modulus control modifies the modulus of the mill according to the dynamic rolling force. The modified modulus of the mill can be expressed as:
when α< 0, the modified mill modulus is less than the natural mill modulus. When α> 0, the mill modified modulus is greater than the natural mill modulus. To ensure that the system remains stable, the mill modulus control gain α must be limited in (-K+QQ,K+QQ), where Q is the plasticity coefficient.
Fig. 8Diagram of the coupling dynamic model
4. Numerical analysis and discussion
4.1. Model validity
MATLAB/SIMULINK software is used to simulate the mill vibration based on the coupling model mentioned above. The standard parameter conditions of F2 (the second finish rolling stand), which correspond to SPA-H with a 1.52 mm exit thickness of F7 (SPA-H (1.52 mm)), are listed in Table 1.
Table 1Standard parameters conditions for the simulation
Parameter | Value | Parameter | Value |
R | 0.375 m | βe | 1.4×10⁹ Pa |
vr | 2.89 m/s | Vp | 3.46×10⁻² m3 |
E | 2.06×10¹¹ N/m2 | ch | 5×10-14 m3/(s.Pa) |
ν | 0.3 | m1 | 1×10⁴ kg |
h1 | 16.62 mm | m2 | 3.6×10⁴ kg |
h2 | 8.17mm | m3 | 2×10⁴ kg |
k | 201×106 N/m2 | m4 | 2×10⁴ kg |
k1 | 4×10⁹ N/m | m5 | 3.5×10⁴ kg |
k2 | 2×10¹⁰ N/m | c1 | 5×10⁶ N/(m/s) |
k3 | 2×10¹⁰ N/m | c2 | 2×10⁶ N/(m/s) |
k4 | 4×10⁹ N/m | c3 | 2×10⁶ N/(m/s) |
Ap | 0.8659 m2 | c4 | 5×10⁶ N/(m/s) |
Kv | 0.059 m3/(s.A) | K | 2×10¹⁰ N/m |
Wv | 320 rad/s | ki | 0 |
ξv | 0.7 | kp | 1200 |
On the one hand, because the system response is very important for the control system, the step response and system bandwidth of the coupling model can be a proof of the model validity. The Pos_ref is assumed as the system input, and the up back roll displacement is assumed as the system output. It is examined with a 20 μm step input, and the calculated step response is shown in Fig. 9. To obtain the system response bandwidth, the Bode diagram from Pos_ref to the up back roll displacement is depicted in Fig. 10.
Fig. 9Step response of back roll displacement
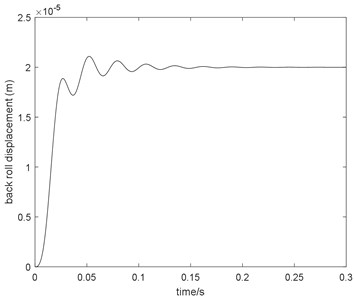
Fig. 10Bode diagram from Pos_ref to up back roll displacement
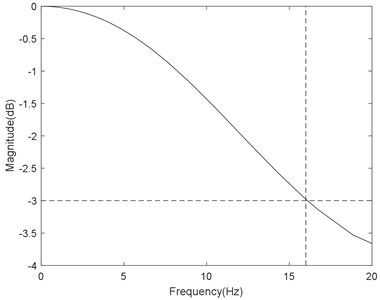
From Fig. 9, it is obvious that the settling time of the step response is approximately 60 ms. In general, the bandwidth is 15-20 Hz. From Fig. 10, the response bandwidth from Pos_ref to the up back roll displacement is approximately 16 Hz, which is identical to the field value.
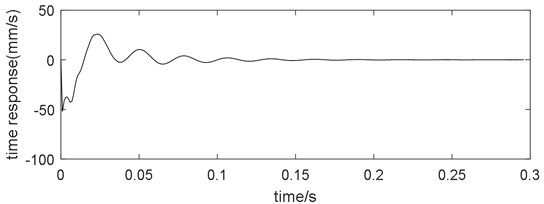
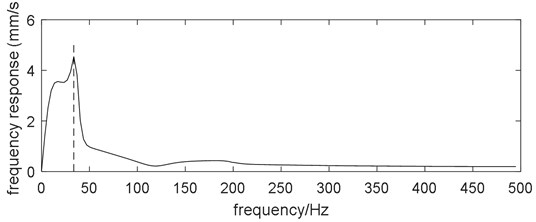
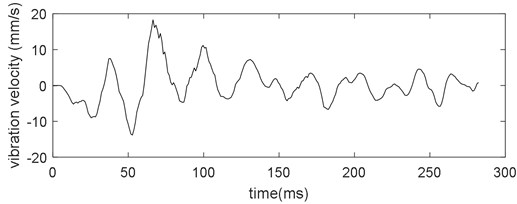
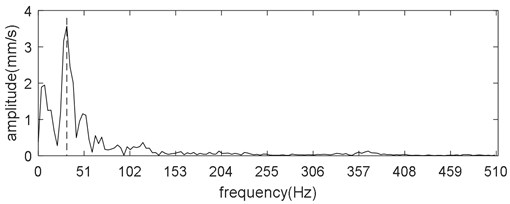
On the other hand, the threading response is also treated as proof of the model validity. Under standard parameters, the threading response of the vibration velocity of the up work roll is shown in Fig. 11. From Fig. 11, the dominant frequency is 33.7 Hz. The threading response of F2 when rolling SPA-H (1.52 mm) during field manufacturing is shown in Fig. 12. From Fig. 12, the dominant frequency is 32 Hz, which is roughly consistent with the numerical result.
Fig. 11Threading response of the coupling dynamic model with the standard parameters
a)
b)
Fig. 12Threading response of F2 when rolling SPA-H (1.52 mm) during field manufacturing
a)
b)
4.2. Application of coupling vibration model
To facilitate the research, a harmonic disturbance must be introduced into the coupling dynamic model. Let us assume that the incoming thickness harmonic deviation is the harmonic disturbance. The influence of the mill modulus control gain α in AGC on mill vibration is studied. The vibration velocity of the work roll is used as a criterion to evaluate mill vibrations.
Let us assume that the amplitude of the incoming thickness harmonic deviation is 40 μm and the frequency is 35 Hz. The simulation time is set as 1 s, and the mill modulus control gain is equal to 0.8. Furthermore, the mill modulus control AGC is OFF at the beginning and switches to ON at 0.5 s. The comparison between AGC ON and OFF is shown in Fig. 13.
From Fig. 13, we can see that when the mill modulus control AGC is OFF, the vibration velocity amplitude of the up work roll is 1.82 mm/s. Moreover, when the mill modulus control AGC is ON, the vibration velocity amplitude of the up work roll is 2 mm/s. The increase in the vibration velocity amplitude of the up work roll is 10 %. This phenomenon that the vibration of up work roll is increased with mill modulus control gain agrees qualitatively with the experiment result in section 2.
Fig. 13Comparison between AGC ON and OFF when α= 0.8
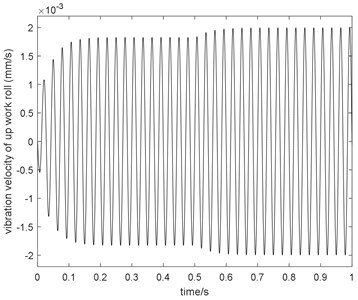
Fig. 14Comparison between AGC ON and OFF when α= –0.8
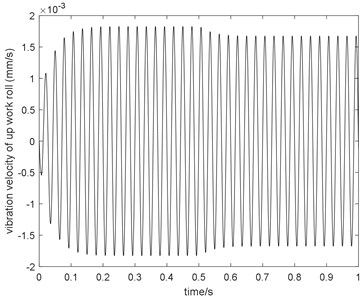
The comparison between AGC ON and OFF when α= –0.8 is shown in Fig. 14. Fig. 14 shows that, the vibration velocity amplitude of the work roll is 1.82 mm/s when the mill modulus control AGC is OFF and that the vibration velocity amplitude of the work roll is 1.67 mm/s when the mill modulus control AGC is ON. The reduction in the vibration velocity amplitude of the work roll is 8.2 %.
To research the dynamic response of the vibration velocity of the work roll to various excitation frequencies, the transfer function from the strip thickness at the entry to the vibration velocity of the work roll is derived, and its magnitude spectrum is shown in Fig. 15.
Fig. 15Magnitude spectrum from the strip thickness at entry to the vibration velocity of the work roll
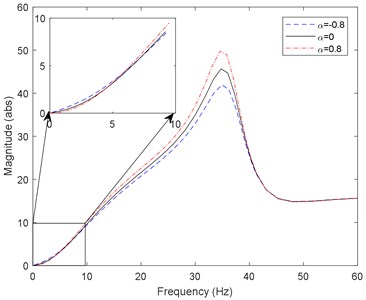
Fig. 15 shows that in the low-frequency range, magnitude is reduced with an increase in mill modulus control gain; in the mid-frequency range, magnitude is increased with an increase in mill modulus control gain; and in the high-frequency range, mill modulus control gain has little effect on magnitude. The phenomenon can be explained as follows. For α= 0.8, the compensation of mill modulus control AGC has low-frequency attenuation characteristics; that is, mill modulus control AGC can remove the low-frequency incoming thickness deviation. The dynamic response of mill modulus control AGC presents a phase lag as the frequency of the incoming thickness deviation increases, which reverses compensation of mill modulus control AGC and increases vibration. As the frequency of the incoming thickness deviation increases further, it will exceed the mill modulus control AGC dynamic response capabilities, which results in noncompensated mill modulus control AGC performance. For α= –0.8, the situation is contrary to that for α= 0.8. Notably, the frequency of the cross-point is 5-7 Hz, which is less than half of the bandwidth. In addition, the mid-frequency range which is more than the system bandwidth can still be affected by the mill modulus control gain, which indicates that the vibration frequency which the control system can affect is more than the system bandwidth.
Comparing Fig. 2 and Figs. 13 and 14, we can see that there is a great difference, that is, the experiment result is characteristic by multiple frequency and the numerical result is characteristic by single frequency. This is because that the real system is nonlinear and the simulation model is linear. But this difference does not affect the research on key issue, i.e., the influence of mill modulus control gain. Comparing Fig. 3(a) and Fig. 15, we can see that there are some quantitative differences, but the influence of mill modulus control gain on mill vibration is qualitatively the same. The effect of mill modulus control gain on hot rolling mill vibration is positive compensation, negative compensation and no compensation, respectively.
Based on the above analysis, a practical measure to relieve mill vibration can be proposed. The vibration frequency for the hot rolling mill in general is 10-70 Hz. As a result, the vibration increases with mill modulus control AGC gain for the large sensitivity frequency range of hot rolling mills. For these frequencies, the mill modulus control gain can be decreased to relieve mill vibration.
5. Conclusions
In this paper, a coupling vibration model including mechanical, electrical, hydraulic and interfacial subsystems is established and the influence of mill modulus control AGC gain on mill vibration is qualitatively analyzed. Some conclusion are obtained as follow:
1) An effective coupling dynamic model is established based on Sims’ rolling force method and can be used to study hot rolling mill vibration.
2) The mechanical-electrical-hydraulic coupling vibration does exist in rolling mill vibrations. In other words, control system parameters can influence mechanical system vibration through hydraulic system.
3) A practical measure to suppress rolling vibration is proposed. For the large sensitivity frequency range of hot rolling mills, the mill modulus control AGC gain can be decreased to relieve mill vibration.
References
-
Peng Y., Zhang M., Sun J., Zhang Y. Experimental and numerical investigation on the roll system swing vibration characteristics of a hot rolling mill. ISIJ International, Vol. 57, 2017, p. 1567-1576.
-
Gao Z., Zang Y., Zeng L. Review of modelling and theoretical studies on chatter in the rolling mills. Journal of Mechanical Engineering, Vol. 51, Issue 87, 2015, p. 105-112.
-
Niroomand M. R., Forouzan M. R., Salimi M. Theoretical and experimental analysis of chatter in tandem cold rolling mills based on wave propagation theory. ISIJ International, Vol. 55, 2015, p. 637-646.
-
Yan X., Sun Z., Chen W. Vibration control in thin slab hot strip mills. Ironmaking and Steelmaking, Vol. 38, 2013, p. 309-313.
-
Tlusty J., Chandra G., Critchley S., Paton D. Chatter in cold rolling. Annals of the CIRP, Vol. 31, 1982, p. 195-199.
-
Yun I. S., Ehmann K. F., Wilson W. R. D. Chatter in the strip rolling process, part 1: dynamic model of rolling. Journal of Manufacturing Science and Engineering, Vol. 120, 1998, p. 330-336.
-
Yun I. S., Ehmann K. F., Wilson W. R. D. Chatter in the strip rolling process, part 2: dynamic rolling experiments. Journal of Manufacturing Science and Engineering, Vol. 120, 1998, p. 337-342.
-
Yun I. S., Ehmann K. F., Wilson W. R. D. Chatter in the strip rolling process, part 3: chatter model. Journal of Manufacturing Science and Engineering, Vol. 120, 1998, p. 343-348.
-
Hu P. H., Ehmann K. F. A dynamic model of the rolling process. Part I: homogeneous model. International Journal of Machine Tools and Manufacture, Vol. 40, Issue 1, 2000, p. 1-19.
-
Hu P., Zhao H., Ehmann K. F. Third-octave-mode chatter in rolling. Part 1: chatter model. Proceedings of the Institution of Mechanical Engineers, Part B: Journal of Engineering Manufacture, Vol. 220, 2006, p. 1267-1277.
-
Hu P., Zhao H., Ehmann K. F. Third-octave-mode chatter in rolling. Part 2: stability of a single-stand mill. Proceedings of the Institution of Mechanical Engineers, Part B: Journal of Engineering Manufacture, Vol. 220, 2006, p. 1279-1292.
-
Hu P., Zhao H., Ehmann K. F. Third-octave-mode chatter in rolling. Part 3: stability of a multi-stand mill. Proceedings of the Institution of Mechanical Engineers, Part B: Journal of Engineering Manufacture, Vol. 220, 2006, p. 1293-1303.
-
Zhao H., Ehmann K. F. Stability analysis of chatter in tandem rolling mills – part 1: single- and multi-stand negative damping effect. Journal of Manufacturing Science and Engineering, Vol. 135, Issue 3, 2013, p. 031001.
-
Zhong J. Coupling Design Theory and Methods of Complex Electromechanical Systems. China Machine Press, Beijing, 2007.
-
Yan X. Machinery-electric-hydraulic coupling vibration control of hot continuous rolling mills. Journal of Mechanical Engineering, Vol. 47, 2011, p. 61-65.
-
Yang Xu, et al. Coupling dynamic model of chatter for cold rolling. Journal of Iron and Steel Research International, Vol. 17, Issue 12, 2010, p. 30-34.
-
Yang X., Tong C. Coupling dynamic model and control of chatter in cold rolling. Journal of Dynamic Systems, Measurement, and Control, Vol. 134, 2012, p. 041001.
-
Ling Q., Zhao Q., Wang X., Wang X. Control parameter optimization of a hydraulic-mechanical coupling system of hot strip tandem mill. Journal of Vibration and Shock, Vol. 36, 2017, p. 73-78.
-
Gao Y., Jin B., Zhang H. The vibration mechanism caused by external disturbance and suppression method of the rolling mill system. Energy Education Science and Technology, Vol. 31, 2013, p. 2623-2626.
-
Fang-Chen Y., Jie S., Dian-Hua Z., Geng-Sheng M. Sliding mode variable structure control for smith prediction monitoring AGC system based on double power reaching law. Journal of the Brazilian Society of Mechanical Sciences and Engineering, Vol. 38, 2016, p. 1731-1743.
-
Xiaoqiang Y., Miao B., Guanghong Z., Zehong S. Research on the Impact of AGC vibration on the horizontal vibration of the roll system for CSP rolling mill. Advanced Materials Research, Vol. 139, 2010, p. 2409-2412.
-
Fei Z., Yongjun Z., Handan C. Automatic gauge control of plate rolling mill. IJCA, Vol. 9, 2016, p. 143-156.

