Abstract
Eukaryotic cells have a protective plasma membrane, which restricts the free movement of molecules from the external environment to the internal environment. This study aims to computationally model the transport of fluorescein derivatives across the monolayer of human brain microvascular endothelial cells (HBMEC). The determination of plausible effective diffusion constants (Deff) will allow models to be built that could be useful beyond in vitro experimentation. Fluorescein-5-isothiocyanate (FITC) modeling produced a Deff range of 1E-20 to 5E-20 cm2/s at a 1 µm cell monolayer thickness and a Deff constant near 5E-29 cm2/s at a 5 µm cell monolayer thickness. Both fluorescein and sodium fluorescein (NaFl) modeling at the 1 and 5 µm thicknesses did not produce simulations that closely resembled the HBMEC in vitro model. Overall, it is possible that the fluorescent intensity noted with fluorescein and NaFl may be better explained by a mechanism other than passive diffusion. Simulations of FITC diffusion produced a narrow range of Deff constants that closely matched the in vitro HBMEC fluorescent intensity.
1. Introduction
Eukaryotic cells are enclosed in a plasma membrane which separates the external and internal environments that serves as protection for the cells. The lipid bilayer of the plasma membrane is composed of hydrophilic head groups which are directed towards the aqueous exterior and interior portions of cells and hydrophobic tails separating the hydrophilic groups. The plasma membrane is mostly composed of lipids and proteins that help it form a barrier around the cell’s internal environment [1-3].
Isothiocyanates (ITCs) are small molecules found in vegetables that are capable of binding to amino groups and proteins and passively diffusion through gastrointestinal epithelium and capillary endothelium [4, 5]. Phenethyl isothiocyanate (PEITC) has been shown to be absorbed into human non-small lung carcinoma (A549) cells and ITCs bind to thiol groups at a faster rate compared to amino groups under basic conditions [6-9]. Research on the cellular accumulation of ITCs have found that the uptake was dependent on intracellular levels of glutathione (GSH) and not dependent on the lipophilicity [10-12].
Fluorescein-5-isothiocyanate (FITC, Isomer I) is a fluorescein fluorochrome conjugated to an isothiocyanate (ITC) that covalently binds to proteins and amine groups. When the pH is raised to an alkaline environment, the covalent bonding is stronger than at physiologic pH [13-15]. FITC has been shown to incorporate into the lipid layer and bind to membrane proteins of baby hamster kidney fibroblast (BHK) cells [16, 17] and has been shown to label B and T lymphocytes differently as well bind to internal components of these cells [18, 19]. Labeling of cells using FITC has been shown to be more uniform compared to other lipophilic labels such as 1, 1′-dioctadecyl-3, 3, 3′, 3′-tetramethylindocarbocyanine perchlorate (Dil), but the FITC fluorescence decreases more rapidly compared to labels using tetramethylrhodamine (TRITC) under incubation at 37°C [20]. Additional factors that influence the fluorescence of cells are (A) concentration of fluorescent compound, (B) pH, (C) incubation time, (D) temperature, (E) concentration of cells, and (F) concentration of protein in cell culture medium [18].
Sodium fluorescein (NaFl) is a water-soluble dye that has been used to evaluate the permeability of blood-brain barrier (BBB) models [21] due to its small size. It has also been used in the study of malignant and normal cells for its internal accumulation due to a pH gradient across the external and internal cell environments [22]. Fluorescein has high binding affinity to intracellular proteins of cells after it is hydrolyzed from a starting material, such as fluorescein diacetate (FDA), which is able to be taken into cells [23, 24] but free diffusion of fluorescein has yet to be proven to our knowledge.
To date, many studies have been conducted on multiple cell types to determine the amount of cell surface attachment and cytoplasmic attachment but work has not been done to determine if fluorescent tracers such as FITC, fluorescein, and NaFl can passively diffuse through the cell surface of human brain microvascular endothelial cells (HBMEC). Brain microvascular endothelial cells help make up the BBB which limits passage across it, to (1) active and passive transport, (2) endocytosis, (3) active and passive diffusion, and (4) paracellular transport, due to tight junctions between endothelial cells. Passive diffusion across cells remains a challenge as it is limited by lipophilicity, size, and charge of the cell and the compound diffusing across it [25, 26].
Additional parameters of interest, cell volume and size fluctuations, of cell monolayers can occur over time that will make an in vitro model more of a dynamic system. Studies conducted on Mandin-Darby canine kidney (MDCK) cells have volume fluctuations of ± 20% and an average cell thickness of 7.1 ± 0.7 µm (mean ± standard deviation) [27]. Confocal fluorescence microscopy has also been used to measure the cell thickness of C3H10T1/2 and V79 cells grown on various substrates. It was reported that C3H10T1/2 cells, during the exponetial growth phase, grown on mylar have an average cell thickness of 2.9 ± 0.6 µm while V79 cells have an average cell thikness of 6.1 ± 1.0 µm grown on the same substrate during the exponential growth phase [28].
The aim of the present study was to create a simple approach that relies on fluorescence to determine an effective diffusion constant (Deff) of FITC, fluorescein, and NaFl transport across human brain microvascular endothelial cells (HBMEC) by passive diffusion. These constants would allow simulations to be run which could help predict the amount of free diffusion into HBMEC monolayers overtime without loss of fluorescent intensity in signal that can be seen with prolonged in vitro incubation.
2. Materials and methods
2.1. Cell culture
Penicillin-streptomycin solution (100x), MEM vitamin solution (100x), endothelial cell growth supplement (ECGS), fetal bovine serum (FBS), and NuSerum culture supplement were all obtained from Corning Life Sciences. Sodium pyruvate solution (100 mM), RPMI 1640 medium containing 2 mM L-glutamine were purchased from GE Healthcare Life Sciences. Non-essential amino acids were obtained from Gibco laboratories. Human brain microvascular endothelial cells (HBMEC) were isolated and purified as previously described [29]. Cells were cultured in RPMI 1640 medium with 10% fetal bovine serum, 10% NuSerum, 30 µg/ml ECGS, 15 U/ml of heparin, 11.0 mg/ml of sodium pyruvate, 100 U/ml of penicillin, 100 µg/ml of streptomycin, nonessential amino acids, and vitamins. HBMEC cultures were incubated at 37°C in a humid environment with 5% CO2.
2.2. In vitro studies
Fluorescein isothiocyante isomer I (FITC), fluorescein free acid, and fluorescein sodium salt (NaFl) fluorescent tracers were all purchased through Sigma-Aldrich. The molecular weights for FITC, fluorescein, and NaFl were 389.38, 332.31, and 376.28 respectively. HBMEC were grown to confluence followed by washing the monolayer with hanks balanced salt solution (HBSS, Corning Life Sciences) and cell detachment with 0.05% trypsin containing EDTA (GE Healthcare Life Sciences). The suspended cells were seeded into FalconTM 48 well plates at a density of 7.0×10⁴ cells per well and grown to confluence in an incubator for 1-2 days.
Confluent cells were aspirated of media and replaced with 200 µl of 0.1 mg/ml fluorescent tracer solutions in basal RPMI 1640 medium. Wells were incubated in tracer solutions at 3, 6, 9, 12, 15, 18, 21, and 24 hours with a sample size of 6 wells per time point for all three tracers. All wells were washed twice with sterile phosphate buffered saline (1x) to remove excess fluorescent tracer and replaced with phenol free RPMI 1640 medium (Gibco Laboratories) at a volume of 200 µl. Fluorescent intensity of the wells were recorded using a SpectraMax M2e (Molecular Devices, LLC) plate reader with excitation and emission settings of 492 and 518 nm respectively for FITC, 490 and 514 nm for fluorescein, and 460 and 515 nm for NaFl.
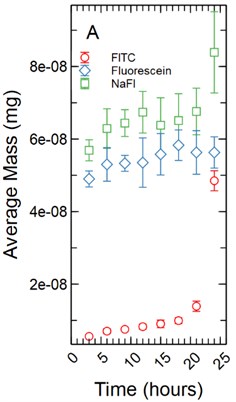
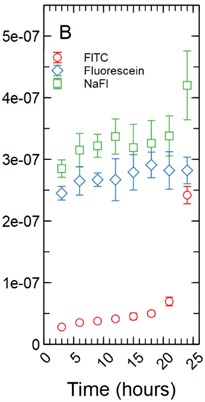
The fluorescent intensity was correlated to concentration (mg/ml) using a dilution curve generated for each fluorescent tracer dissolved in phenol red-free RPMI 1640 for various known concentrations. The fluorescent intensity of tracer found in the HBMEC monolayers were converted to concentration using the dilution curves. The total mass in mg for each monolayer was determined by multiplying the volume the monolayer occupied in each well by the calculated concentration. As cell monolayer thicknesses can vary based on cell type a 1 µm and 5 µm thickness were assumed. The 48 well plates have a growth area of 0.75 cm2 and accounting for a 1 µm monolayer thickness results in a volume of 2.36E-04 ml being occupied by the monolayer while a 5 µm thickness results in a volume of 1.18E-03 ml being occupied by the monolayer. The total mass in mg was averaged and standard deviation calculated for each time point for each tracer (Fig. 1).
Fig. 1a) Total mass in mg averaged for each time point per fluorescent tracer for a 1 µm thickness; b) total mass in mg averaged for each time point per fluorescent tracer for a 5 µm thickness
a)
b)
2.3. Passive diffusion model
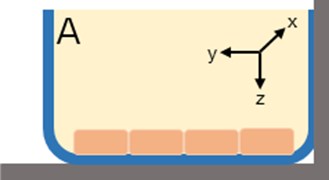
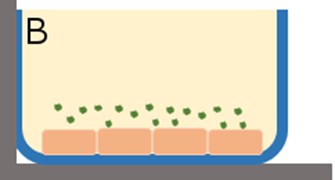
The in vitro system was composed of a cylindrical well where uptake of tracer could occur in the x, y, and z-directions (Fig. 2) with the HBMEC. Assuming the transport mechanism is primarily through passive diffusion, the following simplifications were made: (1) no reaction terms, (2) no binding, (3) movement of tracer was uniform in all directions, and (4) an overall diffusion constant is appropriate. These assumptions allow for the reduction of the problem from a three dimensional (3D) space to a one dimensional (1D) space where concentration could be determined in the z-direction. A 1D partial differential equation (PDE, Eq. (1)) was generated with one initial condition (Eq. (2)) and two boundary conditions (Eqs. (3-4)). Simulations were run in MATLAB 2015b.
Fig. 2a) In vitro cell culture of HBMEC where the monolayer thickness spans the z-direction; b) introduction of fluorescent tracers to the HBMEC for incubation. Uptake of the tracer is assumed to be uniform in all directions
a)
b)
The boundary concentration was set at 0.1 mg/ml for all simulations with the monolayer thickness varying between 1 and 5 µm which resulted in a monolayer volume of 2.36E-04 and 1.18E-03 ml respectively. A tracer concentration of 0.1 mg/ml was chosen for simulations to match the concentration used in the in vitro set-up. The monolayer thickness in the z-direction was divided into 70 evenly spaced pieces for simulations and the time span was restricted to 24 hours. A range of effective diffusion constants were simulated where the resulting concentration (mass/volume) was converted to mass in mg and the area under the curve for each time point was generated for comparison with the HBMEC in vitro data.
The in vitro data was split into a calibration and validation group where time points at hours 3, 12, 15, 21, and 24 were allocated to the calibration set and time points at hours 6, 9, and 18 were allocated to the validation set. A range of effective diffusion constants (Deff, cm2/s) were selected for simulations and simulated time points at hours 3, 12, 15, 21, and 24 were extracted and compared to the in vitro time points at those hours to determine a range of diffusion constants that produced results not statistically significantly different from the in vitro data. The resulting diffusion constants were used to run simulations and extract time points at hours 6, 9, and 18 and those were compared to the in vitro time points at those hours. The percent error was calculated for the validation sets to determine how far the simulated models deviated from the in vitro model.
2.4. Statistical methods
The means of each experimental time point for each fluorescent tracer were compared using an Analysis of Variance (ANOVA) if equal variance could be assumed at all time points per tracer otherwise the non-parametric equivalent of an ANOVA (Welch Test) was used. Post-hoc comparisons were conducted if the p-value of the ANOVA was less than the alpha (p<0.05). The Games-Howell post-hoc test was used if the non-parametric ANOVA was conducted and a Tukey Honest Significant Differences (HSD) was used if the parametric ANOVA was conducted.
A linear regression comparison of slopes was used to compare the in vitro time points to the simulated time points for the calibration data at hours 3, 12, 15, 18, 21, and 24. A p-value less than 0.05 indicates the slopes of the in vitro and simulated models are significantly different while a p-value larger than 0.05 indicates the slopes are not statistically significantly different. All statistical testing was conducted using Minitab 18 software (Minitab, Inc).
3. Results
3.1. In vitro diffusion of fluorescent tracers
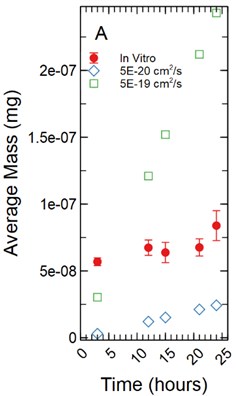
With the assumption of a 1 µm monolayer thickness, the calculated total average mass (mg) of tracer for FITC ranged from 5.59E-09 mg with a standard deviation of 3.85E-10 mg after 3 hours of incubation to 4.85E-08 ± 2.76E-09 mg at 24 hours (Fig. 1(a)). A non-parametric Welch Test was used to compare average mass among all FITC time points at the 95% confidence level resulting in an F-statistic = 192.36 and a p-value of 0.00. A Games-Howell post-hoc multiple comparison test was used showing the 24 and 21 hour time points to be significantly greater than all earlier time points (p-value < 0.05). The 18 hour time point was significantly greater than the 3 through 12 hour time points (p-value < 0.05). The 15 hour time points were significantly greater than the 3 and 6 hour time points (p-value < 0.05). The 12, 9, and 6 hour time points were significantly greater than the 3 hour time point with p-values of 0.001, 0.00, and 0.022 respectively. Fluorescein range from 4.90E-08 ± 1.94E-09 mg at 3 hours to 5.63E-08 ± 4.31E-09 mg at 24 hours of incubation (Fig. 1(a)). An ANOVA was used to compare all time points among the fluorescein data set resulting in an F-statistic = 2.19 and a p-value = 0.056, no additional post-hoc statistical testing was conducted. NaFl range from 5.69E-08 ± 2.90E-09 mg at 3 hours to 8.39E-08 ± 1.12E-08 mg at 24 hours of incubation (Fig. 1(a)). A non-parametric Welch Test was conducted resulting in an F-statistic = 6.33 and a p-value = 0.001. A Games-Howell post-hoc test showed only the 24 hour time point being significantly greater than the 3 and 6 hour time points with p-values of 0.016 and 0.046 respectively. The 9 hour time point was significantly greater than the 3 hour time point with a p-value of 0.045.
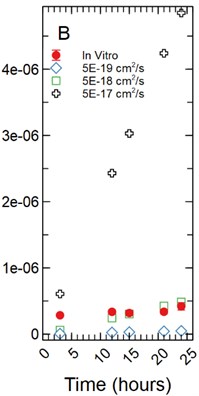
Under the assumption of a 5 µm monolayer thickness, the calculated total average mass in mg of tracer for FITC ranged from 2.80E-08 mg with a standard deviation of 1.94E-10 mg after 3 hours of incubation to 2.42E-07 ± 1.40E-08 mg at 24 hours (Fig. 1(b)). Fluorescein range from 2.45E-07 ± 1.10E-08 mg at 3 hours to 2.82E-07 ± 2.16E-08 mg at 24 hours of incubation (Fig. 1(b)). NaFl range from 2.85E-07 ± 1.42E-08 mg at 3 hours to 4.20E-07 ± 5.58E-08 mg at 24 hours of incubation (Fig. 1(b)). The statistical testing at the 5 µm monolayer thickness returned the same results as those found above with the 1 µm monolayer thickness.
3.2. Linear Regression: FITC Calibration
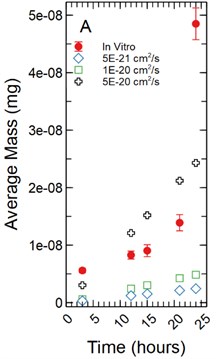
For a 1 µm monolayer thickness, FITC calibration simulations run using effective diffusion constants (Deff) of 5.00E-21, 1.00E-20, and 5.00E-20 cm2/s (Fig. 3(a)) created a range of data close to the in vitro calibration data set at hours 3, 12, 15, 18, 21, and 24 hours. The slopes of each simulated data set were statistically compared to the in vitro data set using a linear regression approach. There was not a significant difference in slopes comparing the 5.00E-21 cm2/s simulation to the in vitro data set with a t-statistic of 2.179 and a p-value of 0.066. The 1.00E-20 and 5.00E-20 cm2/s simulations yielded similar results with t-statistics of 2.011 and 0.314 respectively with p-values of 0.084 and 0.763 respectively.
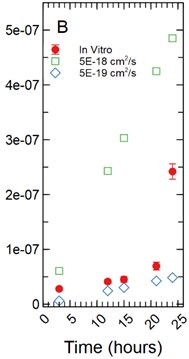
With a 5 µm monolayer thickness, calibration simulations run using effective diffusion constants (Deff) of 5.00E-21 and 1.00E-20 cm2/s (Fig. 3(b)) resulted in t-statistics of 1.647 and 4.865 respectively with p-values of 0.144 and 0.002 respectively when compared to in vitro data.
Fig. 3a) Simulations run under a 1 µm monolayer thickness assumption, all simulations were found to not be statistically significantly different from the in vitro data; b) simulations run under a 5 µm monolayer thickness assumption, using a simulated Deff of 5.00E-21 cm2/s was shown to not be statistically significant while a simulated Deff of 1.00E-20 cm2/s yielded a significant difference at a p-value of 0.002 for FITC
a)
b)
3.3. Linear regression: fluorescein calibration
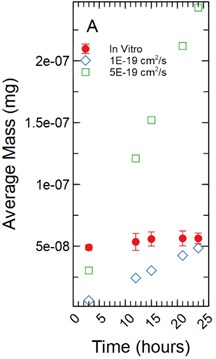
For a 1 µm monolayer thickness, fluorescein calibration simulations run using effective diffusion constants (Deff) of 5.00E-21 and 1.00E-20 cm2/s (Fig. 4(a)) created a range of data close to the in vitro calibration data set at hours 3, 12, 15, 18, 21, and 24 hours. The slopes of each simulated data set were statistically compared to the in vitro data set using a linear regression approach. There was a significant difference in slopes comparing the 5.00E-21 and 1.00E-20 cm2/s simulations to the in vitro data set with t-statistic of 5.122 and 3.594 respectively and p-values of 0.001 and 0.009 respectively.
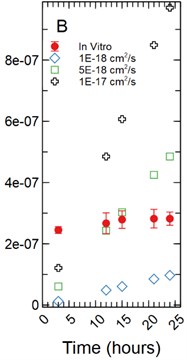
Fig. 4a) Simulations run under a 1 µm monolayer thickness assumption, all simulations were found to be statistically significantly different from the in vitro data with p-values < 0.05; b) simulations run under a 5 µm monolayer thickness assumption were found to be statistically significant (p-value < 0.05) for both the 1.00E-18 and 1.00E-17 cm2/s effective diffusion constants with the 5.00E-18 cm2/s diffusion constant gave a p-value of 0.547
a)
b)
With a 5 µm monolayer thickness, calibration simulations run using effective diffusion constants (Deff) of 1.00E-18, 5.00E-18, and 1.00E-17 cm2/s (Fig. 4(b)) resulted in t-statistics of 31.364, 0.632, and 3.125 respectively and p-values of 8.65E-9, 0.547, and 0.017 respectively.
3.4. Linear regression: NaFl calibration
For a 1 µm monolayer thickness, fluorescein calibration simulations run using effective diffusion constants (Deff) of 5.00E-20 and 5.00E-19 cm2/s (Fig. 5(a)) created a range of data close to the in vitro calibration data set at hours 3, 12, 15, 18, 21, and 24 hours. The slopes of each simulated data set were statistically compared to the in vitro data set using a linear regression approach. There was a significant difference in slopes comparing the 5.00E-20 and 5.00E-19 cm2/s simulations to the in vitro data set with t-statistic of 20.793 and 3.297 respectively and p-values of 1.49E-07 and 0.013 respectively.
With a 5 µm monolayer thickness, calibration simulations run using effective diffusion constants (Deff) of 5.00E-19, 5.00E-18, and 5.00E-17 cm2/s (Fig. 5(b)) resulted in t-statistics of 20.131, 0.831, and 4.923 respectively and p-values of 1.87E-07, 0.433, and 0.002 respectively.
Fig. 5a) Simulations run under a 1 µm monolayer thickness assumption, all simulations were found to be statistically significantly different from the in vitro data with p-values < 0.05; b) simulations run under a 5 µm monolayer thickness assumption were found to be statistically significant (p-value < 0.05) for both the 5.00E-19 and 5.00E-17 cm2/s effective diffusion constants with the 5.00E-18 cm2/s diffusion constant gave a p-value of 0.547
a)
b)
3.5. Percent error: FITC, fluorescein, and NaFl validation
When increasing the effective diffusion (Deff) constant of FITC, under a 1 µm assumption from 1E-20 to 5E-20 cm2/s shows a reduction in percent error of prediction of simulations (Table 1) at time points of 6 and 9 hours, but an increase in percent error of prediction at 18 hours of the validation data set using Eq. (5). When the monolayer thickness is increased to 5 µm and the Deff range is 5.00E-19 and 5E-18 cm2/s the percent error of prediction increased for all time points:
For fluorescein, under a 1 µm assumption, the Deff from 1E-19 to 5E-19 cm2/s shows a reduction in percent error of prediction of simulations (Table 2) at the 6 hour time point and an increase in error rate at the 9 and 18 hour time points (Table 2). Under a monolayer assumption of 5 µm there is a reduction in percent error at all three time points.
Table 1FITC percent error (%) of simulations compared to in vitro data at 6, 9, and 18 hours
Hours | Mass (mg)A | Mass (mg)B | (%)C | Mass (mg)B | (%)C | ||
Monolayer thickness (µm) | Monolayer volume (ml) | In Vitro | Deff= 1E-20 cm2/s | Percent error | Deff= 5E-20 cm2/s | Percent error | |
1.0 | 2.36E-04 | 6 | 7.03E-09 | 1.21E-09 | 82.74 | 6.07E-09 | 13.69 |
9 | 7.54E-09 | 1.82E-09 | 75.86 | 9.10E-09 | 20.68 | ||
18 | 9.94E-09 | 3.64E-09 | 63.38 | 1.82E-08 | 83.09 | ||
Monolayer thickness (µm) | Monolayer volume (ml) | In Vitro | Deff= 5E-19 cm2/s | Percent error | Deff= 5E-18 cm2/s | Percent Error | |
5.0 | 1.18E-03 | 6 | 3.52E-08 | 1.21E-08 | 65.48 | 1.21E-07 | 245.23 |
9 | 3.77E-08 | 1.82E-08 | 51.72 | 1.82E-07 | 382.82 | ||
18 | 4.98E-08 | 3.64E-08 | 26.85 | 3.64E-07 | 631.50 | ||
A: Average in vitro mass in milligrams; B: Simulated mass in milligrams; C: Percent error found using Eq. (5) | |||||||
Table 2Fluorescein percent error (%) of simulations compared to in vitro data at 6, 9, and 18 hours
Hours | Mass (mg)A | Mass (mg)B | (%)C | Mass (mg)B | (%)C | ||
Monolayer thickness (µm) | Monolayer volume (ml) | In Vitro | Deff= 1E-19 cm2/s | Percent error | Deff= 5E-19 cm2/s | Percent error | |
1.0 | 2.36E-04 | 6 | 5.30E-08 | 1.21E-08 | 77.12 | 6.07E-08 | 14.41 |
9 | 5.33E-08 | 1.82E-08 | 65.85 | 9.10E-08 | 70.75 | ||
18 | 5.83E-08 | 3.64E-08 | 37.50 | 1.82E-07 | 212.47 | ||
Monolayer thickness (µm) | Monolayer volume (ml) | In Vitro | Deff= 1E-18 cm2/s | Percent error | Deff= 5E-18 cm2/s | Percent error | |
5.0 | 1.18E-03 | 6 | 2.65E-07 | 2.43E-08 | 90.85 | 1.21E-07 | 54.24 |
9 | 2.67E-07 | 3.64E-08 | 86.35 | 1.82E-07 | 31.74 | ||
18 | 2.91E-07 | 7.28E-08 | 75.01 | 3.64E-07 | 24.96 | ||
A: Average in vitro mass in milligrams; B: Simulated mass in milligrams; C: Percent error found using Eq. (5) | |||||||
Table 3NaFl percent error (%) of simulations compared to in vitro data at 6, 9, and 18 hours
Hours | Mass (mg)A | Mass (mg)B | (%)C | Mass (mg)B | (%)C | ||
Monolayer thickness (µm) | Monolayer volume (ml) | In Vitro | Deff= 5E-20 cm2/s | Percent error | Deff= 5E-19 cm2/s | Percent error | |
1.0 | 2.36E-04 | 6 | 6.29E-08 | 6.07E-09 | 90.35 | 6.07E-08 | 3.54 |
9 | 6.44E-08 | 9.10E-09 | 85.86 | 9.10E-08 | 41.39 | ||
18 | 6.51E-08 | 1.82E-08 | 72.04 | 1.82E-07 | 179.59 | ||
Monolayer thickness (µm) | Monolayer volume (ml) | In Vitro | Deff= 5E-19 cm2/s | Percent error | Deff= 5E-18 cm2/s | Percent error | |
5.0 | 1.18E-03 | 6 | 3.15E-07 | 1.21E-08 | 96.14 | 1.21E-07 | 61.44 |
9 | 3.22E-07 | 1.82E-08 | 94.34 | 1.82E-07 | 43.44 | ||
18 | 3.26E-07 | 3.64E-08 | 88.82 | 3.64E-07 | 11.78 | ||
A: Average in vitro mass in milligrams; B: Simulated mass in milligrams; C: Percent error found using Eq. (5) | |||||||
NaFl, under an assumed 1 µm monolayer thickness, produced a decrease in percent error at the 6 and 9 hour time points for Deff from 5E-20 to 5E-19 cm2/s and an increase in percent error at the 18 hour time point (Table 3). With a 5 µm monolayer thickness there is a decrease in all time points when the effective diffusion constant (Deff) is increased from 5E-19 to 5E-18 cm2/s.
4. Conclusions
For both fluorescein and NaFl tracers the in vitro data showed high fluorescence compared to FITC time points with few statistically significant increases in tracer uptake over the 24-hour period. Additionally, fluorescein and NaFl simulated diffusion models have trouble narrowing in on a suitable effective diffusion constant range due to very little change in the in vitro data. It is probable that the fluorescein and NaFl tracer mass could be better explained by a more appropriate mechanism other than the passive diffusion such as binding to the cell surface or embedding within the lipid bilayer. Only FITC showed an increase in in vitro tracer that could be closely recreated through computational simulation. For FITC, under a 1 µm thickness, effective diffusion constants between the range of 1.00E-20 and 5.00E-20 cm2/s can serve as a good approximation of in vitro data. At the 5 µm thickness, effective diffusion constants around 5.00E-19 cm2/s would serve as a good approximation for the in vitro data.
Fluorescent tracers have a multitude of uses in biomedical sciences to stain the exterior and interior of cells. This paper attempted to determine the potential magnitude of free diffusion of 3 tracers into HBMEC monolayers at different thicknesses of 1 and 5 µm. It was determined that although higher than FITC, both fluorescein alone and NaFl showed very little increase in tracer concentration from 3 hours to 24 hours while FITC continued to increase at statistically significant levels. Under the assumption of diffusion with no reaction and binding terms, fluorescein and NaFl effective diffusion constants were not able to be narrowed to produce simulated curves similar to the in vitro calibration data but a narrow range can be determined for FITC. This suggests that the retention of fluorescein and NaFl to the HBMEC monolayer may be better explained by another mechanism while FITC uptake make be reasonably approximated using a diffusion model. It is also important to note that in vitro results achieved are highly dependent on a multitude of experimental factors such as pH, temperature, cell type, and concentration levels.
References
-
Lombard J. Once upon a time the cell membrane: 175 years of cell boundary research. Biology Direct, Vol. 9, 2014, p. 32.
-
Owen S. M., Gaus K., Magee A. I., Cebecauer M. Dynamic organization of lymphocyte plasma membrane: lessons from advanced imaging methods. Immunology, Vol. 131, 2010, p. 1-8.
-
Stone M. B., Shelby S. A., Veatch S. L. Super-resolution microscopy: shedding light on the cellular plasma membrane. Chemical Reviews, Vol. 117, 2017, p. 7457-7477.
-
Thornalley P. J. Isothiocyanates: mechanism of cancer chemopreventive action. Anticancer Drugs, Vol. 13, 2002, p. 331-338.
-
Wu X., Zhou Q., Xu K. Are isothiocyanates potential anti-cancer drugs? Acta Pharmacologica Sinica, Vol. 30, 2009, p. 501-512.
-
Cross J. V., Foss F. W., Rady J. M., Macdonald T. L., Templeton D. J. The isothiocyanate class of bioactive nutrients covalently inhibit the MEKKI protein kinase. BMC Cancer, Vol. 7, 2007, p. 183.
-
Hanschen F. S., Brüggemann N., Brodehl A., Mewis I., Schreiner M., Rohn S., Kroh L. W. Characterization of products from the reaction of glucosinolate-derived isothiocyanates with cysteine and lysine derivatives formed in either model systems or broccoli sprouts. Journal of Agricultural and Food Chemistry, Vol. 60, 2012, p. 7735-7745.
-
Ioannides C., Konsue N. A principal mechanism for the cancer chemopreventive activity of phenethyl isothiocyanate is modulation of carcinogen metabolism. Drug Metabolism Reviews, Vol. 47, 2015, p. 356-373.
-
Mi L., Wang X., Govind S., Hood B. L., Veenstra T. D., Conrads T. P., Saha D. T., Goldman R., Chung F.-L. The role of protein binding in induction of apoptosis by phenethyl isothiocyanate and sulforaphane in human non-small lung cancer cells. Cancer Research, Vol. 67, 2007, p. 6409-6416.
-
Ji Y. A., Morris M. E. Membrane transport of dietary phenyl isothiocyanate by ABCG2 (breast cancer resistance protein). Molecular Pharmaceutics, Vol. 2, 2005, p. 414-419.
-
Zhang Y. Molecular mechanism of rapid cellular accumulation of anticarcinogenic isothiocyanates. Carcinogenesis, Vol. 22, 2001, p. 425-431.
-
Zhang Y., Talalay P. Mechanism of differential potencies of isothiocyanates as inducers of anticarcinogenic phase 2 enzymes. Cancer Research, Vol. 58, 1998, p. 4632-4639.
-
Filatov A. V., Krotov G. I., Zgoda V. G., Volkov Y. Fluorescent immunoprecipitation analysis of cell surface proteins: a methodology compatible with mass-spectrometry. Journal of Immunological Methods, Vol. 319, 2007, p. 21-33.
-
Maeda H., Ishida N., Kawauchi H., Tuzimura K. Reaction of fluorescein-isothiocyanate with proteins and amino acids. The Journal of Biochemistry, Vol. 65, 1969, p. 777-783.
-
Miyata S., Morita S. A new method for visualization of endothelial cells and extravascular leakage in adult mouse brain using fluorescein isothiocyanate. Journal of Neuroscience Methods, Vol. 202, 2011, p. 9-16.
-
Aplin J. D., Hughes R. C. Modification of fibroblast surface amines alters receptor-mediated cell spreading on protein-coated substrata but not adsorptive endocytosis. Journal of Cell Science, Vol. 49, 1981, p. 283-297.
-
Butters T. D., Devalia V., Aplin J. D., Hughes R.C. Inhibition of fibronectin-mediated adhesion of hamster fibroblasts to substratum: effects of tunicamycin and some cell surface modifying reagents. Journal of Cell Science, Vol. 44, 1980, p. 33-58.
-
Butcher E. C., Weissman I. L. Direct fluorescent labeling of cells with fluorescein or rhodamine isothiocyanate. I. Technical aspects. Journal of Immunological Methods, Vol. 37, 1980, p. 97-108.
-
Jerry L. M., Sullivan A. K. The lymphocyte plasma membrane: locus of control in the immune response. In Vitro, Vol. 12, 1976, p. 236-259.
-
Spotl L., Sarti A., Dierich M. P., Most J. Cell membrane labeling with fluorescent dyes for the demonstration of cytokine-induced fusion between monocytes and tumor cells. Cytometry, Vol. 21, 1995, p. 160-169.
-
Kaya M., Ahishali B. Assessment of Permeability in Barrier Type of Endothelium in Brain Using Tracers: Evans Blue, Sodium Fluorescein, and Horseradish Peroxidase. Permeability Barrier. Methods in Molecular Biology (Methods and Protocols), Humana Press, Vol 763, 2011, p. 369-382.
-
Braginskaja O. V., Lazarev V. V., Pershina I. N., Petrov K. V., Rubin L. B., Tinkhonova O. V. Sodium fluorescein accumulation in cultured cells. General Physiology and Biophysics, Vol. 12, 1993, p. 453-464.
-
Breeuwer P., Drocourt J. L., Bunschoten N., Zwietering M. H., Rombouts F. M., Abee T. Characterization of uptake and hydrolysis of fluorescein diacetate and carboxyfluorescein diacetate by intracellular esterases in Saccharomyces cerevisiae, which result in accumulation of fluorescent product. Applied and Environmental Microbiology, Vol. 61, 1995, p. 1614-1619.
-
Meisingset K. K., Steen H. B. Intracellular binding of fluorescein in lymphocytes. Cytometry, Vol. 1, 1981, p. 272-278.
-
Cooper G. M. The Cell. Sinauer Associates, 2000.
-
Lodish H., Berk A., Zipursky S. L., Matsudaira P., Baltimore D., Darnell J. Molecular Cell Biology. W. H. Freeman, 2000.
-
Zehnder S., Suaris M., Bellaire M. M., Angelini T. E. Cell volume fluctuations in mdck monolayers. Biophysical Journal, Vol. 108, 2015, p. 247-250.
-
Bettega D., Calzolari P., Doglia S. M., Dulio B., Tallone L., Villa A. M. Technical report: cell thickness measurements by confocal fluorescence microscopy on C3H10T1/2 and V79 cells. International Journal of Radiation Biology, Vol. 74, 1998, p. 397-403.
-
Stins M. F., Gilles F., Kim K. S. Selective expression of adhesion molecules on human brain microvascular endothelial cells. Journal of Neuroimmunology, Vol. 76, 1997, p. 81-90.
About this article
We would like to thank the Virginia Tech Initiative for Maximizing Student Development (IMSD) program and the Virginia Tech Center for Autism Research (VTCAR) for partial support of this research project.

