Abstract
In today’s automobile, each and every part of vehicle must consider the vibration management. Damping and isolation are the two aspects of vibration management which uses in conjunction to attain the required performance. The Logarithmic decrement method and Bandwidth method are the two major methods for measurement of damping in vibration system. Time domain method is used in Logarithmic decrement whereas the Half power bandwidth method is used in frequency domain analysis. In the present work, quarter car model is used to determine the frequency response analysis of Magnetorheological damper strut. The sprung mass is varying from 82 kg to 132 kg and excitation force is given by cam mechanism which is designed as per the bump size specified by Indian Road Congress (IRC) standard. The fabricated MR damper is tested at different sprung mass with input current from 0.1 A to 0.5 A. It is observed that the damping ratio is varying from 0.04 to 0.21. The results obtained in this paper will be helpful for the Indian auto industry to make more economical and reliable damper strut.
1. Introduction
Semi-active suspension achieves remarkable improvement in vehicle dynamics performance. On the one hand, performance improvement of semi-active control is still a research hotspot. Shock absorber act as a main component for dissipating energy which has a significant impact on suspension performance. Hard damping can increase energy dissipation efficiency and improve ride quality when the vehicle body resonance occurs. But it is adverse to the intermediate frequency range for the increasing of vehicle body acceleration with hard damping. In contrast, soft damping is adverse to the resonance control of both vehicle body and wheel. But it improves the ride quality in the intermediate frequency range. Hence, it is not possible to improve vehicle dynamic performance in a large frequency range with fixed damping. To overcome this problem, controllable shock absorber is used with different damping so that when input signal changes, such as voltage and current accordingly damping changes. Semi-active suspension adopts controllable shock absorber to change damping ratio in real-time. In present work Magnetorhelogical damper is used as a semi active suspension system.
The MR damper has a property of the friction damper so that the relative magnitude of the friction force over excitation intensity [1] affects the control performance. The simulation work is done on semi active suspension system by using the MR damper as actuator to vary the damping properties of suspension system and to minimize the settling time [2]. The amount of force that is exerted on the occupant is measured by the transmissibility and work done on the vibration isolator proposes the concept of output frequency response function to examine the force transmissibility of MDOF structures with a cubic non-linear viscous damping device [3]. It is observed that vertical acceleration of main mass is substantially reduced by using a controlled MR damper [4]. The increase in damping control force of MRF damper reduces the displacement transmissibility to a low level [5]. From the literature survey it is observed that many researchers did the work on MR damper characteristic but damping ratio property still not investigated which is an important characteristic of MR Strut. The results obtained in this paper will be helpful for the Indian auto industry to make more economical and reliable damper strut.
2. Calculation of the damping force
The damping force is calculated based on the magnetic flux induced at the ring-shaped gap of the MR Damper. According to the Bingham plastic model [6-9] of plates, the damping force FD is divided into an induced yield stress, Fτ, and viscous components, Fη. The final damping force of MR Damper is calculated for 250kg and designed with top and bottom chamfered piston [10, 11]. This is given as per Eq. (1):
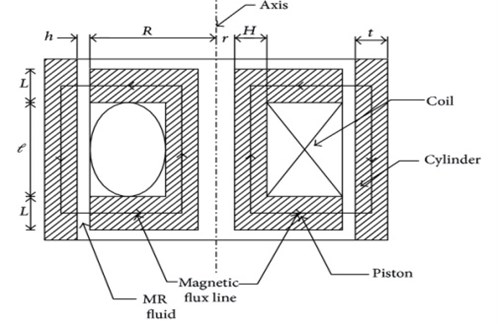
where 𝑄 is the volumetric flow rate of the MR fluid, Ap is the effective cross-sectional area of piston, D is the diameter of the piston, do is the diameter of the piston rod, υ is the piston velocity, τy is the yield shear strength of the MR fluid, η is the off-state (no magnetic field) viscosity of the MR fluid, L is the effective axial pole length, h is the gap between piston and cylinder, Ltis the total axial pole length ,w is the mean circumference of the damper’s annular flow path, and sgn(υ) is used to consider the reciprocating motion of the piston. Fig. 1 represents the magnetic circuit of MR damper.
Fig. 1Magnetic circuit of MR damper: L – pole length, L – distance between poles, R – radius of the piston, r – radius of piston rod, H– radial distance from piston rod to coil width, h – clearance between piston and cylinder, t – thickness of the cylinder
3. Experimental setup for MR damper
The vibration management always surrounds us every day from buildings to road cars. In vehicles it is observed that to maintain the visual clarity, mirrors on the vehicle must pass the vibration test. Neglecting the proper vibration management results in malfunctioning of components and, in some cases, involving or causing sudden damage or failure of component. Attia [12] presented the dynamic analysis of MacPherson strut motor vehicle suspension system for quarter car model and simulation work is performed with dynamic formulation. The methodology adopted for experimental investigation of damping ratio is shown in Fig. 2.
The Quarter Car Model is used [13-16] with different road profile and surface. The experimental work is associated with simulation work to determine performance of suspension system to investigate the responses of the vehicle due to road disturbances with different suspension system.
Fig. 2Methodology adopted for experimental investigations of damping ratio

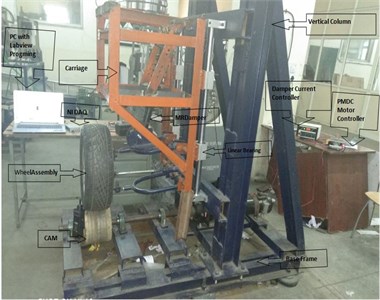
In present research work, to investigate damping characteristic of MR strut and to study the Ride comfort and Road holding, the experimental setup of Quarter Car Model is used. The schematic representation of Setup, block diagram with NI and actual test setup is represented by Fig. 3, 4 and 5 respectively. The test set up has arrangement for varying the sprung mass to test the suspension on different loading conditions. The sprung mass is connected to vertical column by means of linear bearing to minimize the friction. The double wishbone suspension system is used for testing. Also, it is compatible for MacPherson type of suspension. Various suspensions can be tested at different inclination according to their eye to eye length. The test setup is equipped with cam exciter which is designed according to constant wave form and powered by PMDC electric motor. It contains instruments like data acquisition hardware, accelerometer, loaded personal computer with required power supply, MR Damper and power cables connected to current controller and accelerometer. The quarter car model is equipped with Accelerometer in order to measure acceleration of sprung mass and unsprung mass and mounting points of it at required positions were provided to assist data acquisition system, such that the desired effect can be measured with the highest possible precision and minimum noise.
Fig. 3Schematic diagram of test setup
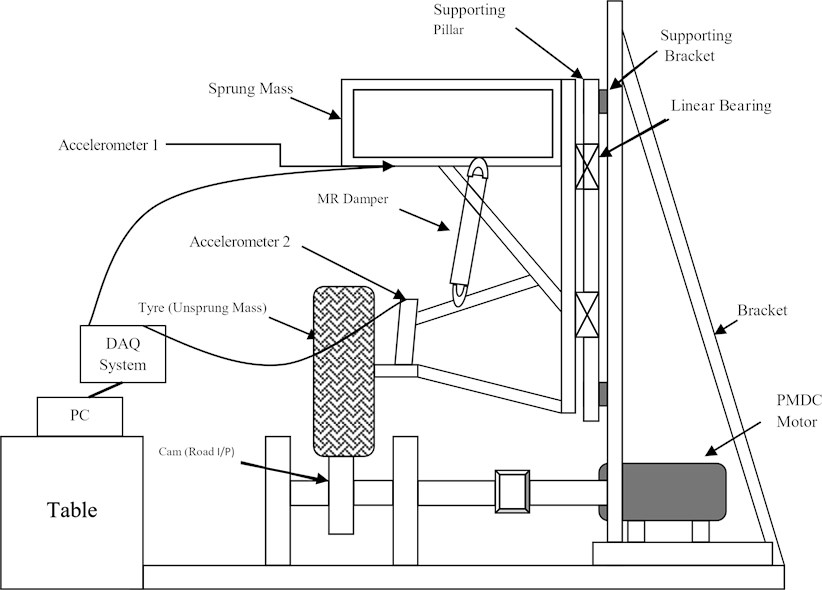
Fig. 4Block diagram of test set up with NI
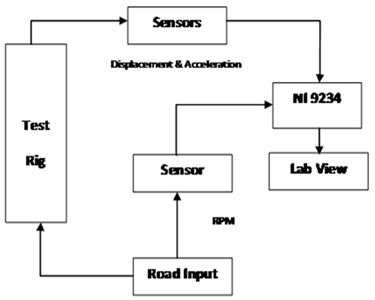
Fig. 5Quarter car model experimental setup
3.1. Road input via cam
In vehicle there are many sources of vibrations which related to cause of vibration, it may be free or forced. Wang et al. [17] and Pau et al. [18] studied effectiveness of road bumps, road profile and effectiveness of speed of a vehicle. The free vibration may occur when the vehicle passes over an irregularity road surface, which may disappear as a result of damping. The forced vibration may result when disturbances occur determinedly such as passing over obstacles on a proving road. In this case even if there may be damping, the vibration may carry on & build up an undesirable level [19]. In India, the number of deaths on the road are increasing due to the extended road system as well as the nature of roads in India is also worrisome [20]. Hence it is necessary to decide a framework for road anomaly like road bump and pothole on road in order to simulate the real-time situation of wheels passing over a bump, a sinusoidal cam was designed. Cam is made of hard plywood of base radius of 12 cm and max radius of 14 cm at the cam angle of 120 degree. It is actuated by PMDC motor and transferring motion to the tyre over a bump.
As per Indian Road Congress [21] the height of speed breaker is in the range of 50 mm to 100 mm for highway to rural area represented in Table 1. As per availability of resources average value 40 mm is selected for cam.
Table 1Height of bump for speed breaker in India
Sr. No | Application | Height of road bump |
1. | Highway | 50 mm-100 mm |
2. | City | 75 mm |
3. | Local area | 50 mm |
Table 2Specification of data acquisition system
Sr | Parameter | Specification |
1 | Brand make | National instruments |
2 | Number of channels | 4 |
3 | Maximum sampling | 51.2 ks/s per channel |
4 | Voltage input | 5V |
5 | Dynamic range | 102 DB |
Table 3Specification of accelerometer
Sr. | Parameter | Specification |
1 | Brand make | National instruments |
2 | Model No | PCB 352C33 |
3 | Voltage sensitivity | 100 mv/g |
4 | Frequency range | 0.3 to 12000 Hz |
5 | Electrical connector | Type/location 5-44 coaxial/side |
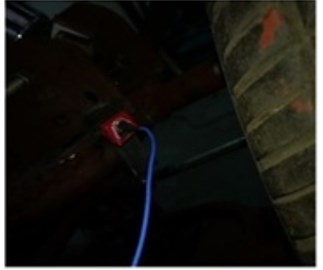
In order to determine the transmissibility of the suspension and to obtain raw data, NI Lab VIEW Data acquisition system (DAQ) is used along with accelerometer sensors. Two accelerometers are placed on a test rig to measure acceleration of two different parts. One is placed on wishbone which measures acceleration of unsprung mass as shown in Fig. 6 and second is placed on the carriage as shown in Fig. 7 which measures the acceleration of sprung mass. For recording real time data, test set up is equipped with Data Acquisition System (DAQ). Two accelerometers of IEPE type with BNC connector are directly attached to NI 9423 DAQ card which is compatible to measure acceleration of the system. The Specification of DAQ System and accelerometer are represented in Table 2 and 3 respectively.
Fig. 6Accelerometer on carriage
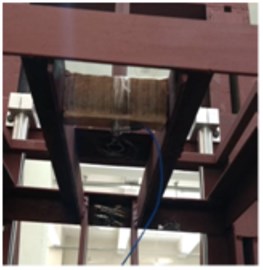
Fig. 7Accelerometer on wishbone
4. Transmissibility
It is observed that higher the transmissibility, the higher the force that will be transmitted into a vehicle operator, causing them discomfort. Therefore, it is desirable to minimize transmissibility in most cases. The transmissibility is the ratio of output force to input force, the input force being exerted on a mass system and that mass system transmitting an output force onto another system. It is the ratio between output and input amplitude:
In the above case, the input amplitude is the height of the speed bump, with output amplitude being vertical movement of the body. The experimental results are summarized in Table 4.
Table 4Frequency and transmissibility for 0.3 A to 0.5 A from 82 kg to 132 kg
Frequency | Transmissibility | |||||||
For 0.3 A and 82 kg | For 0.3 A and 97 kg | For 0.4 A and 82 kg | For 0.4 A and 97 kg | For 0.5 A and 82 kg | For 0.5 A and 97 kg | For 0.5 A and 117 kg | For 0.5 A and 132 kg | |
1.50 | 0.26 | 0.3 | 0.29 | 0.3 | 0.22 | 0.4 | 0.34 | 0.9 |
1.58 | 0.28 | 0.31 | 0.31 | 0.42 | 0.52 | 0.56 | 0.7 | 1.00 |
1.67 | 0.3 | 0.34 | 0.33 | 0.55 | 0.78 | 0.87 | 1.3 | 1.25 |
1.83 | 0.35 | 0.45 | 0.37 | 0.68 | 0.91 | 1.08 | 1.45 | 1.18 |
2.00 | 0.4 | 0.54 | 1.24 | 0.8 | 0.84 | 1.1 | 1.6 | 1.05 |
2.35 | 2.3 | 0.9 | 1.45 | 1.2 | 2.14 | 1.5 | 1.1 | 0.8 |
2.50 | 3.2 | 1.2 | 2.8 | 1.3 | 1.9 | 1.24 | 0.53 | 0.5 |
2.63 | 1.8 | 1.81 | 2.6 | 1.1 | 0.82 | 0.56 | 0.48 | 0.35 |
2.67 | 0.65 | 1.32 | 0.61 | 0.9 | 0.52 | 0.38 | 0.32 | 0.3 |
2.75 | 0.38 | 0.44 | 0.41 | 0.35 | 0.36 | 0.32 | 0.28 | 0.25 |
4.1. Half power band method
Suspensions in real vehicles don’t have constant frequency and damping ratio at all times. The vehicle suspension damping ratio is usually direction and velocity dependent. The damping is small in compression (bump) but large in extension (rebound). The damping rate is relatively high at low speed to control the vehicle attitude; it is relatively low at high speed for improved ride. The damping ratio provides a mathematical means of expressing the level of damping in a system. A damping ratio greater than 1.0 means over-damping, a value of exactly 1.0 is critically-damped, and a value less than 1.0 is under-damped. Damping and isolation are the two aspects of vibration management. In case of isolation which deals with the prevention of vibration from entering into the system whereas in case of damping which deals with the absorption of vibration energy entering to the system and changing the mechanical form of energy into a other form of energy. These two forms of vibration are completely different from each other but always utilized in conjunction to attain the required performance. There are three kinds of damping like viscous, coulomb, and structural or solid damping. The damping which depends upon surface friction and also the pressure between surfaces is known as coulomb damping. The Logarithmic decrement method and Bandwidth method are the two major methods for measurement of damping in vibration system. Time domain method is used in Logarithmic decrement whereas half power bandwidth method [22-24] is used in frequency domain analysis. The main concept behind frequency domain analysis is forced vibration which can be determined experimentally. The main limitation is of this method is that the horizontal line representing the half power must intersect the frequency response curve at two points defining the two limit frequencies. This implies that the damping has to be less than about 38 %. For systems that do not have real modes, the comparisons show that the results obtained with the half-power bandwidth method are reasonable, make physical sense, and are in fact very close to those predicted by approximate procedures used in practice [25-27]:
Damping ratio for viscous damping is derived as:
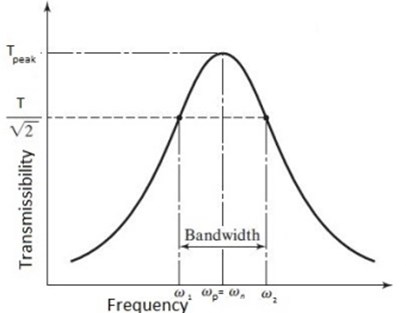
From Fig. 8,ω1 and ω2 are the frequency at 0.707Tpeak and natural frequency ωn=ωp peak frequency at Tpeak.
Fig. 8Determination of equivalent viscous damping from frequency response curve
4.2. Sample calculation for 0.3 A at 82 kg
The Table 5 represent the observed data for sprung mass 82 kg and from Fig. 9 the values for ω1 and ω2 are 2.35 and 2.58 at 0.707 Tpeak whereas ωn is observed at 2.5. The maximum transmissibility Tpeak observed as 3.2. Hence damping ratio calculated as:
Fig. 9Half power bandwidth frequency for 0.5 A and 132 kg
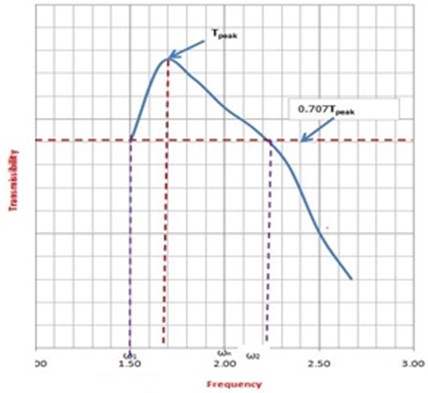
Table 5Frequency and transmissibility for 0.3 A and 82 kg
Frequency | Transmissibility |
1.50 | 0.26 |
1.58 | 0.28 |
1.67 | 0.3 |
1.83 | 0.35 |
2.00 | 0.4 |
2.35 | 2.3 |
2.50 | 3.2 |
2.63 | 1.8 |
2.67 | 0.65 |
2.75 | 0.38 |
Table 6Frequency and transmissibility for 0.5 A and 132 kg
Frequency | Transmissibility |
1.50 | 0.9 |
1.58 | 1.00 |
1.67 | 1.25 |
1.83 | 1.18 |
2.00 | 1.05 |
2.35 | 0.8 |
2.50 | 0.5 |
2.63 | 0.35 |
2.67 | 0.3 |
2.75 | 0.25 |
4.3. Sample calculation for 0.5 A at 132 kg
The Table 6 represent the observed data for sprung mass 132 kg and from Fig. 10 the values for ω1 and ω2 are 2.22 and 1.5 at 0.707 Tpeak whereas ωn is observed at 1.67. The maximum transmissibility Tpeak observed as 1.25. Hence damping ratio calculated as:
The calculated results are summarized in Table 7 for 82 kg to 132 kg sprung mass and current from 0.3 A to 0.5 A.
Fig. 10Half power bandwidth frequency for 0.3 A and 82 kg
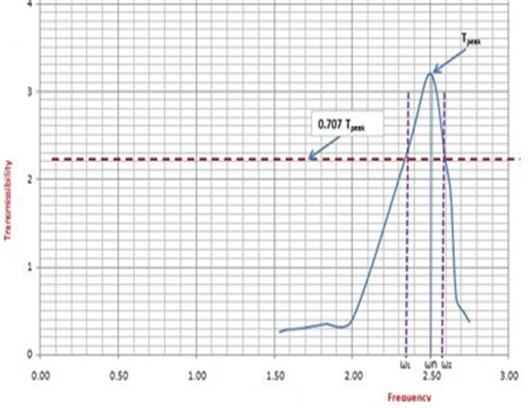
Table 7Damping ratio for sprung mass 82 kg to 132 kg for 0.3 A to 0.5 A
Sr No. | Current | Sprung mass (kg) | Transmissibility | wn | w1 | w2 | Damping ratio |
1 | 0.3 | 82 | 3.2 | 2.5 | 2.35 | 2.58 | 0.046 |
2 | 97 | 1.81 | 2.5 | 2.36 | 2.61 | 0.05 | |
3 | 0.4 | 82 | 2.88 | 2.45 | 2.27 | 2.52 | 0.05 |
4 | 97 | 1.3 | 2.33 | 1.98 | 2.48 | 0.11 | |
5 | 0.5 | 82 | 2.14 | 2.17 | 2.1 | 2.38 | 0.06 |
6 | 97 | 1.5 | 2.33 | 1.92 | 2.52 | 0.13 | |
7 | 117 | 1.6 | 2.0 | 1.62 | 2.18 | 0.14 | |
8 | 132 | 1.25 | 1.67 | 1.5 | 2.22 | 0.21 |
5. Conclusions
The damping characteristic of semi-active suspension provides scientific basis for shock absorber design optimization. A suspension system, as the link between vehicle body and wheel, should be able to isolate vibration from the road surface irregularity to provide good ride comfort, and keep the tyre road gripping. The effect of current on vibration characteristic of MR damper is investigated in this paper. The observations show that the damping ratio is varies from 0.046 to 0.05 for 0.3 A, 0.05 to 0.11 for 0.4 A whereas it varies from 0.06 to 0.21 for 0.5 A from 82 kg to 132 kg sprung mass. From the result obtained it is concluded that semi active suspension system offered the superior damping ratio over a wider range of sprung mass. The low price model developed will have wide application to Indian auto industry, which is right now limited to expensive vehicle.
References
-
Lee S. H., Park J. H., Lee S. K., Youn K. J., Min K. W. Performance evaluation of passive and semi-active, magnetorheological dampers. Journal of Mechanical Science and Technology, Vol. 21, Issue 6, 2007, p. 913-918.
-
Zareh S. H., Abbasi M., Mahdavi And Osgouie H. K. G. Semi-active vibration control of an eleven degrees of freedom suspension system using neuro inverse model of magnetorheological dampers. Journal of Mechanical Science and Technology, Vol. 26, Issue 8, 2012, p. 2459-2467.
-
Peng Z. K., Lang Z. Q., Zhao L., Billings Tomlinson S. A. G. R., Guo P. F. The force transmissibility of MDOF structures with a non-linear viscous damping device. International Journal of Non-Linear Mechanics, Vol. 46, Issue 10, 2011, p. 1305-1314.
-
Lam H. F., Lai C. Y., Liao W. H. Automobile Suspension Systems with MR Fluid Dampers, Smart Materials and Structures Laboratory. Department of Mechanical and Automation Engineering, The Chinese University of Hong Kong, 2002.
-
Yu H., Sun X., Xu J., Zheng P. The time-delay coupling nonlinear effect in sky-hook control of vibration isolation systems using magneto-rheological fluid dampers. Journal of Mechanical Science and Technology, Vol. 30, Issue 9, 2016, p. 4157-4166.
-
Jolly M. R., Bender J. W., Carlson J. D. Properties and applications of commercial magnetorheological fluids. Journal of Intelligent Material Systems and Structures, Vol. 10, Issue 1, 1999, p. 5-13.
-
Sahin H., Liu Y. Full-scale magnetorheological fluid dampers for heavy vehicle roller. Journal of Intelligent Material System and Structure, Vol. 18, Issue 12, 2007, p. 1161-1167.
-
Tsampardoukas G. Hybrid balance control of a magneto-rheological truck suspension. Journal of Sound and Vibration, Vol. 317, Issues 3-5, 2008, p. 514-536.
-
Yao G. Z., Yap F. F., Chen G., Li W. H., Yeo S. H. MR damper and its application for semiactive control of vehicle suspension system. Mechatronics, Vol. 12, Issue 7, 2002, p. 963-973.
-
Ferdaus M. M., Rashid M. M., Hasan M. H., Rahman M. A. Optimal design of magneto-rheological damper comparing different configurations by finite element analysis. Journal of Mechanical Science and Technology, Vol. 28, Issue 9, 2014, p. 3667-3677.
-
Mangal S. K., Kumar A., Chattopadhyay K. D. Development of Mr damper modeling and its experimental validation. The IUP Journal of Mechanical Engineering, Vol. 7, Issue 3, 2014, p. 35-48.
-
Attia H. A. Dynamics of the MacPherson strut motor-vehicle suspension system in point and joint coordinates. KSME International Journal, Vol. 17, Issue 9, 2003, p. 1287-1296.
-
Rajendiran S., Lakshmi P. Simulation of PID and fuzzy logic controller for integrated seat suspension of a quarter car with driver model for different road profiles. Journal of Mechanical Science and Technology, Vol. 30, Issue 10, 2016, p. 4565-4570.
-
Barethiye V., Pohit G., Mitra A. A combined nonlinear and hysteresis model of shock absorber for quarter car simulation on the basis of experimental data. Engineering Science and Technology, an International Journal, Vol. 20, Issue 6, 2017, p. 1610-1622.
-
Abdelhafez H. M., Osama O. Controlling quarter car suspension system by proportional derivative andpositive position feedback controllers with time delay. Journal of Vibroengineering, Vol. 19, Issue 7, 2017, p. 5374-5387.
-
Osama O., Gudarzi M. Reliable robust controller for half-car active suspension systems based on human-body dynamics. Facta Universitatis Series: Mechanical Engineering, Vol. 14, Issue 2, 2016, p. 121-134.
-
Wang Z. F., Dong M. M., Qin Y. C., Gu L. Road profile estimation for suspension system based on the minimum model error criterion combined with a Kalman filter. Journal of Vibroengineering, Vol. 19, Issue 6, 2017, p. 4550-4572.
-
Tiirkay S., Akcay H. On the performance limitations of quarter-car active suspension models. 5th IFAC Symposium on Advances in Automotive Control, Monterey Coast, California, USA, 2007, p. 207-212.
-
Lav A. H., Bilgin E. A fundamental experimental approach for optimal design of speed bumps. Accident Analysis and Prevention, Vol. 116, 2018, p. 53-68.
-
Pau M., Angius S. Speed bumps really decrease traffic speed? An Italian Experience. Accident Analysis and Prevention, Vol. 33, Issue 5, 2001, p. 585-597.
-
Sudarvizhi D., Karthi S., Gokulakrishnan B., Boopathyraja M. Effect of vibration due to two wheeler driving. International Conference on Emerging Trends in Engineering, Science and Sustainable Technology, 2017, p. 127-129.
-
Lanjewar B. U., Sagar R., Pawar R., Khedkar J., Gosavi K. Road bump and intensity detection using smartphone sensors. International Journal of Innovative Research in Computer and Communication Engineering, Vol. 4, Issue 5, 2016, p. 9185-9192.
-
Tentative Guidelines on the Provision of Speed Breakers for Control of Vehicular Speeds on Minor Roads. Indian Road Congress, India, 1996.
-
Carmichael S. Estimating Damping Values Using the Half Power Method. Integrated Systems Research, Tech Brief, 2015.
-
Cruciat R., Cristian G. Experimental determination of dynamic characteristics of structures. Mathematical Modelling in Civil Engineering, Vol. 4, 2012, p. 51-59.
-
Irvine T. The half power bandwidth method for damping calculation. Isolation, 2005, p. 1-8.
-
Olmos B. A., Roesset J. M. Evaluation of the half-power bandwidth method to estimate damping in systems without real modes. Earthquake Engineering and Structural Dynamics, Vol. 39, 2010, p. 1671-1686.
Cited by
About this article
This work is supported by BCUD, Board of College and University Development, Savitribai Phule Pune University, Pune, India under University Research Grant Scheme and author would like to thank MES College of Engineering, Pune for providing the research facilities.

