Abstract
This paper investigates the optimum penetration depth and the synergistic effect of TBM (Tunnel Boring Machine) rock breaking under the different cutter spacings. Indentation tests, using two TBM cutters, were conducted on sandstone specimens based on an improved uniaxial testing. Afterwards, morphological measurement was performed to analyze the change of the groove volume, using a surface profilometer. Based on the evaluations of typical chips and cracks propagation, the fragmentation modes of the rock between two cutters under different penetration depths were proposed. In addition, the TBM rock breaking efficiency was studied. As the increase of the penetration depth, when the cutter spacing was constant, the results show that: (1) The rock fragmentation modes gradually changed from shear failure and shear-tensile failure to tensile failure. (2) Though penetration energy gradually increased, the groove volumes also increased, thus, the TBM rock breaking efficiency rises. (3) Specific energy decreased first and then gradually increased. It indicates that the optimum penetration depth was existent for different preset penetration depths. With the increase in cutter spacing, the optimum penetration depth also rised. According to the derivation and verification of the analytical formula, the internal relationship between the penetration depth and the fracture toughness was obtained, which was in line with the linear relationship between penetration depth and penetration energy. From a microscopic point of view, the sharp increase of penetration energy with increase of penetration depth can be explained.
Highlights
- Indentation tests, using two TBM cutters, were conducted on sandstone specimens based on a improved uniaxial testing.
- Morphological measurement was performed to analyze the change of the groove volume, using a surface profilometer.
- The changed trends of penetration energy and Specific energy with depth of indentation were studiedin this paper.
1. Introduction
Tunnel Boring Machines (TBMs) are characterized by less noise, less vibration, a high-degree mechanization and automation, high safety and high reliability. Thus, TBMs have been widely used in tunnel excavation and other engineering projects. In the meantime, the TBM rock breakage efficiency is an important index to determine the method of tunnel excavation in engineering construction. The previous study found that the cutter spacing, and the penetration depth are two important factors, affecting the TBM rock breaking efficiency [1]. The research shows that excessively small cutter spacing will cause excessive damage for the rock, whereas larger cutter spacing will result in inadequate rock failure [2], limiting the efficiency. Similarly, when the penetration depth is inadequate, rock ridges form between two grooves and the TBM cutting efficiency is restrained. However, too large penetration depth is conductive for cutting rock. The amount of chips will increase with the increase of penetration depth, but the larger cutting force and the excessive energy consumption will be required correspondingly [3], causing excessive wear of the tool.
At present, to evaluate the influences of cutter spacing and penetration depth on TBM performance, many scholars have conducted field, numerical and laboratory investigations [4-10]. Choi et al. [4] used PFC3D to simulate the optimum cutter spacing for TBM rock fragmentation. They found that the optimum cutter spacing, deriving from numerical simulation, was in good agreement with the linear cutting method (LCM) test results. By conducting a series of linear cutting tests, Gertsch et al. proposed that both normal and rolling forces will increase with the increase in cutter spacing. and the optimum cutter spacing is nearly 76 mm. Specific energy is the minimum for the brittle hard crystalline rock, and the TBM rock breakage efficiency is the highest. Tan et al. [6] used particle discrete element method to simulate the rock mass with the different cutting depths and found that breakage of the rock mass is shear failure under small cutting depth, while the breakage of rock is caused by tensile stress for the large cutting depth. Regarding to the research on the TBM rock breaking mechanism, Su [7] established a two-dimensional numerical model of rock and cutter, using the particle flow method. Based on the simulation of the rock breaking process by TBM cutter, the extrusion-tension theory of rock fragmentation by TBM cutter was verified. Liu et al. [8] found that the soft rock exhibits brittle failure when the penetration depth is shallow, then plastic failure occurs when the penetration depth is large. Gong et al. [9] conducted numerical simulations, using two TBM cutters. Liu et al. [10] studied the effect of single cutter and double cutters on rock breaking utilizing numerical simulation. The existing researches on cutter spacing and penetration depth for TBM rock breaking are mostly based on numerical simulation and research on the effect of TBM single-edge cutter rock breaking. When the cutter spacing is appropriate, the efficiency of TBM double-edge cutters is higher than that of the single-edge cutter [11]. In the practical TBM excavation, instead of single cutter, the group of cutters on the cutter plate can be cooperated to the rock breaking. For this reason, the authors of this paper conducted a series of preset penetration depth with cutter spacing tests by a improved uniaxial test equipment, which was designed by the authors. And through the analysis and comparison of the groove volume, the volume of chips, the penetration energy and the specific energy, the TBM rock breaking efficiency for different spacing/penetration (s/p) ratios is evaluated. Based on a large number of literature, the relationship between penetration depth and rock fracture toughness is studied through theoretical derivation. In addition, the optimum penetration depth on TBM rock breaking is studied.
2. Laboratory tests
2.1. Rock specimens preparation
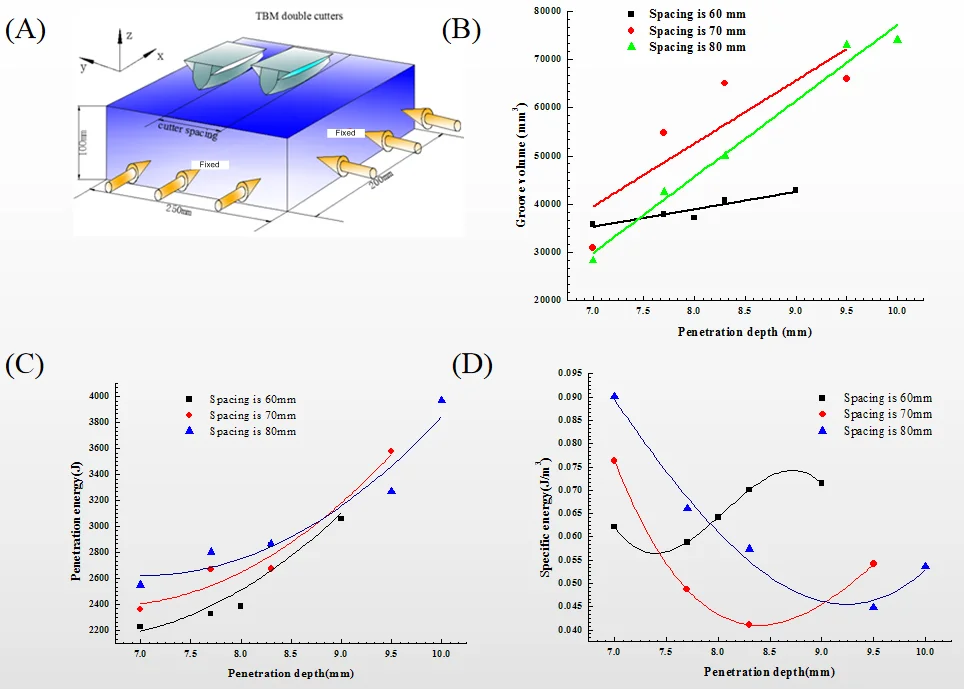
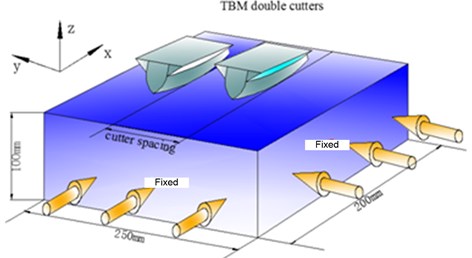
To study the optimum penetration depth for rock breakage by TBM double-edged cutters for different cutter spacing, homogeneous sandstones with bedding planes were used in this test. The distance between adjacent bedding planes is approximately 1 mm, and the rock size is 250 mm×200 mm×100 mm (Length × width × height) in Fig. 1.
Fig. 1Diagram of indentation process
At the same time, all the rock specimens were cut and processed from the same rock mass and had similar mechanical and physical properties accordingly. With reference to the recommended test standards of the International Society for Rock Mechanics (ISRM), rock specimens were subjected to corresponding uniaxial compression, Brazilian split and direct shear tests. Table 1 shows the mechanical properties. According to the studies of Yin [12] and Liu [13], the size effect is negligible if the ratio of the plastic zone depth to the minimum specimen width is lower than 1/6. Combined with the “blunt-cutter cutting model” [14, 15] and the mechanical parameters of the rock specimens in Table 1, the obtained plastic zone depth is 2.0 mm, and the ratio of the plastic zone depth to the minimum width is 1/50, which is much lower than 1/6. Therefore, the selected sample size is reasonable.
Table 1Mechanical and physical parameters of sandstone specimen
Mechanical parameters | Elastic modulus (GPa) | Poisson’s ratio | Uniaxial compressive strength (MPa) | Tensile strength (MPa) |
Sandstone | 17.1 | 0.25 | 29.5 | 9.2 |
2.2. Test equipment
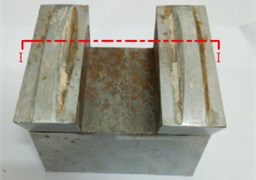
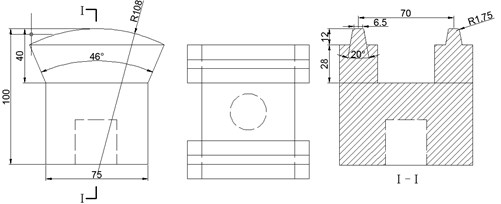
Indentation tests were carried out on an improved uniaxial test equipment, installed in Center South University. The machine mainly consisted of a control system, a loading system and a computer system and it’s loading ways include force control and displacement. The maximum loading force in axial direction was 2000 kN. Thus, the loading requirements of the penetration forces provision could be satisfied. Penetration forces were recorded and stored every few seconds using the force data acquisition system. After the corresponding data of the curves of penetration forces and depths were proceed using the software Origin pro8, the penetration energy were obtained. As a portion of a TBM cutter, the geometry of the double-edged cutters, made of heat-treated high-hardness steel (Fig. 2).
To calculate the groove volume that formed between adjoin nicks, the morphology-measuring machine and corresponding analysis software TalyMap 5.0 were applied. The measuring accuracy of machine is 0.5μm, which meets perfectly the requirement of this test.
Fig. 2A photograph of two TBM disc cutters and the geometric parameters of cutter
a)
b)
2.3. Test plans
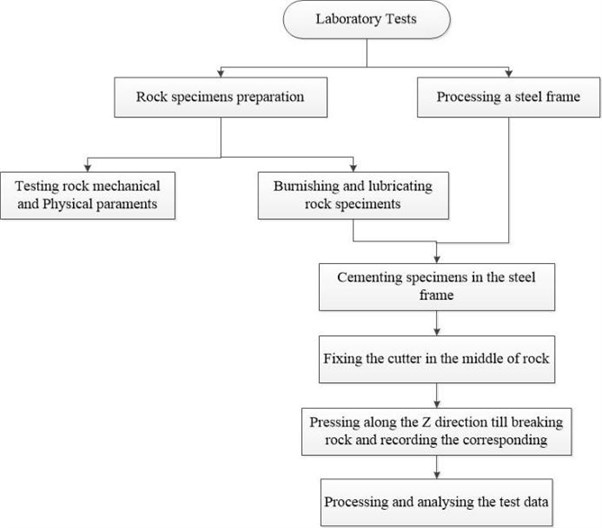
Fig. 3 gives the flow chart of the test process. Before conducting tests, the surfaces of specimen were burnished and lubricated to minimize the friction effect when the surfaces of the rock specimen were in contact with the cutters. Then, the specimens were cemented in a steel frame to simulate the field condition (Fig. 1). During tests, the loading measurement of the displacement and the quasi-static was used and loading rate was 0.5 mm/min. According to the research by Gertsch et al. [5], a proper penetration depth (6 mm) was recommended. Moreover, as cutter spacing increases, the penetration depth correspondingly increased. The values of S-p are shown in Table 2.
Table 2Preset S-p values
Cutter spacing (mm) | 60 | 60 | 60 | 60 | 60 | 70 | 70 | 70 | 70 | 80 | 80 | 80 | 80 | 80 |
Penetration depth (mm) | 7.0 | 7.7 | 8.0 | 8.3 | 9.0 | 7.0 | 7.7 | 8.3 | 9.5 | 7.0 | 7.7 | 8.3 | 9.5 | 10.0 |
Fig. 3A flow chart of laboratory tests
3. Test results and analysis
3.1. The chips between grooves
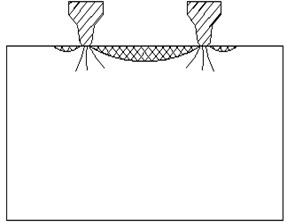
When the double-edged cutters penetrate the rock sample, the crack initiates from beneath the cutter, gradually develops into the main crack, and forms a plastic zone. This phase is the initiation phase of micro cracking. However, with the increase of penetration depth, the main crack continues to propagate. Simultaneously, the lateral cracks between the cutting edges rapidly expand and eventually converge, resulting in the spalling of the rock mass between the cutters to form chips (Fig. 4). In indentation tests, the chips between two grooves are commonly determined by the surface cracks, propagating in the interior of rock sample, and the crack originating from the plastic zone within the rock sample.
Fig. 4Diagram of chips produce
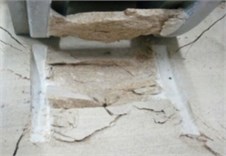
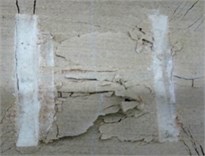
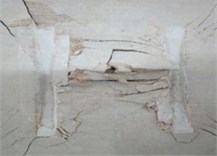
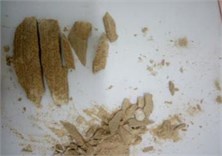
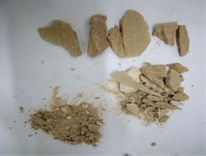
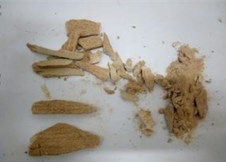
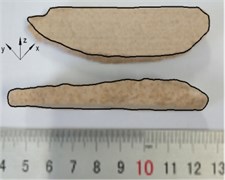
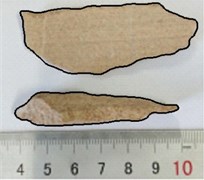
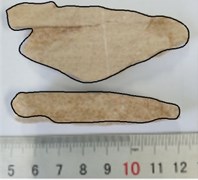
Under the conditions of a cutter spacing of 80 mm and penetration depths of 7.0 mm, 7.7 mm, and 8.3 mm, the propagation with intersection of surface cracks and the formation of chips are shown in Fig. 5. Fig. 5 shows that as the penetration depth increased, the degree of fragmentation of the inter-cutter rock surface increased. Through the filtering of the chips and the powder, it was found that the chips with a size exceeding 6 mm decreased from 87.5 % (penetration depth = 7 mm) to 81.6 % (penetration depth = 8.3 mm). This indicates that as penetration depth increased, the penetration force rised and it caused the excessive breaking of rock sample. The friction between the cutters and the rock sample surface was enhanced and rock powder increased. When the penetration depth was 7.0 mm, the chips were one side thickness and one side thinness, which show a shear failure shape mode. At the same time, the surface of chips was smooth and there were a little of traces of friction. The thickness of the chips was small, and their shape presented long strip shape. Considering the formation conditions of the chips, it can be known that, the chips form under the penetration depth are determined commonly by the shear failure and the development of the inter-cutters cracks. When the penetration depth reaches 7.7 mm, the size of chips mass decreased slightly, but the number of blocks increased (Fig. 5(e), (h)). The contour line in the XY plane became large and the surface was rough. At this moment, the outline in the XZ plane shows that the rock fragmentation mode has changed. Some part of the contour of the chips in the XZ plane showed rolls-and-swells, and most of them showed a straight shear shape. Therefore, it is inferred that the chips are probably form by inter-cutters surface cracks, shear failure and tensile cracks between the grooves. When the penetration depth increased to 8.3 mm, the thickness of the chips continued to increase, showing an approximately mid-thickness, and the two ends were thin. The contour of the chips in the XZ plane was irregular, presenting an approximately tensile failure shape, while the XY plane contour undulation has become larger. The chips were formed by perforation of the inter-cutters surface cracks and the inter-groove tension cracks. Therefore, when TBM penetrate the rock sample, the rock failure mode gradually changes from shear failure and shear-tensile failure to tensile failure with the increasing penetration depth, and this conclusion is consistent with the numerical simulation results of Tan et al. [11].
Fig. 5Typical fracture, chips and powder, and typical chips generated under different penetration depths when cutter spacing is 80 mm. When s-p is 80-7.0, 80-7.7 and 80-8.3 respectively: a)-c): surface crack between cutters, d)-f): chips and powder, g)-i): typical chips
a)
b)
c)
d)
e)
f)
g)
h)
i)
3.2. Relationship between penetration depth and groove volume under different the cutter spacing
The morphology and volume of groove are important factors for evaluating the TBM rock breaking efficiency [17-20]. After the separation of chips and powder, the scanning area is determined (the area enclosed by the dashed blue line in Fig. 6 is the scanning area). It should be pointed out that the depth of the groove forms below the cutter may exceed the depth of detection of the scanner, so it can only approximately reflect the groove volume of the sandstone. During the loading process, the rock surface was squeezed by the force, causing fragments to fly out. Therefore, to reflect the change of groove volume, the chips and the groove volume have to be independently analyzed. Table 3 shows the relationship between s-p and groove volume.
Fig. 6Diagram of scanning area used in morphology measurements
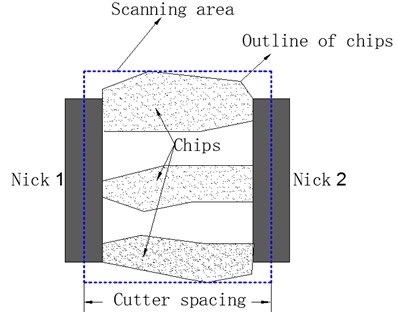
Table 3Groove volume under different S-p
S-p | Groove volume | S-p | Groove volume | S-p | Groove volume |
60-7.0 | 35824 | 70-7.0 | 30959 | 80-7.0 | 28306 |
60-7.7 | 37824 | 70-7.7 | 54842 | 80-7.7 | 42459 |
60-8.0 | 37151 | 70-8.3 | 65015 | 80-8.3 | 49977 |
60-8.3 | 40823 | 70-9.5 | 66015 | 80-9.5 | 72977 |
60-9.0 | 42823 | – | – | 80-10.0 | 73977 |
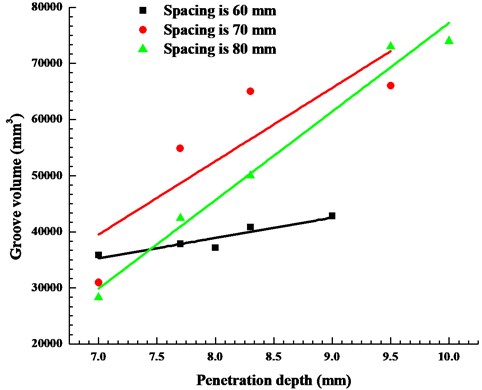
The correlation coefficient of linear relationship of the groove volume and the penetration depth is greater than 0.8 (Fig. 7). Therefore, when the cutter spacing is fixed, the increasing trend of the groove volume and the penetration depth maintain a highly linear relationship. When the penetration depth was smaller than 7.0 mm, the groove volume decreased with the increasing cutter spacing. However, the groove volume changed when the penetration depth increased gradually from 7.7 mm to 8.3 mm. When the cutter spacing was 70 mm, the groove volume was the largest, and the groove volume was the second when the cutter spacing was 80 mm, but the groove volume was the smallest when the cutter spacing is 60 mm. According to the linear change of the image, it can be inferred that when the penetration depth continues to increase to 9 mm or even larger, the change in the size of the groove volume was exactly opposite to the change trend when the initial indentation depth was shallow, i.e., the groove volume becomes larger as the cutter spacing increased. This shows that when the penetration depth was small, the cracks propagation along the direction of the normal force below the cutter were limited, and the smaller cutter spacing promoted the crack propagation along the indentation direction until the middle and side cracks under the two cutter edges to converge. On the contrary, as the penetration depth increased, the normal force also increased. The crack below the cutter extended along the direction of the normal force, and as the cutter spacing increased, a larger groove volume will be formed when the two cracks coalesced. The limitation of the cutter spacing caused excessive destruction of the rock between the grooves, and the friction between the rock sample and the cutter consumed a large amount of penetration energy, resulting in a minimum breakage volume when the cutter spacing was 60 mm.
Fig. 7Relationship between groove volume and penetration depth
3.3. Relationship between penetration depth and penetration energy under different cutter spacing
The penetration energy is the total energy consumed by the cutter to penetrate the rock mass, reflecting the amount of energy consumed by the TBM on rock breaking process. Its formulation is consistent with the rock breakage work:
where the axial force loaded in step i is Fi; the penetration depth of step i in the cutter is hi; the number of steps for summation is n.
Fig. 8Relationship between penetration energy and penetration depth
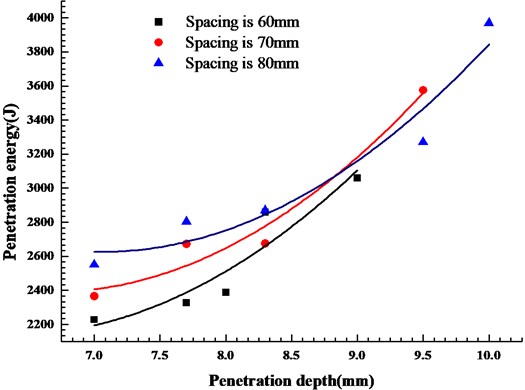
The relationship of penetration energy with different penetration depth-cutter spacing, is shown Fig. 8. When the cutter spacing and penetration were 60 mm and 7.0 mm, the penetration energy was higher than 2200 J. When the penetration depth increased to 8.0mm, the penetration energy gradually increased to about 2400 J, and when the penetration depth increased to 8.3 mm, the energy quickly increased to around 2800 J. When the penetration depth continued to increased to 9.0 mm, the penetration energy increased to around 3000 J. On the contrary, the growth rate slowed down. However, the overall penetration energy increased as the penetration depth increased. In the case of a cutter spacing and penetration of 70 mm 7.0 mm, respectively, the penetration energy approached 2400 J. When the penetration depth increased to 7.7 mm, the penetration energy rapidly increased to around 2700 J. However, when the penetration depth increased to 8.3 mm, it is concluded that the penetration energy is slightly reduced. As the penetration depth continued to increase, the energy consumption increased rapidly. It is obvious to find that although the energy consumption has certain fluctuations with the increase of penetration depth, the overall trend remained increasing as the penetration depth increase. When the cutter spacing reaches 80 mm, the overall change trend was similar to the trend when the cutter spacing is 70 mm. As the penetration depth increased to a certain extent, the energy required for the unit penetration depth increased steeply.
3.4. Influence of penetration depth on rock breaking efficiency under different cutter spacing
SE (Specific Energy) is an important index reflecting the TBM rock breaking efficiency [13, 17]. It is defined as the energy consumed for the formation of a unit groove volume:
where the rock breakage work is W (J); the groove volume is V (m3).
Fig. 9Relationship specific energy and penetration depth
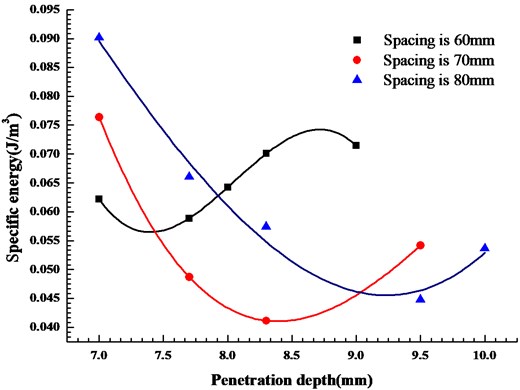
The data have been processed by three orders non-linear fittings (Fig. 9). In this paper, SE is used to identify the optimum penetration depth under different cutter spacing. Thus, when SE is the minimum, the TBM rock breaking efficiency is highest and the corresponding penetration depth is the optimal value. When the cutter spacing was 60 mm, the SE decreased with the penetration depth increasing on the initial phase. On the contrary, the rock breaking efficiency increased. With the increase of the penetration depth, although the degree of fragmentation between the two grooves has increased, the SE has rapidly increased, thus, the rock breaking efficiency was reduced. When the cutter spacings were from 60 mm to 70 mm or 80 mm, the overall trend was similar with the trend when the cutter spacing was 60 mm. The SE first decreased, and then increased. It indicates that there were minimum values of SE among different penetration depths when the cutter spacing was constant. In other words, the minimum values of SE reflect the optimum penetration depth. Fig. 8 shows that the optimum penetration depth was 7.3 mm when the cutter spacing was 60 mm, but as the cutter spacing increased to 70 mm or 80 mm, the minimum value of SE moved to the right along the coordinate axis. The optimum penetration depth also correspondingly increased, with the increment from 8.3 mm to 9.2 mm. Therefore, it is not difficult to find that with the increase of penetration depth, the rock breaking efficiency shows a trend of increasing first and then decreasing, indicating that there is an optimum penetration depth at different cutter spacing, and the increase of cutter spacing makes the optimum penetration depth increase.
3.5. Relationship between penetration depth and rock fracture toughness
According to previous studies, cracks initiate from the elasto-plastic boundary, and there is a maximum tensile stress σ't at the crack initiation point. Liu [21] only considered the influence of confining pressure condition. However, the authors believed that the crack propagation at the crack initiation is determined by the tensile stress, which is formed commonly by the horizontal confining pressure and normal force. Therefore, the normal force is also an important cause forming the lateral crack and there is a certain positive proportional relationship between the normal force and the tensile stress at the crack initiation point:
where f is a function of Fv; k is a positive coefficient; σ't is the maximum tensile stress when only considering the confining pressure.
According to its stress field, the elasto-plastic boundary crack is a mode I-II crack. Then the extreme expansion condition of lateral crack [22] is:
where KΙ is stress intensity of the mode I crack; KΠ is the stress intensity of the mode II crack; KΙc is the rock fracture toughness. According to the related literature [22]:
where l is the length of micro cracks; σt is the tensile stress at the initially cracking point; σ is the confining pressure; α is the initially cracking angle, which is an increasing function of the confining pressure; f is the friction coefficient of the crack surface; A(σ) is a function of the friction coefficient and the initially cracking angle.
According to another study by Liu [21], it was found that KΠ is proportional to the confining pressure. Therefore, KΠ remains unchanged under certain confining pressure conditions.
With respect to the study of normal force and penetration depth, Roxborough [23] proposed a formula:
where R is the radius of the TBM disc cutter; α is the included angle between the TBM disc cutter and surface of rock; Fv is the normal penetration force; h is the penetration depth.
Combine Eq. (3)-(7) to get:
As a result, the fracture toughness of the rock (KIc) increases with the increase of the penetration depth. Thus, it shows that the more penetration energy on TBM breaking rock is consumed. The phenomenon is consistent with the linear relationship described in Fig. 9. Meanwhile, the reason of the sharp increase in energy is explained from the microscopic point of view. On the contrary, it also shows that the normal indentation force and the tensile stress at the crack initiation have the relationship of Eq. (1).
In this paper, the TBM cutters are assumed to be located at the rock center, which is based on the field investigation by authors and it is influenced by the optimal intrusion under different cutter spacings. In practice, the TBM cutters may also be located at the rock edges, which is the so called free face rock breaking. According to Liu and Shao [24], the contact mechanism, the contact mechanisms for the above two conditions are very different. It should be noted that only the condition of rock center is evaluated within the scope of this paper.
4. Conclusions
In order to study the optimum penetration depth and rock breaking characteristics of TBM rock breaking under different cutter spacing, this paper conducted TBM cutter indentation tests under different preset penetration depth and obtained the following conclusions:
1) By observing the changes of the volume and shape of the chips, it was found that the chips gradually develop to interior of rock sample with penetration depth increasing and as the indentation depth increases, the rock failure mode gradually is changed from shear failure and shear-tensile failure to tensile failure.
2) With the increase of penetration depth, the groove volume increases under different cutter spacing; and when the penetration depth is 7 mm, the groove volume is the largest when the cutter spacing is 60 mm, and when the penetration depth increases to 8.3 mm, the groove volume is the largest when the cutter spacing 70 mm and when the penetration depth is 9.5 mm, the groove volume on the 80 mm cutter spacing has the largest value.
3) With the increase of penetration depth, the penetration energy also increases; and as the penetration depth increases to a certain extent, the penetration energy on per unit penetration depth increases sharply.
4) Comparing the variation regularity of specific energy with different penetration depths under different cutter spacing, it is found that when the cutter spacing is 60 mm and the penetration depth is about 7.3 mm, the SE reaches the minimum value; when the cutter spacing is 70 mm, the penetration depth is about 8.3 mm, the SE reaches the minimum value; when the cutter spacing is 80 mm, the SE reaches a minimum value when the penetration depth is about 8.3 mm. As a result, with the cutter spacing increasing, the optimum penetration depth of TBM rock breaking increases.
5) After the derivation and verification of the formula, the internal relationship between penetration depth and fracture toughness was obtained, which was in line with the linear relationship between penetration depth and penetration energy. The sharp increase of penetration energy was explained from a microscopic point of view.
References
-
Han D. Y., Cao P., Liu J., et al. An experimental study of dependence of optimum TBM cutter spacing on pre-set penetration depth in sandstone fragmentation. Rock Mechanics and Rock Engineering, Vol. 50, Issue 4, 2017, p. 3209-3221.
-
Liu J., Cao P., Han D. The influence of confining stress on optimum spacing of TBM cutters for cutting granite. International Journal of Rock Mechanics and Mining Sciences, Vol. 88, 2016, p. 165-174.
-
Teale R. The mechanical excavation of rock – experiments with roller cutters. International Journal of Rock Mechanics and Mining Sciences and Geomechanics Abstracts, Vol. 1, Issue 1, 1964, p. 63-64.
-
Choi S. O., Lee S. J. Three-dimensional numerical analysis of the rock-cutting behavior of a disc cutter using particle flow code. KSCE Journal of Civil Engineering, Vol. 19, Issue 4, 2015, p. 1129-1138.
-
Gertsch R., Gertsch L., Rostami J. Disc cutting tests in Colorado Red Granite: Implications for TBM performance prediction. International Journal of Rock Mechanics and Mining Sciences, Vol. 44, Issue 2, 2007, p. 238-246.
-
Tan Qing, Yi Nianen, Xia Yimin, et al. Research on rock dynamic fragmentation characteristics by TBM cutters and cutter spacing optimization. Chinese Journal of Rock Mechanics and Engineering, Vol. 31, Issue 12, 2012, p. 2453-2464.
-
Su Li Jun, Sun Jin Shan, Lu Wen Bo Research on numerical simulation of rock fragmentation by TBM cutters using particle flow method. Rock and Soil Mechanics, Vol. 30, Issue 9, 2009, p. 2823-2829.
-
Liu Q., Pan Y., Liu J., et al. Comparison and discussion on fragmentation behavior of soft rock in multi-indentation tests by a single TBM disc cutter. Tunnelling and Underground Space Technology, Vol. 57, 2016, p. 151-161.
-
Gong Q. M., Zhao J., Hefny A. M. Numerical simulation of rock fragmentation process induced by two TBM cutters and cutter spacing optimization. Tunnelling and Underground Space Technology incorporating Trenchless Technology Research, Vol. 21, Issue 3, 2006, p. 263-263.
-
Liu H. Y., Kou S. Q., Lindqvist P. A., et al. Numerical simulation of the rock fragmentation process induced by indenters. International Journal of Rock Mechanics and Mining Sciences, Vol. 39, Issue 4, 2002, p. 491-505.
-
Zhang Xuhui, Xia Yimin, Tan Qing, et al. Study on the characteristics of breaking jointed rock by tunnel boring machine single-point and double-point cutters. Journal of Harbin Engineering University, Vol. 37, Issue 10, 2016, p. 1424-1431.
-
Yin L. J., Gong Q. M., Ma H. S., et al. Use of indentation tests to study the influence of confining stress on rock fragmentation by a TBM cutter. International Journal of Rock Mechanics and Mining Sciences, Vol. 72, Issue 72, 2014, p. 261-276.
-
Liu J., Cao P., Han D. Sequential indentation tests to investigate the influence of confining stress on rock breakage by tunnel boring machine cutter in a biaxial state. Rock Mechanics and Rock Engineering, Vol. 49, Issue 4, 2015, p. 1-17.
-
Alehossein H., Detournay E., Huang H. An analytical model for the indentation of rocks by blunt tools. Rock Mechanics and Rock Engineering, Vol. 33, Issue 4, 2000, p. 267-284.
-
Chen L. H., Labuz J. F. Indentation of rock by wedge-shaped tools. International Journal of Rock Mechanics and Mining Sciences, Vol. 43, Issue 7, 2006, p. 1023-1033.
-
Gong Q. M., Jiao Y. Y., Zhao J. Numerical modelling of the effects of joint spacing on rock fragmentation by TBM cutters. Tunnelling and Underground Space Technology incorporating Trenchless Technology Research, Vol. 21, Issue 1, 2006, p. 46-55.
-
Yang H., Wang H., Zhou X. Analysis on the damage behavior of mixed ground during TBM cutting process. Conference on Tunnel Boring Machines in Difficult Grounds, 2016, p. 55-65.
-
Wang Y. X., Guo P. P., Dai F., Li X., Zhao Y. L., Liu Y. Behaviour and modelling of fiber reinforced clay under triaxial compression by using the combining superposition method with the energy based homogenization technique. International Journal of Geomechanics, Vol. 18, Issue 12, 2018, https://doi.org/10.1061/(ASCE)GM.1943-5622.0001313.
-
Qibin Lin, Ping Cao, Rihong Cao Experimental investigation of jointed rock breaking under a disc cutter with different confining stresses. Comptes Rendus Mecanique, Vol. 346, Issue 9, 2018, p. 833-843.
-
Wang Y. X., Guo P. P., Ren W. X., Yuan B. X., Yuan H. P., Zhao Y. L., Shan S. B., Cao P. Laboratory investigation on strength characteristics of expansive soil treated with jute fiber reinforcement. International Journal of Geomechanics, Vol. 17, Issue 11, 2017, https://doi.org/10.1061/(ASCE)GM.1943-5622.0000998.
-
Zhang Z. H. Tunnel boring machine and theory of rock breaking by cutter. Chinese Railway Press, Beijing, 2003.
-
Li S. Y., He T. M., Yin X. C. Introduction to Rock Fracture Mechanics. University of Science and Technology of China Press, Hefei, 2010.
-
Liu J. Study on Rock Breaking Mechanism Based on True Triaxial Test Platform by TBM Cutter. Central South University, Changsha 2015.
-
Liu J., Shao Y. Dynamic modeling for rigid rotor bearing systems with a localized defect considering additional deformations at the sharp edges. Journal of Sound and Vibration, Vol. 398, 2017, p. 84-102.
Cited by
About this article
The authors would like to acknowledge the financial supports for the research: Projects (51604299, 11772358) supported by the National Natural Science Foundation of China; the State Key Research Development Program of China (2016YFC0600706); Projects funded by China Postdoctoral Science Foundation (2018T110846); Central South University Postgraduate Independent Exploration and Innovation Project (2018zzts737).

