Abstract
High productive milling of complex sculptured surfaces is extremely important in many different industries. Determination of the appropriate tool path styles and milling parameters is crucial in ensuring precise surface machining, meeting the better surface integrities and lower tool deflection and forces using process monitoring methods. In this study, sound pressure as a monitoring method is presented for analyzing different tool path strategies and cutting parameters to assess their influence on surface errors, tool deflection, cutting forces, sound pressure level and instantaneous material removal rate on rough machining of complex surfaces with ball end mill. Design and analysis of experiments are performed using factorial design technique and variance analysis. Additionally, the significant parameters affecting the experimental results are introduced. B-rep based method with integrated CAM software is developed to calculate the cutter/workpiece engagement, effective cutting diameter and instantaneous material removal rate. Milling strategies employed include contour parallel, zigzag with two cut angle, and spiral. The milling conditions were feed rate and radial depth of cut. The conclusion is that 0° zigzag strategy provokes the lowest cutting forces, tool deflection, surface errors and sound pressure and spiral strategy signifies the worst surface errors and the highest cutting forces. With the increase of feed rate, instantaneous material removal rate increases parallel to rising of machining sound signal, milling forces, tool deflection and machining errors. It is observed that the step over value has less influence on the results. The sound pressure level which has a drastic reference to the material removal rate and removed volume values are detected and experimental results could be figured out with sound pressure.
1. Introduction
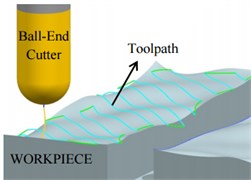
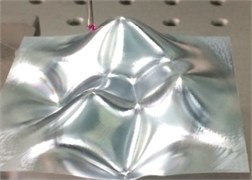
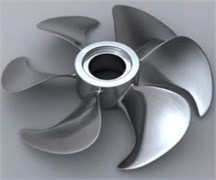
Complex surfaces are widely used in the die/mold, aeronautics, shipbuilding, precision manufacturing, bio-medical and other sectors. The machining of free- form surfaces is a process that is both time-consuming and costly. There are more than 10,000 tool movements observed in a typical example of free-form surface machining as shown in Fig. 1.
Fig. 1Sculptured surface definition and examples
a)
b)
c)
Tool-path characteristics are key parameters that determine not only the efficiency of the cutting processes but also the surface quality of finished parts. An optimal path generation method should be robust, accurate, precise and efficient. Kurt and Bagci [1] and Lasemi et al. [2] reviewed the recent research literature on milling of complex-curved surfaces and feed-rate optimization approaches. Chen et al. proposed a real-time monitoring system with error compensation in order to enhance dimensional accuracy in the production of complex components [3]. Habibi et al. modeled machining process for force/deflection calculations in a 3D simulation environment [4]. Desai et al. determined the effect of different curvature geometries by milling from two parametric directions and using cutting tool of various diameters [5]. Alberti et al. [ 6] compared the part errors with cutting time in machining of Al material. Erdim et al. published a method to adjust feed-rate according to milling force in order to reduce machining time [7]. Kaymakci and Lazoglu [8] suggested a new model to predict 3D surface topographies with integrated milling software. Gok et al. focused on investigating of effects of milling strategies on surface roughness for inclined surfaces using different coated cutter [9]. Shajari et al. investigated various tool paths in 3-axis machining of a curved geometry part and also developed an approach for mathematical model to measure scallop height size and distribution [10]. Izol et al. studied comparison and evaluation of the milling strategies to produce components with freeform surfaces [11]. Matras et al. presented the analysis results of dimensional accuracy after the sculptured surface cutting simulations for different milling strategies [12]. Schützer et al. developed an approach to use complex features to enhance the automatic creation of milling data. Their approach reduces the programming time significantly to produce HSC appropriate tool paths for same quality [13]. The objective of the observation of cutting processes are related to the productivity of the milling center, cutter life, surface tolerances/texture properties, cutter flexibility/deflection, and other parameters of the part as well as the chip geometry, generation and classification. TCMSs have been obtaining significancy in sector and scientific works for approximately three decades. For this motivation, scholars have dedicated to development of TCMSs [14, 15]. Over the last three decades, different sensing elements such as milling force, spindle and cutting power, noise/sound measurement sensors have been commonly used to determine cutter life, wear, deflection and chatter etc. [16-20]. Acoustic emission [21], cutting force [22], power consumption [23] and cutting sound [24] that are created during milling have been worked to observe and optimize the cutting process automatically. Microphones are inexpensive and non-contact sensor, flexible to set-up in the NC machine and are used commonly for vibration and chatter detection and monitoring of tool life and wear in turning processes [25-27]. The main serious issue relevant to the practice of sound signal in machining sector is the ability to insulate the sensing element from the dangerous machining environment [28-30]. Machining oils or removed material can damage the acoustic sensing element. Vibration/noise signal from other machines, mechanical units, drivers, etc. or other factors can affect the sound signals. This noise can be filtered by using signal processing algorithm. Some researcher has used machining acoustic measurement approaches to observe cutting parameters [31] or cutting tool wear [24]. Trabelsi et al. researched acoustic radiation from a microphone for cutter failure and wear evaluation in lathe machine using pattern-recognition methods [32]. Teti et al. [33] summarized acoustic measurement approaches used to observe tool wear in turning process. Sound signal was examined in order to detect the relationship between acoustic signal and cutting parameters. Acoustic signal in representing time was employed using various works to monitor the variate in amplitude in accordance with cutter wear [25, 26, 34, 35]. Tekiner used sound signals in order to find the optimum turning conditions [34]. Raja concluded that with the change of machining conditions, acoustic pressure also changes and an increase in cutter wear results in an increase of cutting sound signal amplitude [25]. Quintana used acoustic methods to detect the stability lobe in a machining process using sound mapping techniques. Downey used acoustic signals and compared the cumulative sound spectrum and roughness for the tool life [36]. Delio et al. [37] presented that acoustic method is a proper approach for finding cutting vibrations during the milling. The acoustic signal from the chatter generated in the tool/workpiece engagement area was used to monitor toolvibrations [37-41]. Schmitz et al. [38-39] and Schmitz [40] examined a new method for milling vibration determination and recognition using statistical considerations. Weingaertner et al. [41] evaluated milling stability using audio signal measurements. Bagci [42] used sound pressure level in order to analyze the effect of MRR-based feed rate optimization approach on ball end milling process. In previous works, sound values were applied to observing of the different machining processes such as laser cutting, turning and hole making. Most of the previous works focused on comparing cutter deflection, cutting forces and surface errors with respect to cutter path orientations, but none of them examine cutter deflection, cutting forces, sound pressure, IMRR and surface errors regarding tool path strategies specially when rough milling of complex surfaces. In this work, we focus on machining of complex surfaces. When a ball end mill moves into different regions of complex surface which is included complex curved geometries, variations its machining direction, tool/workpiece engagement zone, swept volume, IMRR values, cutting depth are typically varied. Because of these reasons, determination of cutting parameters is a high critical step so as to prevent unwanted outcomes, for example, cutter failure, or excessive material removal rate due to cutter deflection, dimensional errors.
This work investigates the possibility of using acoustic signal to observe the complex surface machining and to evaluate effect of cutting parameters and tool path strategies. Firstly, the aim of this article is to examine various tool path strategies including contour parallel, spiral, and zigzag tool paths with different cut angle in 3-axis rough machining of complex surfaces. Secondly, the effect of cutting conditions on cutter deflection, cutting forces, sound pressure and surface errors based on the tool path strategy employed is investigated and the most significant parameter affecting experimental results is identified by means of analysis of variance. The machining parameters used in this study are feed rate, and radial depth of cut. Machining forces, tool deflection, sound pressure levels, surface errors were measured and IMRR values are analyzed. This work focuses on the potentiality of using sound signal to observe the complex surface machining at various process parameters.
Table 1Chemical composition and mechanical properties of Al 7075-T651
Material composition wt % | |||||||||||
Si | Fe | Cu | Mn | Mg | Cr | Ni | Zn | Ti | Sn | V | Al |
0.393 | 0.260 | 1.26 | 0.044 | 1.94 | 0.288 | 0.027 | 5.92 | 0.086 | 0.0035 | 0.0087 | 89 |
Ag | B | Be | Bi | Ca | Co | Li | Na | Pb | Sr | Zr | Cd |
0.0067 | 0.005 | 0.0028 | 0.001 | 0.048 | 0.032 | 0.347 | 0.015 | 0.0058 | 0.211 | 0.0014 | 0.0001 |
Tensile strength (MPa) | Yield strength (MPa) | Elongation (%) | Shear modulus (MPa) | Tensile modulus (GPa) | |||||||
503 | 434 | 13 | 303 | 72 | |||||||
2. Experimental details
2.1. Cutting tools and workpiece materials
Two fluted-carbide ball end mill cutter (12 mm diameter/nominal helix angle of 30°) was used. The chemical elements and structural specifications of the Al 7075-T651 were taken in Table 1. The cutters were held in a BT-40 taper tool holder. The experiments were conducted using a 3-axes CNC machining center which has a maximum spindle speed 12000 rpm and drive power 10 KW as seen in Fig. 2. This machine was designed to make 3-axis linear and circular interpolations via ISO format programs in metric and imperial units. Its control unit was a FANUC series O-M.
The rectangular samples (100×53×30 mm) of Al 7075-T651 aerospace alloy were used for the experiments. Several program packages were used in the evaluation of the data and in the experimental design of the study. The specimen was designed in CATIA V5 R17.
Fig. 2Experimental setup
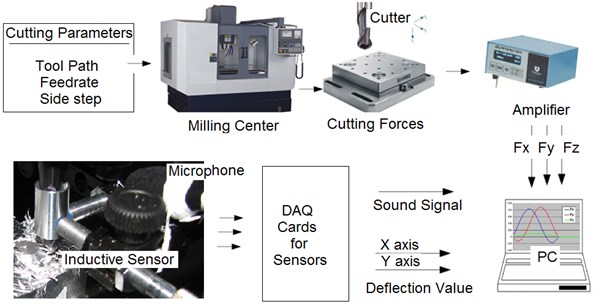
Fig. 3Representation of cutting patterns and tool-path strategies

a)

b)

c)
Table 2Experimental machining conditions
Exp. No | Tool path strategies | Feed rate (mm/rev) | Step over (mm) | |
1 | Zig-zag | 0° | 96 | 3 |
2 | 45° | |||
3 | Contour parallel | Step over-constant 3D | ||
4 | Spiral | Spiral in | ||
5 | Zig-zag | 0° | 48 | 3 |
6 | 96 | 3 | ||
7 | 144 | 3 | ||
8 | 48 | 5 | ||
9 | 96 | 5 | ||
10 | 144 | 5 | ||
2.2. Milling conditions
Determination of the appropriate tool path styles and milling parameters is crucial in ensuring precise surface machining. For examining the influence of side step and feed rate value and tool path strategies in milling of free-form surfaces, the ten experiments were run at various conditions as seen in Table 2. Various machining strategies can be used for the same shape. Three tool path patterns were applied to the free-form surface in Fig. 3. Besides these three alternatives, the zig-zag type was used together with two different cut angles (0° and 45°). Tool-path strategies were compared in terms of cutting force, deflection, IMRR, dimensional error values and sound pressure values. Constant pick feed of 3 mm was used for all cases. In cutting tests, spindle speed was 600 rpm. The cutter is parallel to Z axis, and the maximum and minimum depths are 5.5 mm and 1.5 mm respectively for this part.
2.3. Cutting forces and tool deflection measurements
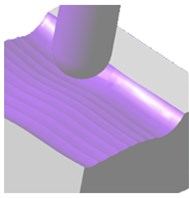
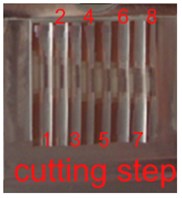
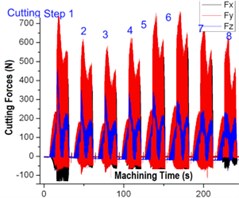
Cutting force measurements (Fx, Fy, and Fz) were made using a Kistler 3-component piezoelectric type 9257 A dynamometer. The cutting force values were downloaded from the electronic unit reserved onto a notebook and after processing of the measured signal analysis is executed using Kistler software. The machined surface, CAM simulation and cutting forces were shown in Fig. 4.
Fig. 4a) CAM simulation, b) machined part, c) force values for experiment 10
a)
b)
c)
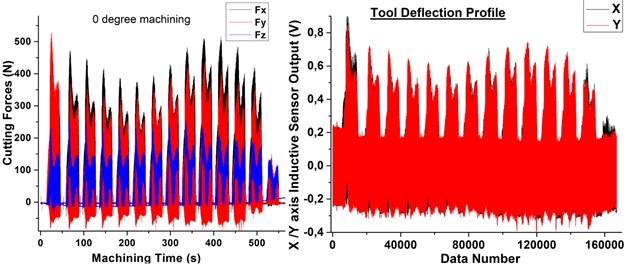
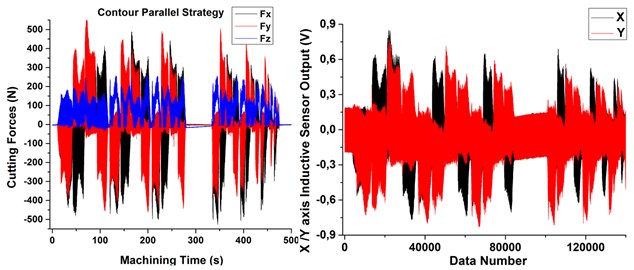
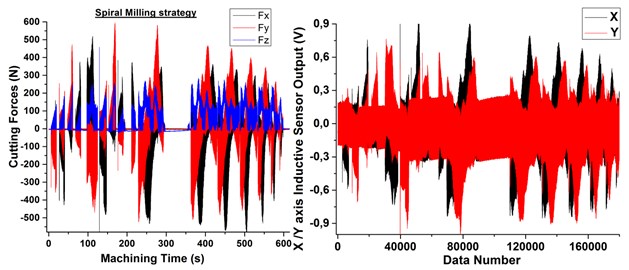
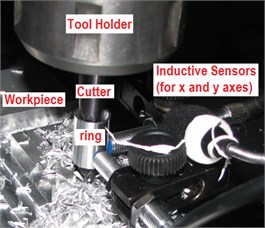
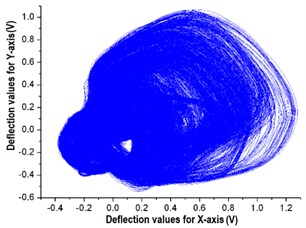
Machining forces are the principal factors managing cutting precision, surface properties, chatter, energy demands, and cutter wear. Cutting forces and tool deflection values were measured for various tool path patterns as shown in Fig. 5. Cutter deflection measurement has been performed using two accurate LVDT sensors installed at 90° and from another sensor and an aluminum ring was fixed to the flute of the cutting tool as seen in Fig. 6.
2.4. Measurement of machining errors
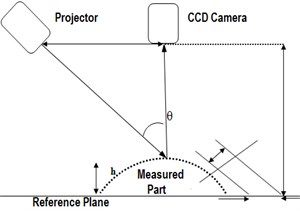
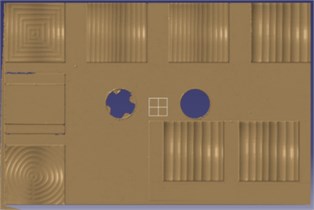
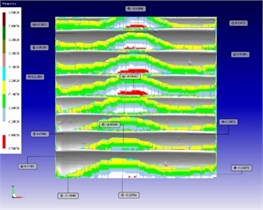
A 3D optical measuring system based on fringe projection was used to determine the machining errors in the workpieces by analyzing the different textural properties to the body. The 3-D optical scanning provided point cloud, curves and meshed data. The obtained data were indexed into the CAD software, which computed and displayed the deviations between the two data sets, as shown in Fig. 7.
2.5. Accurate calculation of instantaneous MRR and removed volume
The in-house API simulation software based on B-rep was used for calculation of instantaneous MRR and removed volume values. The IMRR value can be obtained by calculating the tool/machine part engagement geometry through the teeth transition duration (tp) and the volume is divided by tp to compute the average MRR. The chip thickness at any position on the cutting tool is determined by dividing the scalar product of the feed rate (f) with the normal vector (Ns) by the number of cutter tooth (nt), multiplied by the tool rotation values (N-rpm) [1].
Fig. 5Cutting forces and tool deflection values for three tool path patterns
a)
b)
c)
Fig. 6a) Deflection measurement set-up, b) deflection profile for experiment 10
a)
b)
Fig. 7a), b), c) Obtaining of CAD model and error values, d) of surfaces using fringe projection
a)

b)
c)
d)
The material removal rate is the ratio which each cutting tool teeth removes material. The IMRR value is calculated via integrating the chip thickness along cutter flute that is actually engaged in the tool/workpiece contact zone as seen in Eq. (1) and Fig. 8 [1]:
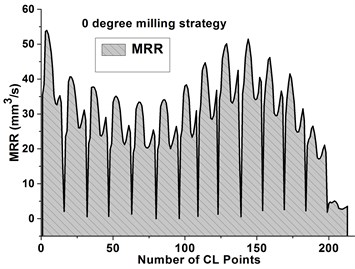
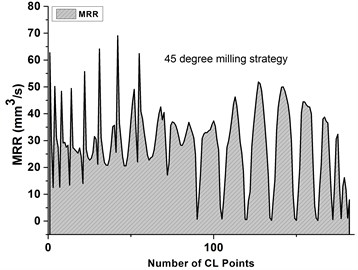
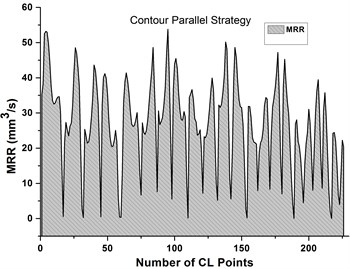
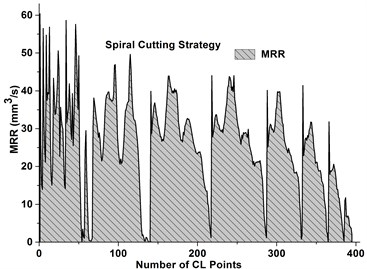
IMRR values were obtained for the different cutting strategies as shown in the Fig. 9. It is obvious that SPL value, cutting forces and tool deflection profiles and frequency values raise as the IMRR value raises. IMRR values were presented for three tool path patterns as shown in Fig. 9.
2.6. Measurements of sound pressure level
In this paper, the sound collected from experiments were analyzed in the time and frequency domain so as to identify the frequency scope in the acoustic signal that could then be used for process observing. The microphone was fixed at a length of nearly 30 mm from the cutter and acoustic signals are measured, recorded and analyzed on a software as shown in Fig. 2. In order to verify the repeatability of the experiments, the sound signal should be collected for each experiment and several times. The periodic impacts of the cutter with the machined part and the resulting tool deflection and chatter that arises hence creates a sound signal. This signal is a transmission of impact energy that propagates through the air and contains information about the process. Sound pressure is a logarithmic measure of the effective sound pressure of a sound relative to a reference value. It is measured in decibels (dB) above a standard reference level [42]:
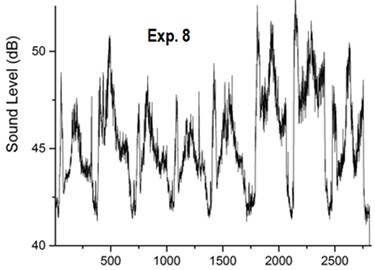
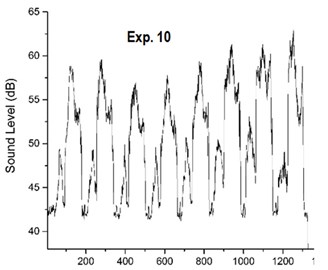
where Pref is the reference sound pressure and Prms is the rms sound pressure being measured. The sound signal was obtained by a microphone, and amplified using the DAQ module. Sound pressure values were presented as shown in Fig. 10 and 11 for different tool path patterns and feed rate values, respectively. It is clear that the variations in sound pressure values show a similar tendency to cutting force, tool deflection and IMRR.
Fig. 8a) The contact area graph, b) removed volume simulation [1]
![a) The contact area graph, b) removed volume simulation [1]](https://static-01.extrica.com/articles/18475/18475-img20.jpg)
a)
![a) The contact area graph, b) removed volume simulation [1]](https://static-01.extrica.com/articles/18475/18475-img21.jpg)
b)
Fig. 9IMRR values for various cutting strategies
a)
b)
c)
d)
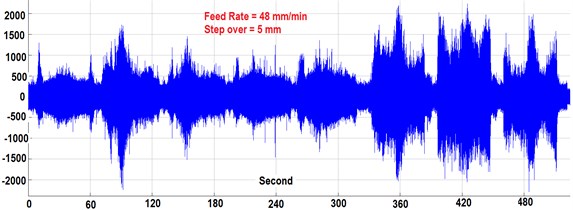
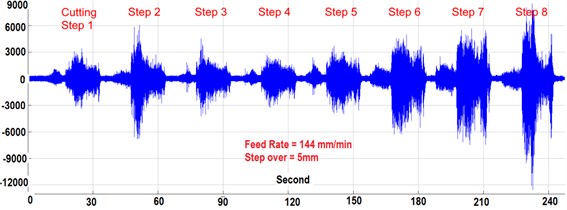
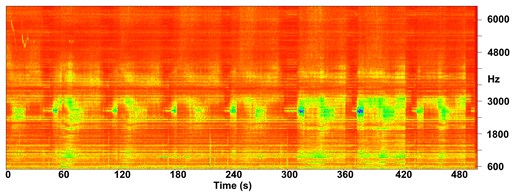
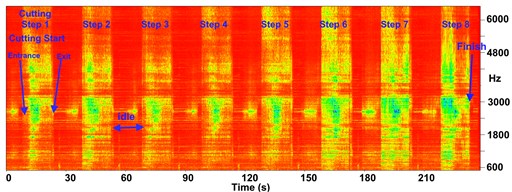
Two-sound signal variation for the different feed rate values are given as shown in Fig. 12. The audio signal collected from experiments were computed in the time/frequency domain in order to identify the frequency range in the acoustic signal that can be then used for observing of sculptured surface machining. The analysis generated a spectrogram that illustrates the acoustic signal arising from the machining process. The sample case spectrogram displays the amplitude of frequency spectrum of the milling sound recorded for different machining time as shown in Fig. 13. The horizontal direction denotes time and vertical axis represents frequency. The magnitude of a specific frequency is figured using the colour intensity of each cutting cycle. The different developments that happened during the cutting process are marked.
Fig. 10Variation of SPL values for experiments 8 and 10
a)
b)
Fig. 11Variation of SPL values for various tool path strategies
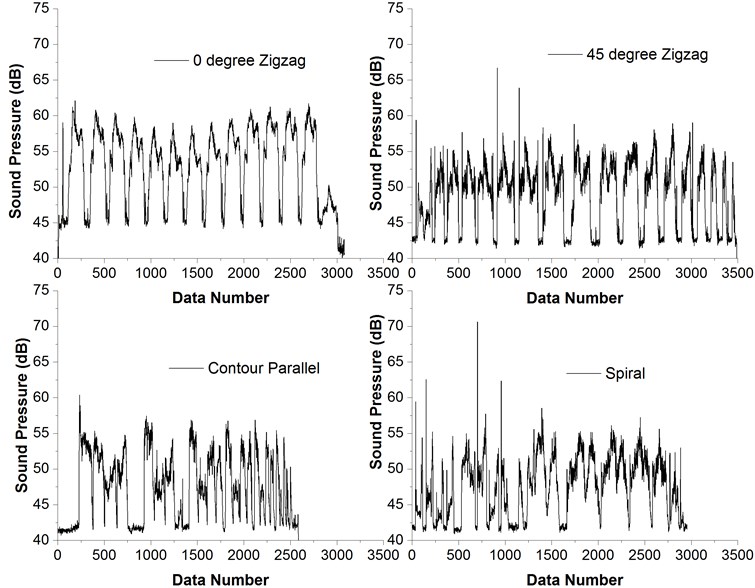
Fig. 13 reveals the comparison of the frequency spectrums of the acoustic signal for 48 and 144 mm/rev feed values. When the Fig. 13(b) is analyzed, it becomes clear that cutting process occurs in 8 steps. SPL values of each cutting step, entry and exit points of the cutter onto workpiece, and the corresponding frequency values are clearly seen. A higher milling forces and tool deflection mean the trend to machining sound is bigger. The magnitudes of the fundamental acoustic signal frequencies when performing feed rate of 144 mm/min were monitored to be larger than that of feed rate of 48 mm/min as seen in Figs. 13 and 16. More considerably for feed rate of 144 mm/min, the harmonics between 2600 and 3000 Hz were denotive that tool deflections probably due to ball end mill run-out appeared with high magnitudes. It can be understood that peak frequency values range between 2600-3000 Hz and that they raise since more removed materials are made distant in 8th cutting step.
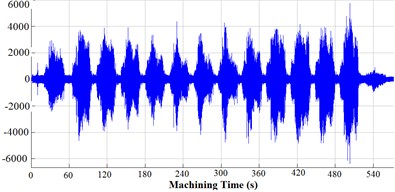
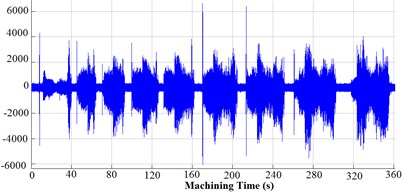
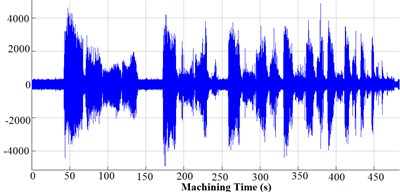
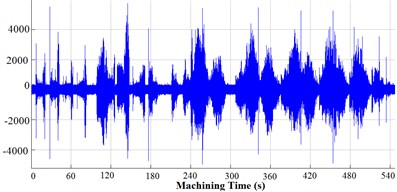
Fig. 14 demonstrates cutting acoustic signal in time domain waveform for 0° zigzag, 45° zigzag contour parallel, and spiral milling strategies. It is clear that the variations in acoustic signal values shows a similar tendency to cutting force, tool deflection and IMRR.
Fig. 12Samples of the measured sound signal for experiments: a) 8, b) 10
a)
b)
Fig. 13Frequency spectrograms of cutting sound for experiments: a) 8, b) 10
a)
b)
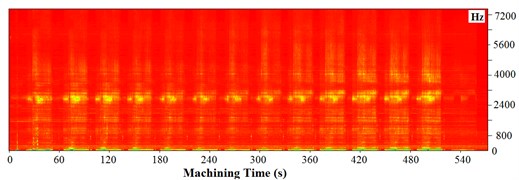
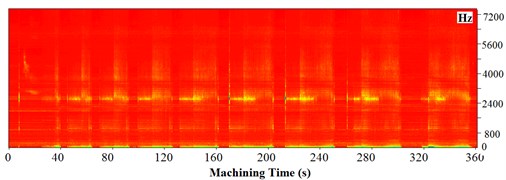
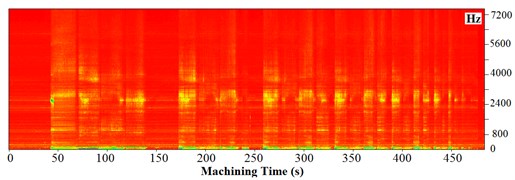
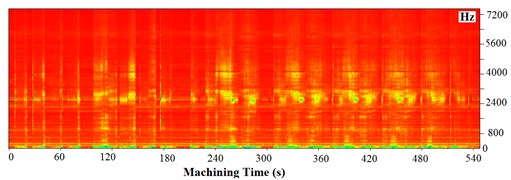
Fig. 15 shows spectrogram of the time tracking of the magnitude of acoustic signal at the frequencies of the processing measured signal for various tool path trajectories. The sound was caused by a friction between cutting tool and workpiece material in milling process. The increase in sound signal magnitude representing the cutter/workpiece engagement is seen at that point. The increase of contact area and MRR values caused the change of the sound signal.
Fig. 14Sound signal for: a) 0° zigzag, b) 45° zigzag, c) contour parallel, d) spiral strategies
a)
b)
c)
d)
3. Statistical analyses of experimental results
3.1. Regression analysis
The feed and side step values were taken into consideration in the mathematical relationship for the cutting forces, tool deflection, machining error and sound pressure level. The correlation between factors (feed rate and side step) and cutting forces, tool deflection, machining error and sound pressure level for ball end milling of Al 7075 were acquired by linear regression:
where, f – feed rate in mm/min, Ss – side step value in mm, CF – cutting force in N, TD – tool deflection in mm, ME – Machining Error (mm) and SPL – sound pressure level in dB. The models obtained are as follows. In regression analysis, R2 is the regression coefficients (R2> 0.80) for the models denote that the fit of the measurement result is adequate.
3.2. Analysis of variance (Anova) of results
Analysis of Variance is an approach most commonly used for calculating significant parameters on experimental results and predicting their effects. The percentage contribution P can be computed using Eq. (7):
where SSd is the sum of squared deviations. Analysis of variance results are given in Table 3.
Fig. 15Spectrograms for: a) 0°zigzag, b) 45° zigzag, c) contour parallel, d) spiral tool paths
a)
b)
c)
d)
Percent (% P) is defined as the significance rate of the control parameters on the results. In the analysis the F-ratio is a ratio of the mean square error to the residual error and is traditionally used to determine the significance of a factor. It can be seen from Table 3 that side step and feed rate, influence cutting forces by 1.17 %, 98.48 % in the milling of free-form surfaces, consecutively. The main effect plot for cutting forces are depicted in Fig. 16. It is shown that the milling forces increase with rise in the feed value. It is observed from main effects plots that, as feed rate increases from 48 to 144 mm/min, cutting forces increases from about 345 N to 740 N for side step 3 mm. It is observed that cutting force increases from 370 to 760 N when the feed rate value for side step 5 mm is raised from 48 to 144 mm/min. Side step’ effect on cutting forces hasn’t been observed.
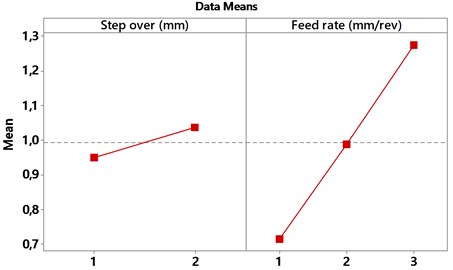
It can be observed from Table 3 that the feed rate was found to be the only significant factor on the tool deflection with percent contribution of 94.59 %, followed by step over which contributed 3.40 % in the milling of free-form surfaces. In Fig. 17, the main effect plots for cutter deflection are plotted. Increasing of feed rate leads to increase tool deflection. It is observed from main effects plots (Fig. 17) that, as feed rate increases from 48 to 144 mm/min, tool deflection increases from about 0,7 to 1,25 V for side step 3 mm. It is observed that tool deflection value increases from 0.73 to 1.3 V when the feed rate value for side step 5 mm is raised from 48 to 144 mm/min. It was observed that the step over value has less influence on the magnitude of tool deflection. In Fig. 18, machining sound signals in various feed rate and step over values are given and compared. The signal values increased with the rise of feed rate values.
Table 3ANOVA results for cutting forces, deflection, sound pressure and milling errors
Input parameters | Degree of freedom (DoF) | Seq sum of squares (S) | Adj MS | F ratio (F) | Contribution P (%) | |
Cutting forces | Side step | 1 | 1838 | 1838 | 10,46 | 1,17 % |
Feed rate | 1 | 154056 | 154056 | 876,84 | 98,48 % | |
Error | 3 | 527 | 176 | 0,33 % | ||
Total | 5 | 156421 | 100 % | |||
Tool deflection | Side step | 1 | 0,011267 | 0,162433 | 5,07 | 3,40 % |
Feed rate | 1 | 0,313600 | 0,313600 | 141,12 | 94,59 % | |
Error | 3 | 0,006667 | 0,002222 | 2,01 % | ||
Total | 5 | 0,331533 | 100 % | |||
Sound pressure | Side step | 1 | 0,0449 | 0,0449 | 0,02 | 0,048 % |
Feed rate | 1 | 85,2668 | 85,2668 | 35,18 | 92,09 % | |
Error | 3 | 7,2710 | 2,4237 | 7,85 % | ||
Total | 5 | 92,5826 | 100 % | |||
Machining error | Side step | 1 | 0,06009 | 0,06009 | 12,12 | 48,59 % |
Feed rate | 1 | 0,04870 | 0,04870 | 9,82 | 39,38 % | |
Error | 3 | 0,01488 | 0,00495 | 12,03 % | ||
Total | 5 | 0,12367 | 100 % |
Fig. 16Main effects plot-data means for cutting forces
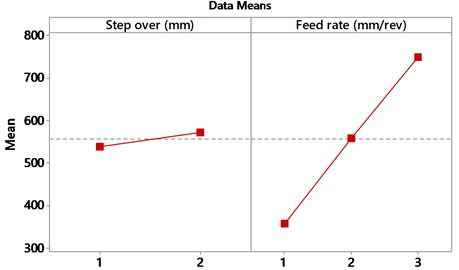
Fig. 17Main effects plot-data means for tool deflection
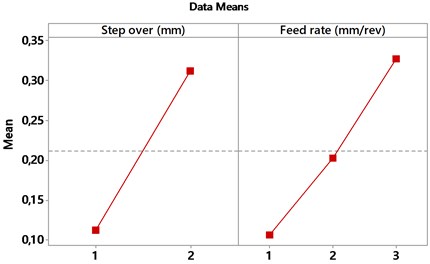
It can be viewed from Table 4 that step over and feed speed influence sound pressure level by 0.048 %, 92.09 % in the milling of free-form surfaces, consecutively. The main effects plot indicates that sound pressure value is significantly influenced by feed rate as shown in Fig. 19. It is clearly seen from the graphs that sound pressure level increases as feed rate increases, this may be due to the fact that when feed rate increases the amount of material coming into contacts with cutting tool increases, therefore the load on the cutter also increases. The variation in step over has no effects on the sound signal. In Fig. 20, the main effect plots for machining errors are plotted. Increasing of feed rate and step over lead to increase machining errors as shown in Fig. 19. It can presented from Table 4 that cutting conditions were found to be significant factors on the milling error with percent contribution of 39.38 % and 48.59 %, respectively.
Fig. 18SPL results for different milling conditions
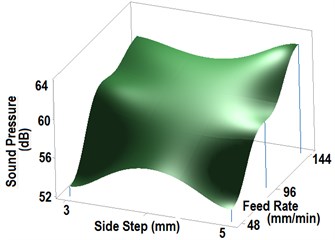
Fig. 19Main Effect plots-data means for SPL Results
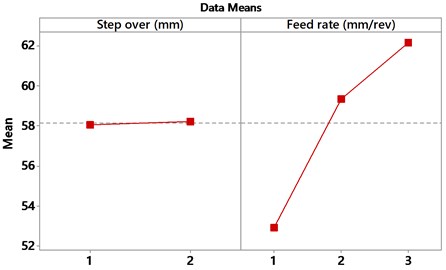
Fig. 20Main effect plot-data means for machining error results
4. Discussion of experimental results
One of the main sources of unwanted dimensional error in rough machining process is the cutter deflection resulting from the periodic milling forces. In Fig. 21 are shown the variations observed in cutting forces, cutting tool deflection, sound pressure level and machining errors as a function of the feed rate values for different step over values. With the increment of feed rate, cutter deflection and forces also increased parallel to the rise of acoustic signal values as shown in Fig. 19. It is observed from Fig. 19 that, as feed rate increases from 48 to 144 mm/min, sound pressure increases from about 52 to 61 dB for side step 3 mm. It is observed that sound pressure level increases from 53 to 63 dB when the feed rate value raises from 48 to 144 mm/min for side step 5 mm is. By lowering the feed value as 48 mm/min, the minimum sound signal levels and cutter deflection were acquired. It can be probable to express the relationship between cutter deflection and acoustic signal values.
When the acquired SPL and error graphics for different step over values were examined, it was observed that machining errors values increase with the rising of sound signal values. Besides, machining errors decrease with the decreasing of sound signal values. In accordance with Fig. 21, for the different step over values, the largest SPL of 63 dB results in the highest machining errors value of 0,47 mm at the test 10. Besides, the minimum SPL of 52 dB is obtained at the error value of 0,13 mm at the test 5. Step over value has no significant effect on the machining surface errors. It was observed that the step over value has less influence on the magnitude of tool deflection, cutting forces and sound pressure level.
Fig. 21Comparison of all experimental results with SPL values for different conditions
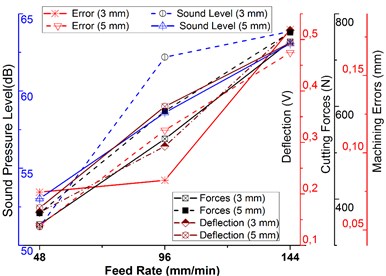
Fig. 22Comparison of all experimental results with SPL values for cutting strategies
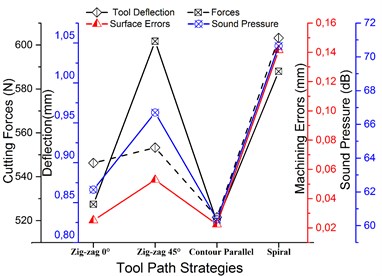
It can be observed from experimental results that feed rate and step over affect sound pressure level by 92.09 %, 0.048 %, tool deflection by 94.59 %, 3.40 %, cutting forces by 98,48 %, 1,17 % and machining errors by 39.38 % and 48.59 %, in the milling of free-form surfaces, consecutively. The relationship between cutter deflection and cutting forces/cutter deflection and sound signal value/ cutting forces and sound signal value/ machining error and sound signal value during milling at all feed rates is strong, positive, and actuarially significant. Correlation coefficients between sound pressure level and other results (forces, deflection and machining errors) at feed rate values were better than R2= 0.7. This result is supported by the works of Jaromír [43] and Bagci [42], they observed that sound signal values increased with the milling forces due to rising of the feed rates. When the feed rate value was rised from 48 to 144 mm/min, the magnitudes of the frequency elements increased.
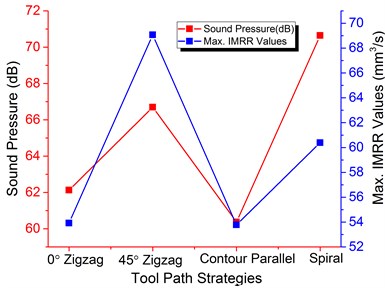
It is observed from Fig. 22 that when milling with spiral strategy, the highest cutting force, tool deflection and sound pressure values were observed followed by 45° zigzag, 0° zigzag and contour parallel strategies, respectively. It results from the interrupted cutting which occurs at the tool entry and exit positions at the machined part. The high impact forces are created when cutter steps into the part. Because of a sudden increase in removed volume as shown in Fig. 9, the in feed executed inside the machine part results in excessive vibrations due to increased cutting forces and tool deflections. Employing contour parallel strategy achieves the lowest cutting force magnitude. In complex surface machining, cutting depth and IMRR values are invariably fluctuating at each cutter location point, for this reason different levels of surface-errors are left on free form surface. Since the comparison between strategies takes place in similar machining conditions, tool-chip contact area and IMRR values are main reasons for sound pressure differences between various strategies as shown in Fig. 23.
Fig. 23Relationship between Max. IMRR and sound pressure values for different strategies
5. Conclusions
The effect of various tool path strategies on cutter deflection, cutting force, surface error, IMRR and acoustic signal values when rough machining of complex surface of Al 7075-T651 was investigated. Additionally, the influence of radial depth of cut and feed rate on output characteristics was evaluated in accordance with ANOVA and regression analyses. This work focuses on the potentiality of using sound signal to observe the complex surface machining at various process parameters. The conclusions obtained from the present study are as follows:
1) The main result of this paper is that the acoustic signal collected during the machining of free form was well correlated through the ball end milling with the cutting forces, IMRR, tool deflection and surface error values where the variations in feed rate are explicitly observed. With the increase of feed rate, instantaneous material removal rate increased parallel to rising of machining sound signal, milling forces, tool deflection and machining errors. It was observed that the step over value has less influence on the magnitude of tool deflection, cutting forces, machining error and sound pressure level.
2) For the different step over values, the higher SPL value (63 dB) lead to the higher machining errors value of 0,47 mm at the test 10. On the other hand, the minimum SPL value (52 dB) is recognized at the error value of 0,13 mm at the test 5.
3) As the data presented in this paper have shown that the use of various tool path styles when rough milling of free form surfaces has significant effects on the tool deflection, cutting forces, surface error, and sound pressure. In general, contour parallel tool path appears to provide preferred results in terms of lower IMRR values, cutting forces, deflections, sound pressure and machining errors values. It is observed that when milling with spiral strategy, the highest cutting force is observed as a consequence of tool-chip contact area followed by 45° zigzag, 0° zigzag and contour parallel strategies, respectively. Because of an abrupt increment in removed volume, the in feed executed inside the machine part results in excessive vibrations due to increased cutting forces and tool deflections.
4) The acoustic signal which has a reliable relation to the IMRR and removed volume values were detected and experimental results could be figured out with sound pressure. It is concluded that sound pressure and frequency values raise as the tool/workpiece engagement area and removed volume values increases.
References
-
Kurt M., Bagci E. Feedrate optimisation/scheduling on sculptured surface machining: a comprehensive review, applications and future directions. The International Journal of Advanced Manufacturing Technology, Vol. 55, Issue 9, 2011, p. 1037-1067.
-
Lasemi A., Xue D., Gu P. Recent development in CNC machining of freeform surfaces: a state-of-the-art review. Computer-Aided Design, Vol. 42, Issue 7, 2010, p. 641-654.
-
Chen Y., Gao J., Deng HG., Zheng D., Chen X., Kelly R. Spatial statistical analysis and compensation of machining errors for complex surfaces. Precision Engineering, Vol. 37, Issue 1, 2013, p. 203-212.
-
Habibi M., Arezoo B., Nojedeh M. V. Tool deflection and geometrical error compensation by tool path modification. International Journal of Machine Tools and Manufacture, Vol. 51, Issue 6, 2011, p. 439-449.
-
Desai K. A., Rao P. V. M. Effect of direction of parameterization on cutting forces and surface error in machining curved geometries. International Journal of Machine Tools and Manufacture, Vol. 48, Issue 2, 2008, p. 249-259.
-
Albertía M., Ciuranaa J., Rodriguez C. A. Experimental analysis of dimensional error vs cycle time in high speed milling of aluminum alloy. International Journal of Machine Tools and Manufacture, Vol. 47, 2007, p. 236-246.
-
Erdim H., Lazoglu I., Kaymakci M. Free-form Surface machining and comparing feedrate scheduling strategies. Machining Science and Technology, Vol. 11, Issue 1, 2007, p. 117-133.
-
Kaymakci M., Lazoglu I. Tool path selection strategies for complex sculptured surface machining. Machining Science and Technology, Vol. 12, 2008, p. 119-132.
-
Gok A., Gologlu C., Demirci H. I. Cutting parameter and tool path style effects on cutting force and tool deflection in machining of convex and concave inclined surfaces. The International Journal of Advanced Manufacturing Technology, Vol. 69, 2013, p. 1063-1078.
-
Shajari S., Sadeghi M. H., Hassanpour H., Jabbaripour B. Influence of machining strategies on surface roughness in ball end milling of inclined surfaces. Advanced Materials Research, Vols. 488-489, 2012, p. 836-840.
-
Izol P., Vrabel M., Mankova I. Comparison of milling strategies when machining freeform surfaces. Materials Science Forum, Vol. 862, 2016, p. 18-25.
-
Matras A., Kowalczyk R. Analysis of machining accuracy during free form surface milling simulation for different milling strategies. Proceedings of the SPIE, Vol. 9290, 2014, p. 1-7.
-
Schützer K., Abele E., Stroh C., Gyldenfeldt C. Using advanced CAM-systems for optimized HSC-machining of complex free form surfaces. Journal of the Brazilian Society of Mechanical Sciences and Engineering, Vol. 29, Issue 3, 2007, p. 313-316.
-
Jemielniak K. Commercial tool condition monitoring systems. The International Journal of Advanced Manufacturing Technology, Vol. 15, 1999, p. 711-721.
-
Burke L. I., Rangwala S. Tool condition monitoring in metal cutting. A neural network approach. Journal of Intelligent Manufacturing, Vol. 2, Issue 5, 1991, p. 269-280.
-
Tlusty J., Andrew G. C. A critical review of sensors of unmanned machining. CIRP Annals-Manufacturing Technology, Vol. 32, Issue 1, 1983, p. 563-577.
-
Rangwala S., Dornfeld D. Sensor integration using neural networks for intelligent tool condition monitoring. Journal of Engineering for Industry, Vol. 112, Issue 3, 1990, p. 219-228.
-
Okafor C., Adetona O. Predicting quality characteristics of end-milled parts based on multi-sensor integration using neural networks, individual effects of learning parameters and rules. Journal of Intelligent Manufacturing, Vol. 6, Issue 6, 1995, p. 389-400.
-
Byrne G., Dornfeld D., Inasaki I., Ketteles G., Knig W., Teti R. Tool condition monitoring (TCM)-the status of research and industrial application. CIRP Annals-Manufacturing Technology, Vol. 44, Issue 2, 1995, p. 541-567.
-
Dornfeld D. A. Monitoring of machining process-literature review. CIRP Annals-Manufacturing Technology, Vol. 41, Issue 1, 1992, p. 93-96.
-
Cyra G., Tanaka C. The effects of wood-fiber directions on acoustic emission in routing. Wood Science and Technology, Vol. 34, 2000, p. 237-252.
-
Ko P. L., Liu Z. S., Cvitkovic R., Donovan M., Loewen R., Krishnapper G. Tool wear monitoring for routing MDF. Proceedings of the 14th International Wood Machining Seminar, 1999, p. 609-619.
-
Murata K., Nishimura K., Ikami Y., Ebihara M. Sawing performances of band saws treated with new filling methods II. Power consumption in sawing, sawing accuracy, and roughness of sawn surface. Mokuzai Gakkaishi, Vol. 39, Issue 11, 1993, p. 1239-1245.
-
Banshoya K., Ohsaki H., Nagatomi K., Murase Y. Relationship between cutting sound and tool wear in machine boring of wood and wood based materials. Mokuzai Gakkaishi, Vol. 40, Issue 4, 1994, p. 521-528.
-
Raja J. E., Kiong L. C., Soong L. W. Hilbert-Huang transform based emitted sound signal analysis for tool flank wear monitoring. Arabian Journal for Science and Engineering, Vol. 38, Issue 8, 2013, p. 2219-2226.
-
Kopac J., Sali S. Tool wear monitoring during the turning process. Journal of Materials Processing Technology, Vol. 113, Issues 1-3, 2001, p. 312-316.
-
Mannan M. A., Kassim A. A., Jing M. Application of image andsound analysis techniques to monitor the condition of cutting tools. Pattern Recognition Letters, Vol. 21, Issue 11, 2000, p. 969-979.
-
Teti R., Baciu I. L. Neural network processing of audible sound parameters for sensor monitoring of tool conditions. Intelligent Computation in Manufacturing Engineering, Vol. 4, 2004, p. 385-390.
-
Lu M. C., Kannatey Asibu Jr. E. Analysis of sound signal generation due to flank wear in turning. Journal of Manufacturing Science and Engineering, Vol. 124, Issue 4, 2002, p. 799-808.
-
Wilcos S. J., Reuben R. L., Souquet P. The use of cutting force and acoustic emission signals for the monitoring the tool insert geometry during rough face milling. International Journal of Machine Tools and Manufacture, Vol. 32, Issue 4, 1997, p. 481-494.
-
Nagatomi K., Yoshida K., Banshoya K., Murase Y. Recognition of wood cutting conditions through cutting sounds I. Effects of tool system’s stiffness and tool wear on the generation of sound in cutting parallel to the grain. Mokuzai Gakkaishi, Vol. 39, Issue 11, 1993, p. 521-528.
-
Trabelsi H., Kannatey-Asibu E. Jr. Pattern-recognition analysis of sound radiation in metal cutting. The International Journal of Advanced Manufacturing Technology, Vol. 6, 1991, p. 220-231.
-
Teti R., Jemielniak K., O’Donnell G., Dornfeld D. Advanced monitoring of machining operations. CIRP Annals-Manufacturing Technology, Vol. 59, Issue 2, 2010, p. 717-739.
-
Tekiner Z., Yesilyurt S. Investigation of the cutting parameters depending on process sound during turning of AISI 304 austenitic stainless steel. Materials and Design, Vol. 25, Issue 6, 2004, p. 507-513.
-
Quintana G., Ciurana J., Ferrer I., Rodriguez C. A. Sound mapping for identification of stability lobe diagrams in milling processes. International Journal of Machine Tools and Manufacture, Vol. 49, Issues 3-4, 2009, p. 203-211.
-
Downey J., O’Leary P., Raghavendra R. Comparison and analysis of audible sound energy emissions during single point machining of HSTS with PVD TiCN cutter insert across full tool life. Wear, Vol. 313, Issues 1-2, 2014, p. 53-62.
-
Delio T., Tlusty J., Smith S. Use of audio signals for chatter detection and control. Journal of Engineering for Industry, Vol. 114, Issue 2, 1992, p. 146-157.
-
Schmitz T., Davies M., Kennedy M. Tool point frequency response prediction for high-speed machining by RCSA. Journal of Manufacturing Science and Engineering, Vol. 123, 2001, p. 700-707.
-
Schmitz T. L., Medicus K., Dutterer B. Exploring once-per-revolution audio signal variance as a chatter indicator. Machining Science and Technology, Vol. 6, Issue 2, 2002, p. 215-233.
-
Schmitz T. L. Chatter recognition by a statistical evaluation of the synchronously sampled audio signal. Journal of Sound and Vibration, Vol. 262, Issue 3, 2003, p. 721-730.
-
Weingaertner W. L., Schroeter R. B., Polli M. L., Gomes J. de Oliveira Evaluation of high-speed end-milling dynamic stability through audio signal measurements. Journal of Materials Processing Technology, Vol. 179, Issues 1-3, 2006, p. 133-138.
-
Bagci E. Monitoring and analysis of MRR-based feedrate optimization approach and effects of cutting conditions using acoustic sound pressure level in free-form surface milling. Scientific Research and Essays, Vol. 6, Issue 2, 2011, p. 256-277.
-
Jaromír A. Machinability assessment of an eutectoid steel by measurement of cutting forces. Journal of Manufacturing Engineering, Vol. 3, 2007, p. 28-32.

