Abstract
A considerable number of studies for vortex induced vibration (VIV) under uniform flow have been performed. However, investigation of VIV under middle flow is scarce. An experiment for VIV under middle flow was conducted in a deep-water offshore basin. Various measurements were obtained by the fiber Bragg grating strain sensors placed on the riser, and VIV under the effect of middle flow with was investigated. Results show that the riser vibrates at different order natural frequencies along the water depth in the CF and IL directions appearing as the multi-frequencies under middle flow. The variation vortex shedding frequencies along the riser under middle flow may generate different wake modes and vibration modals as the corresponding vortex shedding frequencies approach the riser natural frequencies. The dominant vibration frequency of the entire riser is consistent, and determined by high order natural frequency and the corresponding closing vortex shedding frequencies under the middle flow. Meanwhile, the vibration modal under middle flow appears multi-modals and other lower modal have effect on riser vibration. The VIV mechanism under middle flow possesses some aspects similar to those of uniform flow and several unique features.
1. Introduction
Marine risers are key equipment in deep-water drilling and production. These risers connect the platform and subsea wellhead in sea water. Marine risers can be regarded as slender and flexible strings in the ocean structure. Thus, when ocean currents flow across the marine risers, vortices are easily formed. When the vortex shedding frequencies approach the natural frequencies of the risers, lock-in phenomenon occurs. In this condition, the risers may vibrate significantly both in the in-line (IL) and cross-flow (CF) directions under the influence of vortex-induced forces. This phenomenon is called vortex-induced vibration (VIV). This occurrence may lead to fatigue problems and damage to marine risers.
Several studies have focused on VIV over the past several decades. The following scholars investigated and comprehensively introduced the VIV phenomenon. Feng [1] conducted a wind tunnel experiment investigating the flow around circular cylinders and studied the relationship among response frequency, displacement, and phase. Vandiver et al. [2-4] proposed a number of theories and conducted experiments on long flexible cylinders, subsequently developing the well-known VIV analysis software “SHEAR7”. Sarpkaya [5-7] presented many useful coefficients under different Reynolds numbers and showed the hysteresis effect on VIV. Williamson [8-11] performed numerous experiments on VIV and explored the influence of mass and damping on the phenomenon under study. He also presented new vortex wake modes. Chucheepsakul et al. [12-14] investigated a 3D model for the vibration of marine risers. Guo et al. [15-17] developed a comprehensive theory and experimental study on the influence of internal flow on VIV. Larsen et al. [18, 19] studied a model for VIV and riser fatigue and developed the VIV analysis software “VIVANA” with Marinetek. Abdelkefi [20] investigated energy harvesting from vortex-induced vibrations and indicated that the nonlinearities result in a hardening behavior for some values of the load resistance. Mehmood et al. [21] studied the effects of a non-linear energy sink on VIV and found that multiple stable responses of the coupled system for different mass ratios and damping coefficient of the sink depended on the initial conditions. Dai et al. [22, 23] researched the effects of time-delay feedback control on the responses of an elastically mounted circular cylinder subjected to vortex-induced vibrations. Many other studies contributed to the knowledge on VIV under uniform flow.
However, ocean currents do not assume uniform flow, according to the Ekman drift current theory. By contrast, they exhibit many flow types, including shear, oscillatory, and middle flow. Therefore, investigating the VIV mechanism under the different flow types is necessary.
Vandiver [2,3] suggested shear parameters after considering several possibilities and presented the measured response on a drilling riser in the North Sea. Newman and Karniadakis [24] investigated VIVs of an infinitely long flexible cable at Reynolds numbers Re= 100 and Re= 200 and showed that a standing wave cable response produces an interwoven pattern of vorticity while a travelling wave cable response produces oblique vortex shedding. Furnes [25] employed the mathematical formulation to simulate the VIVs under arbitrary currents that vary continuously with depth and time. Lucor et al. [26] provided the results of VIV subjected to linear and exponential sheared flows and analyzed the corresponding force distributions. Tognarelli et al. [27] studied the VIV for a long flexible cylinder in linearly sheared currents by the rotating test and analyzed the amplitudes and frequency of the vibration. Chaplin et al. [28] measured the VIV of a model of a vertical tension riser in a stepped current and provided reliable and well-documented data to support the development of predictive models. Marcollo et al. [29] designed experimental equipment to investigate the variation of VIV from single-mode to multi-modal lock-in in a spatially sheared flow. Lie et al. [30] carried out large-scale VIV model testing in linearly sheared flow and found that the riser response was irregular and the degree of irregularity increased with the flow speed. Srinil [31] performed numerical simulations of VIV in varying sheared flow profiles for variable-tension vertical risers. Huang et al. [32] studied a vertical riser VIV under the influence of sheared current by a numerical method and conducted comparisons with published experimental data. Zhao et al. [33] studied the VIV in combined steady and oscillatory flow by solving the two-dimensional Reynolds-averaged Navier-Stokes equations. The same scholar also investigated the effects of flow ratio on cylinder response. Mao et al. [34-37] explored the VIV mechanism under shear flow in a deep-water basin and studied the VIV mechanism under the same shear parameters. Wang et al. [37] studied the VIV mechanism under oscillatory flow and discovered the VIV developing process, including the “building-up,” “lock-in,” and “dying-out” phenomena in oscillatory flow.
Despite these studies, middle flow [38] is a special irregular ocean current with the maximum flow velocity under several hundred meter depth in deep water for the variation of the temperature and salinity, etc. It is usually found in the South China Sea and some other sea areas [39]. Middle flow also can cause marine risers significantly vibrating in drilling and production conditions. Hence, marine risers are at high risk because of VIV. However, research on the effect of middle flow on the VIV for marine risers is scarce.
This study aims to investigate the influence of middle flow on the VIV mechanism by carrying out an experiment in a deep-water basin. The instrumented marine riser was 8 m long and constructed from PVC. The riser was towed vertically in a deep-water basin under middle-flow current generated from the current generation system, and the profile of the middle-flow current was measured by an acoustic Doppler current profiler. Various measurements were obtained by the fiber Bragg grating strain sensors placed on the riser, and the VIV under the effect of middle flow was investigated. The results of this study may serve as a reference on VIV inhibition for subsea engineers, product suppliers, and manufacturers in related industries.
2. Experimental
2.1. Experimental detail
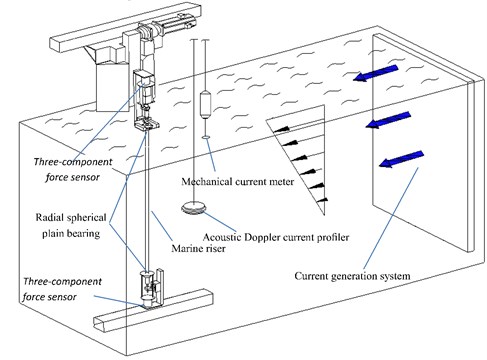
The experiment was carried out in a deep-water basin at the State Key Laboratory of Ocean Engineering in Shanghai Jiao Tong University. The deep-water basin is 50 m long, 40 m wide, and 10 m deep. The experimental setup contained current generation system, one marine riser model, and data acquisition system. An overview of the whole experimental facility is shown in Fig. 1. Test drilling riser model was made of PVC and its main physical properties are listed in Table 1. The riser was towed vertically by the radial spherical plain bearings at the both sides of the riser as shown in Fig. 1.
Fig. 1Overview of the whole experimental setup
The eigenfrequencies of the string with tension (T), length (L) and mass (m) and without bending stiffness (EI) can be described as follow:
where T is the pretension of the riser in experiment in N, L is the length of the riser in m, i is the mode order, m is the mass per unit length in kg.
And eigenfrequencies of the beam with bending stiffness (EI), length (L) and mass (m) and without tension (T) can be calculated as follows:
where EI is the bending stiffness of the riser in N·m2.
Experimental riser model can be regarded as a simply supported beam located in the vertical plane with an axial force. Therefore, its natural frequency is determined by riser mass (m), axial tension (T) and bending stiffness (EI), and the natural frequency of the riser in water can be calculated by the follows [30, 34]:
Combining Eqs. (1)-(3), the following equation can be obtained:
Pretensions were 25 N, 35 N in the experiment and were exerted on marine riser model before the beginning of the experiment. The 1st natural frequency, 2nd natural frequency and 3rd natural frequency in still water with different pretensions were calculated by Eq. (4) and were shown in Table 2. Fiber Bragg grating (FBG) strain sensors placed on the riser are used to capture the VIV response and the arrangements of the FBG strain sensors is depressed in Fig. 2.
Fig. 2Arrangements of the FBG strain sensors on marine riser model
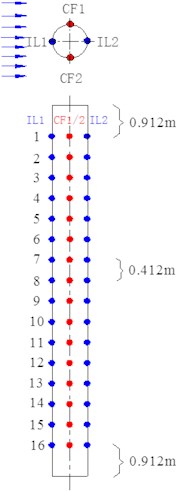
Fig. 3The profile of the middle flow in the experiment
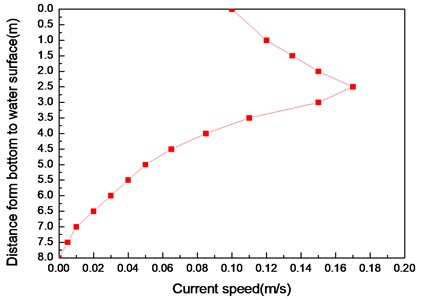
Middle flow was generated by current generation system in our experiment and the flow velocity can be controlled by the power of the current generation system. Meanwhile, the profile of the flow velocity was measured by the mechanical current meter and acoustic Doppler current profiler in the basin. After varying the power of the current generation system, the experimental middle flow was generated and the profile of the experimental middle flow were shown in Fig. 3. The speed at the water surface is 0.1 m/s and the maximum speed is 0.17 m/s at 2.5 m from water surface to bottom.
2.2. Data analysis
The vibration modal and the displacement can be calculated from the experimental strain- time history by modal analysis method. The dominant vibration frequencies and corresponding strain amplitudes in the CF and IL directions can be determined from the strain-time history as obtained through fast Fourier transform (FFT), and the variation of dominant vibration frequency with time can be obtained by wavelet analysis of the strain-time history. Furthermore, static deformation induced by initial drag force is eliminated by the averaging method.
2.2.1. Modal analysis method
The vibration displacement can be described as follows by modal superposition method [30, 34]:
where z is the axial coordination, t is the time, wn(t) is the weight function, ϕn(z) is the mode function, n is the vibration mode order, L is the riser length, N is the mode number of the vibration.
The mode function of the riser which can be regarded as the simply supported beam is described as follows:
The riser displacement and the corresponding second-order special derivatives can be expressed as:
The relation between the strain and curvature can be described as:
where ε(z,t) is the strain signal, R is the riser radius, κ is the curvature.
By combining Eqs. (8) and (9), the following equation can be obtained:
The riser vibration displacement can be expressed by mode superposition with the number of N. Thus, Eq. (10) can be described as follows:
where M is the number of the FBG.
Thus, the riser vibration displacement can be obtained by Eqs. (5) and (11).
2.2.2. Fast Fourier transform wavelet analysis
The dominant vibration frequency can be obtained by fast Fourier transform and the equation of the FFT is depicted as follows [36]:
where f(t) is the original signal data, ω is the vibration period, t is the time.
Wavelet analysis can be used to analyze the degree of the dominant frequency with variation of time and the vibration severity between different orders. The equation for continuous wavelet is defined as follows [40]:
where W(a,τ) is the function, f(t) is the coefficient after wavelet transform, a is the scale factor, τ is the shift factor, ψ(t) is the wavelet mother function.
Morlet continuous wavelet were selected as the wavelet mother function, and Morlet continuous wavelet can be described as follows:
3. Results and discussion
Three main frequencies exist in VIVs: natural frequency of the riser, vortex shedding frequency, and riser dominant vibration frequency. Riser dominant vibration frequency may be determined by vortex shedding frequency and riser natural frequency. Riser natural frequency is determined by riser structure size, physical properties, and riser tension as depicted in Eq. (4). Vortex shedding frequency can be calculated from the well-known Strouhal relation as follows [7, 10]:
where fs is the vortex shedding frequency in Hz; v is the flow velocity in m/s; St is the Strouhal number (= 0.18) [7, 10].
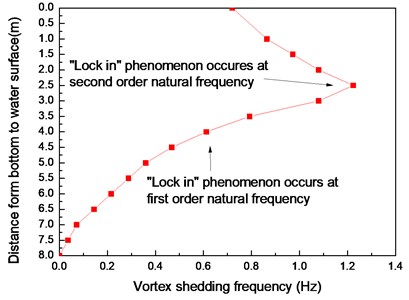
The speed of the experimental middle flow differs considerably from that of a uniform flow, and the speed profile changes with water depth. Thus, vortex shedding frequency changes with the variation of flow speed under middle flow. Vortex shedding frequencies along the axial direction of the riser that are calculated with Eq. (18) are shown in Fig. 4. The vortex shedding frequencies range from 0 Hz to 1.224 Hz under the experimental middle flow, as indicated in Fig. 4.
Sixteen locations were selected to capture the VIV response under middle flow. The experimental results at other locations are similar with those at locations #4, #9, and #15, which are at the third, middle, and bottom parts of the riser, respectively. Thus, we present the results at locations #4, #9, and #15 to analyze and discuss the VIV mechanism under middle flow. The depths of locations #4, #9, and #15 are 2.148, 4.208, and 6.68 m, respectively, and the corresponding flow speeds are 0.15, 0.065, and 0.005 m/s, respectively. Thus, the corresponding vortex shedding frequencies are 1.08, 0.468, and 0.036 Hz, as shown in Fig. 4.
Fig. 4Vortex shedding frequencies along the riser axial direction calculated from Strouhal relation
3.1. Analysis of the dominant vibration frequency in the CF direction
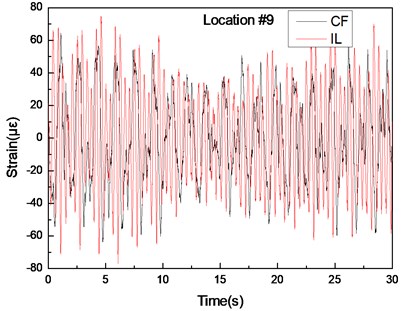
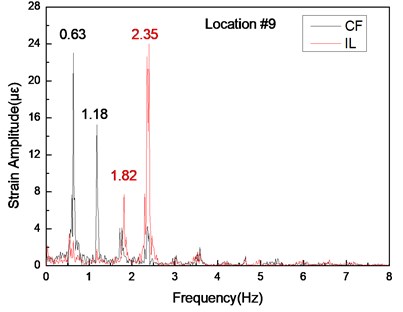
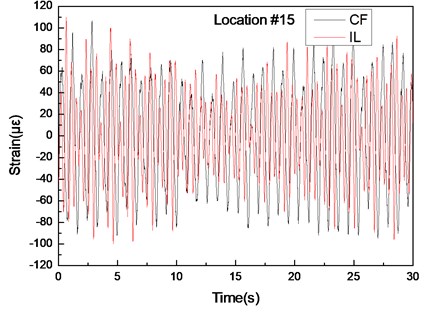
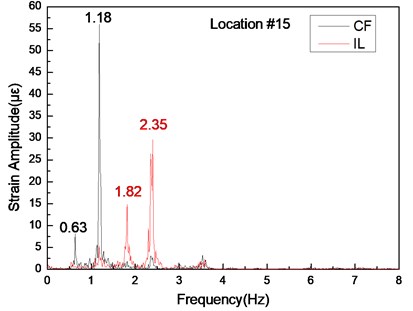
Figs. 5-7 show the strain–time history curves and the corresponding FFT spectrum with a pretension of 25 N. Fig. 8-10 indicate the strain–time history curves and the corresponding FFT spectrum with a pretension of 35 N. According to a number of studies [7, 16], only one peak value may exist in the FFT spectrum of the CF direction under the effect of uniform flow. However, in the current work, two peak values are observed, and this result demonstrates that the dominant frequencies in the CF direction are 0.63 and 1.18 Hz with a pretension of 25 N under middle flow conditions, as presented in Figs. 5(b), 6(b), and 7(b).
Table 1 shows that the theory calculations for the riser natural frequencies in still water with a pretension of 25 N for the first and second orders are 0.45 and 1.15 Hz, respectively. One of the dominant frequencies (0.63 Hz) is extremely close to the first-order natural frequency (0.45 Hz). Another dominant frequency (1.18 Hz) is extremely close to the second-order natural frequency (1.15 Hz). These two dominant frequencies in the CF direction are only slightly larger than the corresponding first- and second-order natural frequencies in still water.
Several studies [26, 35] showed that dominant frequencies may be greater than riser natural frequencies. First, the current can induce an initial drag force in the IL direction, and static deformation can be generated in the IL direction because of the influence of the initial drag force. The effect of static deformation increases the tension of the riser [35]. The riser vibrates in both the CF and IL directions on the basis of the static deformation during VIV, which also increases the real-time riser tension during VIV. Riser natural frequency increases with riser tension [30]. Thus, these two dominant frequencies may be the real-time first- and second-order natural frequencies, and the riser may vibrate at first- and second-order natural frequencies during VIV in our experimental middle flow.
Table 1Main physical properties of the marine riser model
Item | Value |
Model length (m) | 8 |
Thickness (m) | 0.0025 |
Out diameter (m) | 0.025 |
Slenderness ratio | 320 |
Density in air (kg·m3) | 1570 |
Bending stiffness (N·m2) | 36 |
Mass per unit length in air (kg·m) | 0.28 |
Mass per unit length in water (kg·m) | 0.59 |
Mass ratio | 1.2 |
Table 2Natural frequency in still water with pretension of 25 N and 35 N
Frequency (Hz) | Pretension (N) | |
25 | 35 | |
1st Natural frequency in water | 0.45 | 0.53 |
2nd Natural frequency in water | 1.15 | 1.23 |
3rd Natural frequency in water | 2.11 | 2.25 |
Fig. 5Strain responses at locations #4 with pretension of 25 N under the middle flow
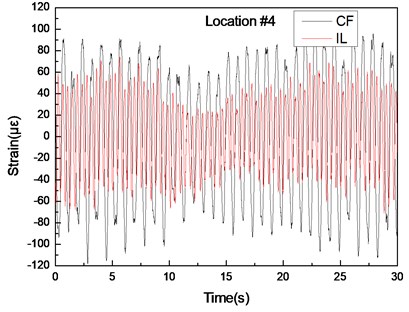
a) Are the strain-time history curves in the IL and CF directions
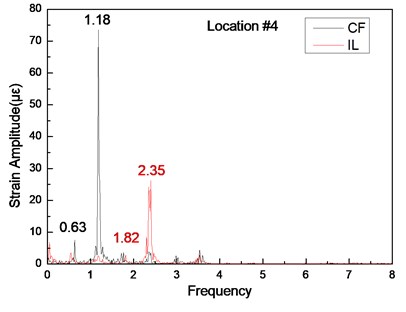
b) Are the corresponding FFT spectra in the IL and CF directions
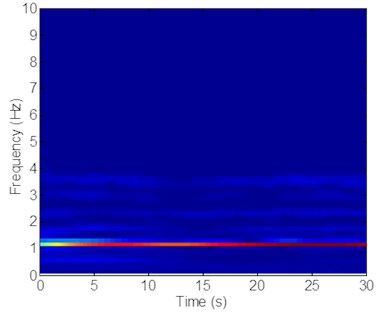
c) Is the time-frequency analysis in the CF direction
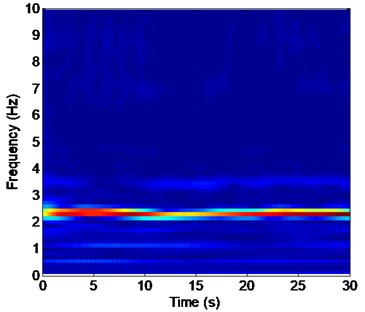
d) Is the time-frequency analysis in the IL direction
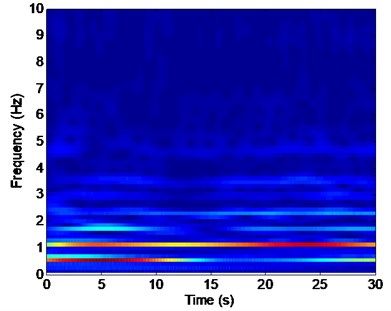
Fig. 4 shows that vortex shedding frequencies range from 0 Hz to 1.224 Hz with varying flow velocities under the experimental middle flow. A previous study [7] showed that when the vortex shedding frequency approaches the riser natural frequency, a “lock-in” phenomenon occurs. Under the effect of the “lock-in” phenomenon, the riser significantly vibrates at its natural frequency in the CF direction. The vortex shedding frequencies close to the area of location #4 (1.08 Hz) approach the second-order natural frequency, and the vortex shedding frequencies close to the area of location #9 (0.468 Hz) approach the first-order natural frequency (Fig. 4). According to a previous study [7], the “lock-in” phenomenon can occur at these areas. Therefore, the areas close to location #4 significantly vibrate at the second-order natural frequency, and the areas close to location #9 significantly vibrate at the first-order natural frequency in the CF direction.
Fig. 6Strain responses at locations #9 with pretension of 25 N under the middle flow
a) Are the strain–time history curves in the IL and CF directions
b) Are the corresponding FFT spectra in the IL and CF directions
c) Is the time-frequency analysis in the CF direction
d) Is the time-frequency analysis in the IL direction
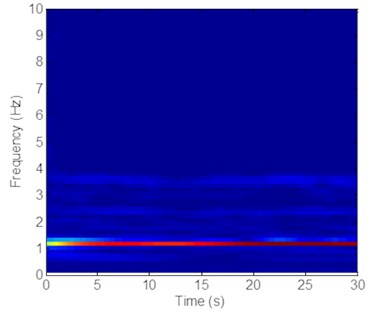
Fig. 5(c) and (b) also depict that location #4 vibrates at the second-order natural frequency (1.18 Hz) and that location #9 vibrates at the first-order natural frequency (0.63 Hz) with time variations in the CF direction. However, 0.63 Hz also contributes to the vibration at location #4, and 1.18 Hz contributes to the vibration at location #9. By contrast, the vortex shedding frequency at other locations is far from the riser natural frequency. The lock-in phenomenon may not occur at these locations. However, the riser at other locations also exhibits these two dominant frequencies (0.63 and 1.18 Hz). The phenomenon may be attributed to the vibrations from the “lock in” areas (areas close to locations #4 and #9) that generate separate effects on the area of the riser and transfer to the entire riser. As a result, the other areas of the riser may vibrate at their dominant frequencies. Consequently, two dominate frequencies are observed from the entire riser in the CF direction.
Figs. 5(c) and 7(c) indicate that unlike at location #9, the vibration induced by the second-order natural frequency (1.18 Hz) is significantly higher than that induced by the first-order natural frequency (0.63 Hz) at locations #4 and #15. However, the vibration induced by the first-order natural frequency (0.63 Hz) is greater than that induced by the second-order natural frequency at location #9, as shown in Fig. 6(c). These findings can be attributed to the modal competition between the first-order modal and second-order modal.
Fig. 7Strain responses at locations #15 with pretension of 25 N under the middle flow
a) Are the strain–time history curves in the IL and CF directions
b) Are the corresponding FFT spectra in the IL and CF directions
c) Is the time-frequency analysis in the CF direction
d) Is the time-frequency analysis in the IL direction
As mentioned previously, lock in occurs at locations #4 and #9 with different vibration modals, and the first and second-order modals contribute to the riser’s vibration. These two modals may interact with each other and exhibit the effect of modal competition [30, 36]. Modal competition occurs when different models participate in the vibration. As the lift force increase with the increasing flow velocity [7], the second order may exert an increased effect on the total riser vibration after modal competition. Thus, the second-order modal is the dominant vibration modal in the modal competition. The first-order modal contributes to the vibration at other locations but only as the interaction frequency for locations #4 and #15. The influence of the first-order modal on locations #4 and #15 is limited. However, the lock-in phenomenon occurs in the first-order modal at location #9. The second-order modal is the dominant modal of the entire riser, but it remains as the interaction modal for location #9. Accordingly, the second-order modal potentially exerts a significant effect at location #9, but the effect is not less significant than the first-order modal at location #9. From the above analysis, we can conclude that the dominant vibration frequency of the entire riser is consistent, and determined by high order natural frequency and the corresponding closing vortex shedding frequencies under the middle flow. Other lower vibration modal may have influence on riser vibration as the interaction modal under the middle flow. In conclusion, the analysis above indicates that the variation of the shedding frequencies under middle flow may approach the natural frequencies of varying orders at the different areas of the riser. Moreover, the “lock-in” phenomenon occurs at the different areas of the riser with the corresponding natural frequency. Accordingly, riser may vibrate at different order natural frequencies along the water depth in the CF direction appearing as the multi-frequencies.
3.2. Analysis of the dominant vibration frequency in the IL direction and associated wake mode
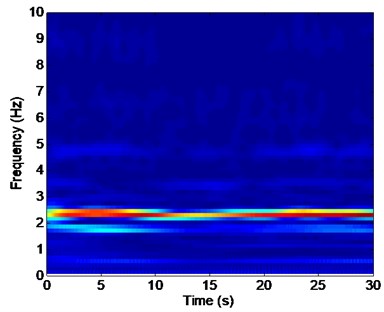
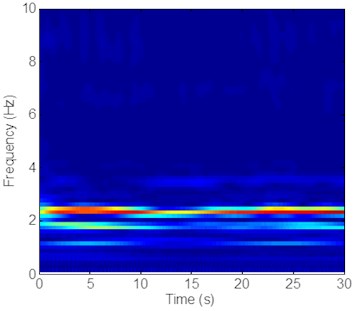
The dominant frequencies in the IL direction are 1.82 and 2.35 Hz with a pretension of 25 N, as shown in Figs. 5(b), (d), 6(b), (d), and 7(b), (d). The frequency of 1.82 Hz is almost triple the dominant frequencies in the CF direction (0.63 Hz). The frequency of 2.35 Hz is almost twice that of another dominant frequency in the CF direction (1.18 Hz). The phenomenon occurs because of the associated wake modes [10]. First, the riser vibrates because of the vortex-induced force. The dominant frequencies of the riser in both the CF and IL directions are determined by the frequencies of the lift force in the CF direction and the drag force in the IL direction acting on the riser. The frequencies of the lift force in the CF direction are determined by the vortex shedding frequency and natural frequency, as discussed above. The vibration frequency in the IL direction is mainly determined by the wake mode. Several studies [7, 10, 32] reported that the vortex acts on the riser in the CF direction once, whereas it acts on the riser in the IL direction twice for the effect of the “2S” wake mode. Thus, the dominant frequency in the IL direction is twice that in the CF direction under the “2S” wake mode. The experimental flow velocity at location #4 is 0.156 m/s. Thus, the calculated corresponding Reynolds number is 3,900. Give this value, the “2S” wake mode may appear, as reported in many studies. According to previous studies [7, 10, 32], the twice relationship between the CF (1.18 Hz) and IL directions (2.35 Hz) in our experimental work is induced by the appearance of the “2S” wake mode.
However, the triple relationship between the CF (0.63 Hz) and IL directions (1.82 Hz) is also concurrently achieved. The appearance of the triple relationship between the CF and IL directions may be attributed to the formation of multivortex patterns in the wake [41]. The experimental flow velocity at location #9 is 0.077 m/s. Thus, the calculated Reynolds number is 1,925. The mass ratio of the experimental riser is 1.2, as shown in Table 1. According to previous studies [10, 41], the third harmonics in the IL direction may appear at a low Reynolds number (e.g., 2,000) and low mass ratio (< 3.5). Under this condition, the motions in the IL direction may be phased with the motions in the CF direction, and the shed vortices can break into small vortices and the vortex triplets generated in the wake [41]. The value of the drag force frequency is triple that of the lift force frequency, and the dominant frequency in the IL direction is triple that in the CF direction for the effect of the vortex triplets. Thus, the triple relationship between the CF and IL directions emerges. However, the relationship between the CF (0.63 Hz) and IL directions (1.82 Hz) is not a complete triple relationship. A slight difference exists between these variables. This phenomenon occurs because the vortex shedding in the IL direction may lag behind that in the CF direction for the formation of the vortex triplets in the wake during vortex shedding [41, 42]. Therefore, the vibration frequency in the IL direction at location #9 is almost triple that in the CF direction, but the relationship is not completely triple. The analysis above indicates that the vibration at location #9 also affects the entire riser, which leads to the triple relationship between the CF and IL directions of the entire riser.
Both the twice and triple relationships between the CF and IL directions are observed for the different wake modes induced by the variation of the flow velocity under middle flow. Thus, the variation vortex shedding frequencies along the riser under middle flow may generate different wake modes and vibration modals as the corresponding vortex shedding frequencies approach the riser natural frequencies. These different vibration modals involve riser vibration and influence the riser vibration frequency. The vibration frequencies produced in our experiment are not sufficiently large because of the limited experimental facility. Nevertheless, our experimental results suggest the participation of different vibration modals in VIV under a high middle-flow speed. Thus, VIV under middle flow appears in multiple frequencies.
Fig. 8Strain responses at locations #4 with pretension of 35 N under the middle flow
a) Are the strain-time history curves in the IL and CF directions
b) Are the corresponding FFT spectra in the IL and CF directions
c) Is the time-frequency analysis in the CF direction
d) Is the time-frequency analysis in the IL direction
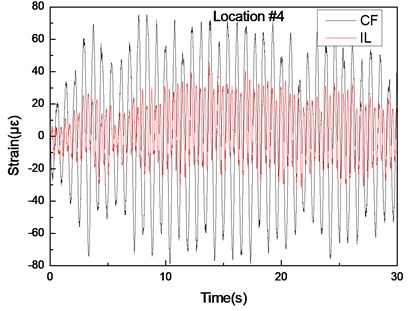
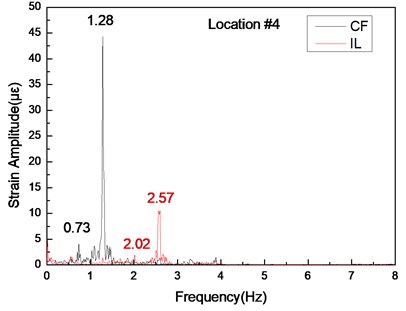
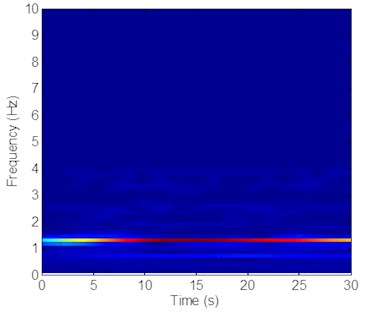
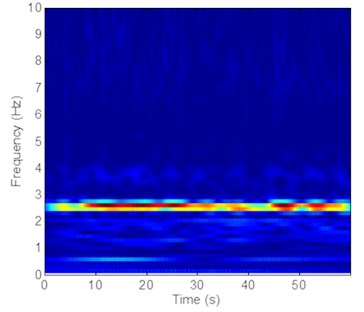
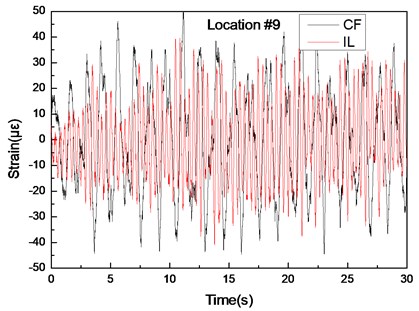
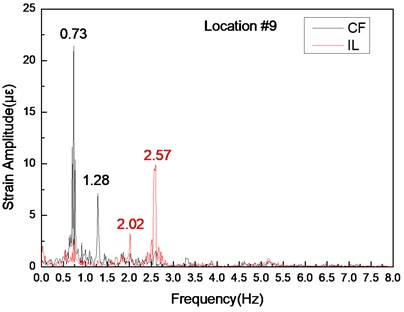
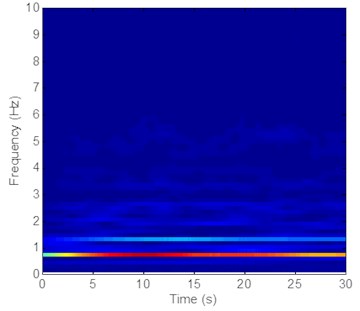
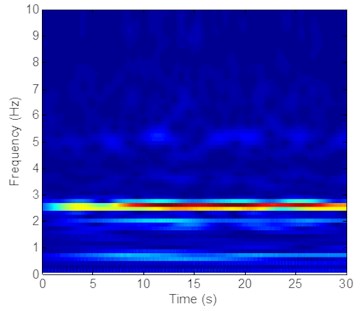
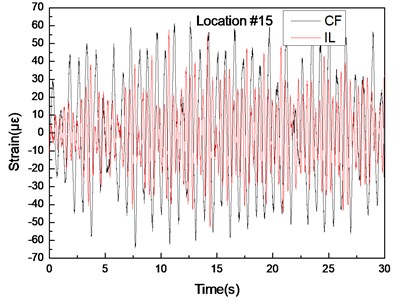
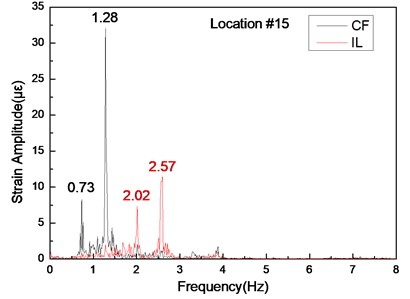
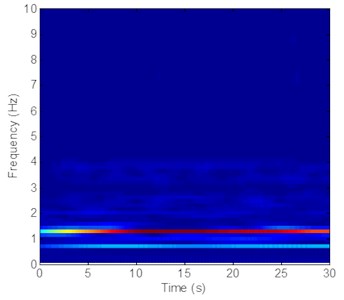
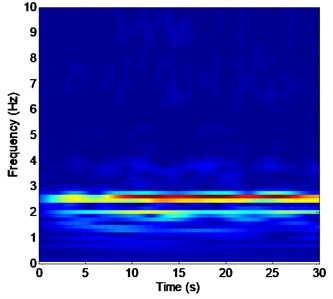
The same phenomenon occurs in variation frequencies with a pretension of 35 N, as shown in Fig. 8-10. The dominant frequencies in the CF direction are 0.73 and 1.28 Hz, and the dominant frequencies in the IL direction are 2.02 and 2.57 Hz with a pretension of 35 N, as shown in Fig. 8-10. However, unlike the dominant vibration of the two pretensions, these changing frequencies also indicate that the VIV frequencies under middle flow increase with riser pretension. These results agree with those under uniform flow [7, 10]. They can be explained by the fact that the lock-in phenomenon under middle flow also occurs near the natural frequency and that the natural frequency increases with pretension. Increasing pretension can increase dominant frequency under middle flow.
Some small amplitude frequencies that are greater than the third-order natural frequency also appear in the FFT spectra, as indicated in Figs. 5(b)-7(b) and 8(b)-10(b). However, these frequencies are not evident in the wavelet results shown in Figs. 5-7 and 8-10. Furthermore, these frequencies with a pretension of 25 N are more significant than those with a pretension of 35 N, as shown in Figs. 5(b)-7(b) and 8(b)-10(b). These frequencies may be attributed to the influence of the turbulent flow in the experiment. Turbulence is easily generated when flow velocity varies with water depth [36]. Some turbulences can cause high harmonics in experiments. However, the vibration amplitude decreases with increasing pretension [7]. Thus, these frequencies with a pretension of 25 N are more significant than those with a pretension of 35 N.
Fig. 9Strain responses at locations #9 with pretension of 35 N under the middle flow
a) Are the strain–time history curves in the IL and CF directions
b) Are the corresponding FFT spectra in the IL and CF directions
c) Is the time-frequency analysis in the CF direction
d) Is the time-frequency analysis in the IL direction
3.3. Analysis of the strain-time history curves and interaction between the CF and IL directions
Figs. 5(a)-7(a) and 8(a)-10(a) show that the strain-time history curves at location #4 is smoother than those at locations #9 and #15 with pretensions of 25 and 35 N. This result is achieved because multiple frequencies appear in the CF and IL directions. The analysis in 3.1 indicates that the lock-in phenomenon occurs at the second-order natural frequency at location #4, whereas the lock-in phenomenon occurs at the first-order natural frequency at location #9. The second-order modal is the dominant vibration modal, whereas the first-order modal induces the vibration of the riser after modal competition. Therefore, the effect from the first- and second-order natural frequencies at locations #9 and #15 is significant, and the effect from the first-order natural frequencies at location #4 is limited. Thus, the multiple frequencies at location #4 are not as evident as those at locations #9 and #15, as depicted in Figs. 5-10. Thus, the strain-time history curves at location #4 is smoother than those at locations #9 and #15, as shown in Figs. 5(a)-7(a) and 8(a)-10(a).
The vibration frequencies in the CF and IL directions appear at each other’s FFT spectra. The wavelet results also indicate that the vibration frequencies between the CF and IL directions may interact with each other, as shown in Figs. 5-7 and 8-10. The phenomenon is also reported by many studies [32, 35, 42]. This phenomenon occurs because the vibration between the CF and IL directions can induce the periodical variation of the riser tension and the vibration of the CF and IL directions can interact with each other by periodically varying the riser tension [35]. Thus, the vibration frequencies in the CF and IL directions appear at each other’s FFT spectra and the corresponding wavelet results.
Fig. 10Strain responses at locations #15 with pretension of 35 N under the middle flow
a) Are the strain-time history curves in the IL and CF directions
b) Are the corresponding FFT spectra in the IL and CF directions
c) Is the time-frequency analysis in the CF direction
d) Is the time-frequency analysis in the IL direction
3.4. Analysis of the standard deviation of displacement
The dominant vibration modal of a riser during VIV can be obtained by the standard deviation of displacement. The standard deviation of displacement can be calculated as follows [43]:
where zm is the location, Tt is the length of time during the experiment in s, y(zm,t) is the displacement of the riser at location zm in m, and ¯y(zm,t) is the average displacement of the riser at location zm in m.
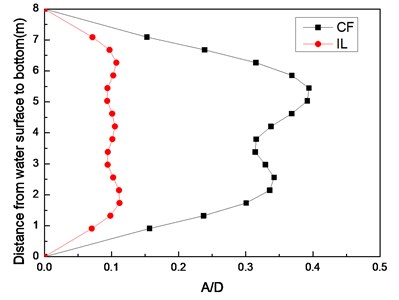
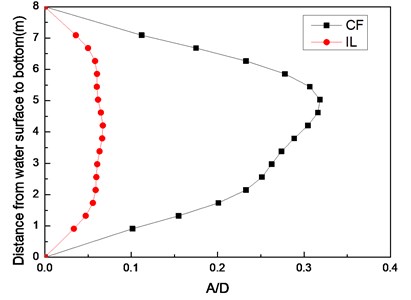
The dominant vibration modal of the riser can be determined on the basis of the crest number of the standard deviation of displacement. Fig. 11 shows the standard deviation of displacement along the riser model with pretensions of 25 and 35 N under middle flow. Two crests are observed in the CF direction, as shown in Fig. 11(a) and (b); these crests indicate that the vibration modal in the CF direction is dominated by the two-order modals with the aforementioned pretensions. These results are consistent with the dominant vibration frequencies in the CF direction, as presented in Figs. 5-7 and 8-10. The lock-in phenomenon occurs at the second-order natural frequency at location #4, and such phenomenon leads to the domination of the second-order natural frequency in the entire riser, as depicted in Figs. 5-7 and 8-10. Thus, the second-order modal is the dominant modal in the CF direction with pretensions of 25 and 35 N under middle flow.
Moreover, the standard deviation of displacement along the riser is not the standard sine curve. The phenomenon is mainly attributed to the varying vortex shedding frequencies along the riser under middle flow. The vortex shedding frequency lies between 0 and 1.224 Hz in the experimental middle flow. Under this range, the vortex shedding frequency is close to the first-order natural frequency. Thus, an area of the riser may vibrate at the first-order modal, as indicated in Figs. 5-7 and 8-10, and this vibration can be an interaction vibration modal involved in the vibration of the entire riser. We observe that the standard deviation of displacement along the riser is not the standard sine curve resulting from the superimposed first- and second-order modal vibrations. The vibration modal under middle flow appears multi-modals.
Fig. 11Standard deviation of displacement along riser model with the pretension of 25 N, 35 N under the middle flow
a) Pretension of 25 N
b) Pretension of 35 N
Furthermore, three crests are detected in the IL direction, as shown in Figs. 11(a) and (b); these crests indicate that the vibration modal in the IL direction is dominated by a third-order modal with pretensions of 25 and 35 N, as shown in Fig. 11. This modal is also higher than the vibration modal in the CF direction. The dominant frequencies with pretensions of 25 and 35 N are 2.35 and 2.57 Hz, respectively. Both frequencies are extremely close to the third-order natural frequency, as indicated in Table 2. Thus, the lock-in phenomenon also occurs in the IL direction, and the vibration modal in the IL direction is dominated by the third-order modal. As mentioned previously, the same mechanism occurs in the vibration in the CF direction. Under the wake mode, double and triple relationships are noted in the vortex shedding frequencies between the IL and CF directions. As a result, the vortex shedding frequency can approach the high modal of the riser natural frequency, and the lock-in phenomenon can occur at a high modal in the IL direction. Thus, the vibration modal in the IL direction is higher than that in the CF direction.
The vibration amplitude in the CF direction is substantially larger than the vibration amplitude in the IL direction, and amplitude decreases with increasing pretension. The phenomenon is consistent with the findings of many studies under uniform flow [7, 10]. In conclusion, the VIV mechanism under middle flow possesses some aspects that are similar to those under uniform flow and exhibits several unique features.
3.5. Analysis of the motion trajectories
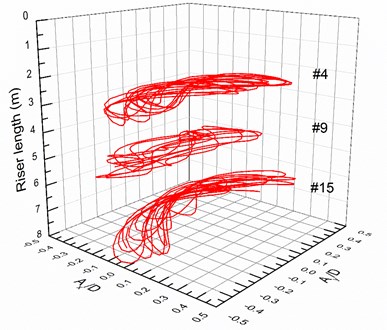
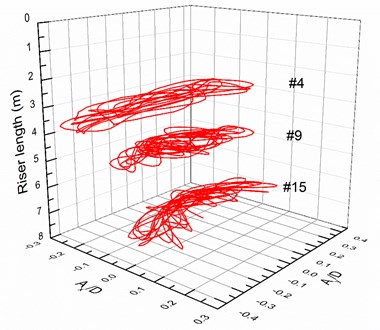
Fig. 12 depicts the motion trajectories at locations #4, #9 and #15 with pretensions of 25 and 35 N under middle flow. The dominant vibration frequency of the entire riser in the CF direction is the second-order natural frequency, and a twice relationship exists between the IL and CF directions. Thus, the distribution of the basic motion trajectories is symmetrical along the y-axis. Meanwhile, the motion trajectories can be also influenced by the phase angle between the IL and CF displacements [44]. The phase angle can be derived as follows [44]:
where Ax is the vibration amplitude in the CF direction, Ay represents the vibration amplitude in the IL direction, ω is the dominant vibration frequency, and θ is the phase angle.
Fig. 12Motion trajectories at locations #4, #9 and #15 with the pretension of 25 N, 35 N under the middle flow
a) Pretension of 25 N
b) Pretension of 35 N
The calculated phase angle in our experiment is 55°. According to the motion trajectory map depicted in the previous study [44], the motion trajectories exhibit crescent shapes in our experiment, as shown in Fig. 12. However, these crescent shapes are not repeatable and thus differ from the results under uniform flow. The motion trajectories at locations #9 and #15 are typically erratic, particularly at location #9. The phenomenon occurs because multiple frequencies appear in both the CF and IL directions and these multiple frequencies can affect the motion trajectories of the riser. Multiple frequencies are considerably significant at locations #9 and 15, as presented in Fig. 5-7 and 8-10. Thus, the motion trajectories are not repeatable, and the motion trajectories at locations #9 and #15 are typically erratic.
4. Conclusions
1) Riser vibrates at different order natural frequencies along the water depth in the CF and IL directions appearing as the multi-frequencies under middle flow.
2) The variation vortex shedding frequencies along the riser under middle flow may generate different wake modes and vibration modals as the corresponding vortex shedding frequencies approach the riser natural frequencies.
3) The dominant vibration frequency of the entire riser is consistent, and determined by high order natural frequency and the corresponding closing vortex shedding frequencies under the middle flow. Meanwhile, the vibration modal under middle flow appears multi-modals and other lower modal have effect on riser vibration.
4) The VIV mechanism under middle flow possesses some aspects similar to those of uniform flow and several unique features such as the vibration modal in the IL direction is higher than that in the CF direction; Increasing pretension can increase dominate frequency and decrease the vibration amplitude; The vibration amplitude in the CF direction is much larger than the vibration amplitude in the IL direction, etc.
References
-
Feng C. C. The Measurements of Vortex-Induced Effects in Flow Past Stationary and Oscillating Circular and D-Section Cylinders. Master’s Thesis, University of British Columbia, UK, 1968.
-
Vandiver J. K. Dimensionless parameters important to the prediction of vortex-induced vibration of long, flexible cylinders in ocean currents. Journal of Fluids and Structures, Vol. 5, Issue 7, 1993, p. 423-455.
-
Vandiver J. K. Predicting lock-in on drilling risers in sheared flows. Proceedings of the Flow-Induced Vibration Conference, Lucerne, Switzerland, 2000.
-
Kaasen K. E., Halvor L., Solaas F., Vandiver J. K. Norwegian Deepwater program: analysis of vortex-induced vibrations of marine risers based on full-scale measurements. Offshore Technology Conference, Houston, Texas, USA, 2000.
-
Sarpkaya T. On the force decompositions of Lighthill and Morrison. Journal of Fluids and Structures, Vol. 2, Issue 15, 2001, p. 227-233.
-
Sarpkaya T. Vorticity, free surface, and surfactants. Annual Review of Fluid Mechanics, Vol. 28, Issue 28, 2003, p. 83-128.
-
Sarpkaya T. A critical review of the intrinsic Nature of vortex-induced vibrations. Journal of Fluids and Structures, Vol. 4, Issue 19, 2004, p. 389-447.
-
Jauvtis N., Williamson C. H. K. Vortex-induced vibration of a cylinder with two degrees of freedom. Journal of Fluids and Structures, Vol. 7, Issue 17, 2003, p. 1035-1042.
-
Williamson C. H. K., Jauvtis N. A high-amplitude 2T mode of vortex-induced vibration for a light body in X Y motion. European Journal of Mechanics B-fluids, Vol. 1, Issue 23, 2004, p. 107-114.
-
Williamson C. H. K., Govardhan R. N. A brief review of recent results in vortex-induced vibrations. Journal of Wind Engineering and Industrial Aerodynamics, Vol. 6, Issue 96, 2008, p. 713-735.
-
More T. L., Williamson C. H. K. Prediction of vortex-induced vibration response by employing controlled motion. Journal of Fluid Mechanics, Vol. 634, Issue 634, 2009, p. 5-39.
-
Chucheepsakul S., Srinil N. Free vibrations of three-dimensional extensible marine cables with specified top tension via a variational method. Ocean Engineering, Vol. 9, Issue 29, 2002, p. 1067-1096.
-
Chucheepsakul S., Monprapussorn T., Huang T. Large strain formulations of extensible flexible Marine pipes transporting fluid. Journal of Fluids and Structures, Vol. 2, Issue 17, 2003, p. 185-224.
-
Kaewunruen S., Chiravatchradj J., Chucheepsakul S. Nonlinear free vibration of marine risers/pipes transporting fluid. Ocean Engineering, Vol. 3, Issue 32, 2005, p. 417-440.
-
Guo H., Lou M., Dong X. Numerical and physical investigation the vortex-induced vibration of marine riser. China Ocean Engineering, Vol. 3, Issue 20, 2006, p. 373-382.
-
Guo H., Lou M., Dong X. Experimental study on vortex-induced vibration of risers transporting fluid. International Offshore and Polar Engineering Conference, San Francisco, California, USA, 2006.
-
Guo H. Y., Lou M. Effect of internal flow on vortex-induced vibration of risers. Journal of Fluids and Structures, Vol. 4, Issue 24, 2008, p. 496-504.
-
Larsen C. M., Passano E. Time and frequency domain analysis of catenary risers subjected to vortex induced vibrations. 25th International Conference on Offshore Mechanics and Arctic Engineering, 2006, p. 121-129.
-
Aronsen K. H., Larsen C. M. Hydrodynamic coefficients for in-line vortex induced vibrations. 26th International Conference on Offshore Mechanics and Arctic Engineering, 2007, p. 949-956.
-
Abdelkefi A., Hajj M. R., Nayfeh A. H. Phenomena and modeling of piezoelectric energy harvesting from freely oscillating cylinders. Nonlinear Dynamics, Vol. 2, Issue 70, 2012, p. 1377-1388.
-
Mehmood A., Nayfeh Ali. H., Hajj Muhammed R. Effects of a non-linear energy sink (NES) on vortex-induced vibrations of a circular cylinder. Nonlinear Dynamics, Vol. 3, Issue 77, 2014, p. 667-680.
-
Dai H. L., Abdelkefi A., Wang L. Piezoelectric energy harvesting from concurrent vortex-induced vibrations and base excitations. Nonlinear Dynamics, Vol. 3, Issue 77, 2014, p. 967-981.
-
Dai H. L., Abdelkefi A., Wang L., Liu W. B. Time-delay feedback controller for amplitude reduction in vortex-induced vibrations. Nonlinear Dynamics, Vol. 1, Issues 2-80, 2015, p. 59-70.
-
Newman D. J., Karniadakis G. E. A direct numerical simulation study of flow past a freely vibrating cable. Journal of Fluid Mechanics, Vol. 344, Issue 344, 1997, p. 95-136.
-
Furnes G. K. On marine riser responses in time-and depth-dependent flows. Journal of Fluids and Structures, Vol. 2, Issue 14, 2000, p. 257-273.
-
Lucor D., Imas L., Karniadakis G. E. Vortex dislocations and force distribution of long flexible cylinders subjected to sheared flows. Journal of Fluids and Structures, Vols. 3-4, Issue 15, 2001, p. 641-650.
-
Tognarelli M., Slocum S., Frank W., Campbell R. VIV Response of a long flexible cylinder in uniform and linearly sheared currents. Offshore Technology Conference, Houston, Texas, USA, 2004.
-
Chaplin J. R., Bearman P. W., Huarte F. J. H., Pattenden R. J. Laboratory measurements of vortex-induced vibrations of a vertical tension riser in a stepped current. Journal of Fluids and Structures, Vol. 1, Issue 21, 2005, p. 3-24.
-
Marcollo H., Hinwood J. B. On shear flow single mode lock-in with both cross-flow and in-line lock-in mechanisms. Journal of Fluids and Structures, Vol. 2, Issue 22, 2006, p. 197-211.
-
Lie H., Kaasen K. E. Modal analysis of measurements from a large-scale VIV model test of a riser in linearly sheared flow. Journal of Fluids and Structures, Vol. 4, Issue 22, 2006, p. 557-575.
-
Srinil N. Analysis and prediction of vortex-induced vibrations of variable-tension vertical risers in linearly sheared currents. Applied ocean Research, Vol. 1, Issue 33, 2011, p. 41-53.
-
Huang K., Chen H. C., Chen C. R. Vertical riser VIV simulation in sheared current. International Journal of Offshore and Polar Engineering, Vol. 2, Issue 22, 2012, p. 142-149.
-
Zhao M., Kaja K., Xiang Y., Yan G. Vortex-induced vibration (VIV) of a circular cylinder in combined steady and oscillatory flow. Ocean Engineering, Vol. 73, 2013, p. 83-95.
-
Mao L., Liu Q., Zhou S. Experimental study of the vortex-induced vibration of drilling risers under the shear flow with the same shear parameter at the different Reynolds numbers. PLos One, Vol. 8, Issue 9, 2014, p. e104806.
-
Liu Qingyou, Mao Liangjie, Zhou Shouwei Experimental study of the effect of drilling pipe on vortex-induced vibration of drilling risers. Journal of Vibroengineering, Vol. 4, Issue 16, 2014, p. 1842-1853.
-
Mao Liangjie, Liu Qingyou, Zhou Shouwei, Jiangwei, Liu Zhengli, Peng Tao Vortex-induced vibration mechanism of drilling riser under shear flow. Petroleum Exploration and Development, Vol. 1, Issue 42, 2015, p. 101-106.
-
Wang J., Fu S., Baarholm R., Wu J., Larsen C. M. Fatigue damage induced by vortex-induced vibrations in oscillatory flow. Marine Structures, Vol. 40, 2015, p. 73-91.
-
Zhu Y. R. Ocean Engineering Wave Mechanics. Tianjin University Press, 1991.
-
Hu J., Kawamura H., Hong H., Qi Y. A review on the currents in the South China Sea: seasonal circulation, South China Sea warm current and Kuroshio intrusion. Journal of Oceanography, Vol. 56, 2000, p. 607-624.
-
Chen W. L., Zhang Q. Q., Li H., Hu H. An experimental investigation on vortex induced vibration of a flexible inclined cable under a shear flow. Journal of Fluids and Structures, Vol. 54, 2015, p. 297-311.
-
Dahl J. M., Hover F. S., Triantafyllou M. S., Dong S., Karniadakis G. E. Resonant vibrations of bluff bodies cause multivortex shedding and high frequency forces. Physical Review Letters, 99, p. 2007-144503.
-
Song J., Lu L., Teng B., Park H., Tang G., Wu H. Laboratory tests of vortex-induced vibrations of a long flexible riser pipe subjected to uniform flow. Ocean Engineering, Vol. 11, Issue 38, 2011, p. 1308-1322.
-
Stoer J., Bulirsch R. Introduction to Numerical Analysis. Springer Science and Business Media, 2013.
-
Jauvtis N., Williamson C. H. K. The effect of two degrees of freedom on vortex-induced vibration at low mass and damping. Journal of Fluid Mechanics, Vol. 509, Issue 509, 2004, p. 23-62.
Cited by
About this article
The authors gratefully acknowledge the financial support of the National Natural Science Foundation of China (No. 51604235), Scientific Research Starting Project of SWPU (No. 2015QHZ007), Key Laboratory of Gas Hydrate, Guangzhou Institute of Energy Conversion, Chinese Academy of Sciences (No. Y707kd1001), Open Fund of State Key Laboratory of Oil and Gas Reservoir Geology and Exploitation (Southwest Petroleum University) (No. PLN 201623).
