Abstract
Aqueduct is the key structure in water conveyance engineering, which may be damaged during earthquake. Although numerous water conveyance designs have been built, the current state of researches on aqueduct aseismic design is inadequate. In this paper, based on the fluid-structure interaction dynamics and response spectra analysis, a simplified analysis method was proposed to evaluate the transverse seismic response of aqueducts, and the simplified calculating results were compared with the results of the nonlinear finite element calculation of fluid-structure interaction and experimental results. The results showed that the simplified analysis method put forward in this paper could be used to evaluate the transverse seismic response of aqueducts. In the condition that the pier height is less than 40 m, the first-order lateral vibration mode of the aqueduct has a higher model contribution rate; the simplified calculation method can achieve extremely high accuracy. The simplified calculation precision decreases as the height increases when the pier height exceeds 40 m.
1. Introduction
Freshwater resources on the Earth are very unevenly distributed [1, 2]. To satisfy people's need in terms of production, living, and social development, a number of water conveyance channels has been built [3, 4]. To deal with the non-uniform distribution between southern and northern, eastern and western parts of China, the south-to-north water conveyance project, water conveyance project from the Yellow River to Qingdao, water conveyance project from the Yellow River to Shanxi and Qianzhong hydro-junction project and so on have been built or are being built. Aqueducts, as important hydraulic structures for water transfer, have been widely used in many countries. As compared to open channels, inverted siphons, and delivery culverts, aqueducts have larger spans and higher structures, which are vulnerable when an earthquake happened. One part is damaged in a long-distance water conveyance project, affects the normal function of the whole water conveyance system and even interrupts the water conveyance process [5-7]. Most of aqueducts are located in high-earthquake-intensity areas both in China and in other countries. For instance, aqueducts were damaged during the Lushan Earthquake and Wenchuan Earthquake, blocking access to potable water [8]. Therefore, the improvement of aqueducts aseismic design level is vital for the safe operation of water conveyance projects.
At present, there are many researches on seismic design of bridges. Seismic absorption, isolation design theory and protection ability are developed instead of a simple earthquake resistance method. The research results can be referred to the aqueduct design. However, due to the difference between structural features, seismic response characteristics and performance requirements of aqueducts and those of road or railway bridges, earthquake-resistance design theories and methods of bridge engineering are not absolutely applicable to the aqueduct seismic design. It is the emphasis and difficulty of the seismic aqueduct design to define the coupled vibration of water and aqueduct structure under earthquake. Many researches on this problem are based on the dynamic analysis of storage vessels in the process of an earthquake.
Housner developed the hydrodynamic pressures when a fluid container was subjected to horizontal accelerations, and the spring-quality simplified model, namely the Housner model, was proposed where the vessel wall was rigid [9]. On this basis, Haroun developed the Haroun-Housner model, which took into account the rigidity of the container wall [10]. And theoretical and experimental investigations of the dynamic behaviour of ground-supported, deformable, cylindrical liquid storage tanks were conducted. In addition, the finite element method [11], numerical simulation [12], and Arbitrary Lagrange-Euler (ALE) finite element method [13-15] were used in the dynamic response research of storage vessel fluid-structure interaction.
Taking the seismic analysis method of storage vessel fluid-structure interaction as a reference, a seismic aqueduct analysis was conducted. Based on the potential flow theories, Zhang et al. analysed the dynamic features of water in aqueducts and derived a simplified model similar to the Housner model [16]. This model effectively took into account the Tuned Liquid Damper (TLD) vibration absorption effect of sloshing fluid in the aqueduct under seismic action. Then, Liu et al. verified the applicability of the Housner model in a calculation involving the aqueduct earthquake resistance [17]. It turns out that the computational precision is high when the shell and pier are of high rigidity. Li et al. further developed the Housner model applicable to a rectangular cross-section and derived simplified models applicable to semi-circular, U-shaped, and ladder-type cross-sections [18]. In addition, more research methods, such as the boundary element method, ordinary differential equation (ODE) solver [19] and response-spectrum principle [20] were also applied in early researches, and some achievements were gained. However, there is still no accepted method and standardization to calculate aqueduct structures seismic responses.
In recent years, with the further development of numerical simulation technology and fluid calculating theories, the nonlinear finite element method has been used in the analysis of the dynamic response of aqueducts. The ALE method is able to effectively simulate the interaction between fluid and structure and to simulate the wave height and vibration mode with complicated modelling calculations [21, 22]. Wu studied the dynamic characteristics of a three-dimensional high frame supported a U-shaped aqueduct, and found that external actions induced large water sloshing effects would greatly change the distribution and the value of hydrodynamic pressures and stresses in the aqueduct [23].
Currently, the nonlinear time-history analysis using the ALE method or specific programs using the Housner model are applied to evaluate the performance of aqueducts in terms of earthquake resistance. These two methods have very complicated calculations and take too much time and energy. Therefore, they are not suitable for the direct application and promotion for a seismic aqueduct design. In this paper, based on the fluid-structure interaction dynamic features of aqueduct under a transverse earthquake and fluid-structure interaction vibration theories [24], in accordance with the relevant codes [25, 26], a simplified method for transverse seismic response is proposed and compared with some numerical solutions and experimental results.
2. Transverse seismic aqueduct response calculation
2.1. Analytical hydrodynamic pressure solution
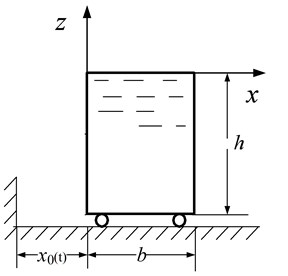
The transverse motion of the aqueduct structure and water, that is, the motion along the horizontal axis of the aqueduct, can be considered as a plane problem and solved approximately. It is assumed that the shell is rigid, water is an ideal liquid, and the water sloshing has small amplitude. There is no constraint on the upper water boundary. As illustrated in Fig. 1, the shell vibrates horizontally along the x-axis, and the displacement at moment t is x0(t), in which the x-axis and z-axis represent the horizontal and vertical directions of the aqueduct respectively, b denotes the internal width of the aqueduct shell, and h is the height of water in the aqueduct.
Fig. 1Illustration of aqueduct shell horizontal motion
The velocity potential of water Φ(x,z,t) is represented by the sum of two velocity potentials:
where φ1 is the rigid-body motion potential generated by the water as the aqueduct vibration, and φ2 is the hydrodynamic pressure caused by unbalanced pressure under the effect of φ1. Both φ1 and φ2 should satisfy the Laplace equation:
And the following boundary conditions and initial conditions:
where g is the acceleration of gravity, and f1 and f2 are variables which can be found as:
The potential function φ1 and φ2 can be expressed as follows:
Based on the variable separation method and cosine series expansions, the potential function φ1 and φ2 can be obtained by using the boundary conditions and initial conditions. And then, the total velocity potential of the water movement can be cleared finally:
where an=4b/n2π2. qn(t) can be seen as the generalized coordinates of the fluid vibration. For liquid with no damping effect:
In which ˜ωn is the inherent vibrational frequency of water in the aqueduct and ˜ω2n=gnπbtanhnπhb.
The velocity potential can be derived by Eq. (11), then the velocity in the direction of the x-axis (u) can be obtained:
And, the hydrodynamic pressure (p) at any point in water contained in the shell is:
where ρ denotes the density of water. Integrating Eq. (14) along two side surfaces of the aqueduct and adding up the results, we obtain the analytical solution to the total hydrodynamic pressure exerted on the unit length of the aqueduct:
2.2. Hydrodynamic pressure using response spectra
By using Eq. (15), the hydrodynamic pressure can be obtained, but it is too complicated. So, a further simplification of the equation is necessary. Eq. (15) can be rewritten as follows:
where Mw is the total mass of water contained in the aqueduct with the length l, Mw=ρbhl, cn=8π2n2, and dn=bnhπtanh(nhπb), n= 1, 3, 5, …, ∞.
The hydrodynamic pressure exerted on the side shell of the aqueduct is similar to the seismic response of elastic structures in terms of pattern. dn is equivalent to the vibration mode participation efficiency of the seismic response of elastic structure, while cn is equivalent to the mass participation efficiency of the vibration mode. They all have the same meaning as they do in a normal elastic structure. Because of the similarity, it is reasonable to use the response spectrum theory to calculate the hydrodynamic pressure. Therefore Eq. (16) can be written as follows:
where: n=1,3,5,…,∞.
The right side of Eq. (17) consists of two items. The first one represents the pulsating pressure, which is in proportion to the ground acceleration ¨x0(t). Its change is directly proportional to the ground acceleration. The second one represents convection pressure, which is the total hydrodynamic pressure of each vibration mode. Due to the fact that the fundamental mode contributes most to structural dynamic response under seismic excitation, let n= 1. So, the mass of water exerting dynamic water (Ms) can be expressed as:
Namely:
The difference between Ms and Mw is the mass of water exerting pulsating pressure (M'f) as follows:
In addition, each time-function (¨x0+¨qn) in Eq. (17) represents the absolute acceleration response of a single-particle system with the frequency being ˜ωn under the action of ground acceleration ¨x0(t). In accordance with the response spectrum theory, water exerting a pulsating pressure is considered as a part fastened to the aqueduct structure. Let the damping ratios of the aqueduct and pier be 0.05 and then refer to the Code for seismic design of buildings [24], the horizontal seismic influence coefficient αf is simply included into the seismic force calculation, and its value can be got on the seismic influence coefficient curve which is determined by the earthquake intensity, site type, design earthquake classification, and natural structure vibration period. Then, the pulsating water pressure (F'f) can be written as:
where:
Let the damping ratios be 0, the hydrodynamic pressure can be cleared as:
where Ws=gMs, and αs is the horizontal seismic influence coefficient which can be determined by the earthquake intensity, site type, design earthquake classification, and natural water vibration period.
Further, according to the Square Root of the Sum of the Squares (SRSS) rule, the standard value of the seismic force exerted on the aqueduct under horizontal seismic action can be obtained as:
where:
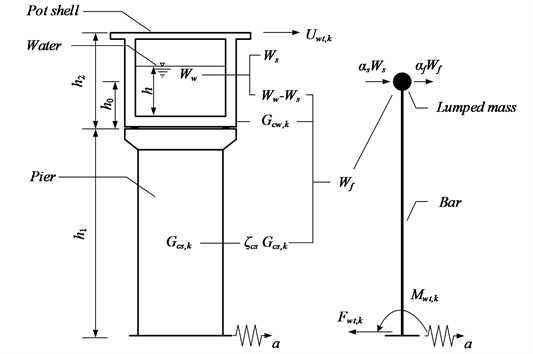
As shown in Fig. 2, Fwt,k is the standard value of the seismic force exerted on the shell gravity centre under horizontal seismic action (kN); Ws is the weight of convecting and vibrating water in the pot shell (kN); Wf is the sum of the equivalent weight bearing shell structure at the gravity center of the aqueduct and the weight of pulsating water in the shell (kN); Ww is the total weight of water in the shell (kN); Gcs,k is the standard weight of aqueduct supporting structure (kN); Gcw,k is the standard weight of shell (kN); and ξcs is the equivalent coefficient of the part of the aqueduct supporting structure acting at the gravity centre of the pot shell. For constant-stiffness supporting structures, ξcs= 0.35. For variable-stiffness supporting structures, 0.25 ≤ ξcs < 0.35. αf is the horizontal seismic influence coefficient of the basic natural vibration period when the aqueduct is empty or full of water; αs is the horizontal seismic influence coefficient of the basic natural vibration period of water in the shell.
Fig. 2Illustration of model with simplified calculation
In addition, based on the equation of the surface gravitational wave shape, the natural vibration period (Tw) of water in a rectangular shell under the condition of resonance vibration can be derived as follows:
2.3. Bending moment at pier bottom and lateral displacement at aqueduct top
According to the simplified calculation model shown in Fig. 2, it is easy to obtain the moment at the pier bottom by the horizontal seismic force derived by Eq. (23):
where Mwt,k is the moment at the pier bottom caused by horizontal seismic action (kN.m); h0 is the height of the shell mass centre from the aqueduct bottom (m); and h1 denotes the pier height (m).
The lateral displacement caused by the shell deformation is far smaller than the lateral pier displacement under horizontal seismic action because of the high shell stiffness, and the height of the shell is generally much smaller than that of the pier. Therefore, the shell may be regarded as approximately rigid. Based on the diagram multiplication method, the displacement of the aqueduct top can be obtained:
where Uwt,k is the lateral displacement of the aqueduct top under a horizontal earthquake (m); h2 is the height of the shell (m); E is the elastic modulus of the aqueduct pier (kPa); and I is the moments of inertia of the traverse section of the pier (m4).
3. Transverse seismic response of typical aqueduct
3.1. General information on structure and dynamic characteristics
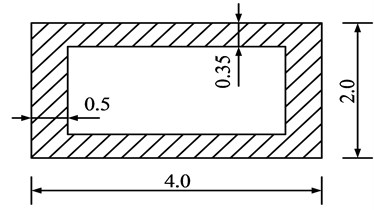
The upper structure of an aqueduct is a pre-stressed simply supported box girder with a span of 50 m, and its section is shown in Fig. 3. The internal width of the box girder walls is 4.25 m. The aqueduct height h2 is 4.5 m. The water depth is 2.4 m, the strength grade of concrete is C30, and elastic modulus is 30 GPa. The pier cross-section is hollow rectangular, as shown in Fig. 4, and the strength grade of concrete is C25, which elastic modulus is 28 GPa. Take the pier height h1= 5, 10, 20, 30, 40, and 50 m respectively, the fluid–structure dynamic characteristics of the aqueduct with different h1 are studied.
Fig. 3Section of pot shell (m)
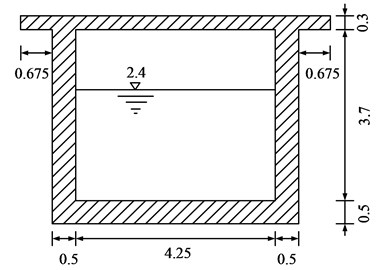
Fig. 4Section of pier (m)
Then, the natural vibration periods of water in the shell and aqueduct structured with different conditions of water depth are obtained by Eq. (24), as listed in Table 1.
Table 1Natural vibration period
h1 (m) | Structural natural vibration period (s) | Water natural vibration period (s) |
5 | 0.2178 | 3.2634 |
10 | 0.4191 | |
20 | 1.0223 | |
30 | 1.7888 | |
40 | 2.7010 | |
50 | 3.7449 |
3.2. Transverse seismic response
It is important to get the seismic influence coefficient of the aqueduct and water as well as their corresponding weights using Eq. (23) to estimate clearly the horizontal seismic response. The seismic influence coefficient of the aqueduct should be relevant to the earthquake intensity, site type, design earthquake classification, natural aqueduct vibration period, and damping ratio [24], which can be obtained according to the Code for Seismic Design of Buildings GB50011-2010. The maximum horizontal seismic influence coefficient is in accordance with Table 2. The characteristic period is decided according to the site type and design earthquake classification (see Table 3 for details). For the case of the seismic influence of infrequent earthquakes, the characteristic period should be increased by 0.05 s.
Table 2Maximum horizontal seismic influence coefficient
Seismic influence | Degree 6 | Degree 7 | Degree 8 | Degree 9 |
Infrequent earthquake | 0.28 | 0.50 | 0.90 | 1.40 |
Table 3Characteristic period
Classification of design earthquake | Site type | ||||
I0 | I1 | II | III | IV | |
Group 2 | 0.25 | 0.30 | 0.40 | 0.55 | 0.75 |
The seismic influence coefficient and adjustment of damping are calculated according to the following equations [24]:
where α is the seismic influence coefficient; αmax is the maximum of the seismic influence coefficient; Tg is the characteristic period; and T is the natural vibration period of the aqueduct. The attenuation exponent γ of the descending part of the curve is assigned as follows:
In which ξ is the damping ratio; the negative slope η1 of the descending part of the line is assigned as follows:
And the damping adjustment coefficient η2 is assigned as follows:
In this paper, the infrequent earthquake of degree 8 is taken as αmax= 0.90 according to Table 2. Further, the site of type III is taken, and the classification of the design earthquake is group 2. So, Tg= 0.60 according to Table 3 [24]. Meanwhile, the damping ratios of the structure and water are taken as 0.05 and 0, respectively. By Eq. (27), the seismic influence coefficient curves of the structure and water can be obtained. The results are shown in Fig. 5.
Then, the horizontal seismic influence coefficients of the structure αf and water αs in the shell are derived by using the natural vibration period of the structure in Table 1 and the seismic influence coefficient curve. According to the geometrical shape and size of the aqueduct, Wf and Ws are cleared by using Eq. (23). Let ζcs= 0.35, and then the standard seismic force Fwt,kexerted on the aqueduct under horizontal seismic action is derived. Substituting Fwt,kinto Eq. (25) and Eq. (26), the moment at pier bottom Mwt,k and the lateral displacement at the aqueduct top Uwt,k are obtained, where the height of the shell centre h0 is 2.163 m. All of the results are listed in Table 4.
Fig. 5Seismic influence coefficient curves of structure and water
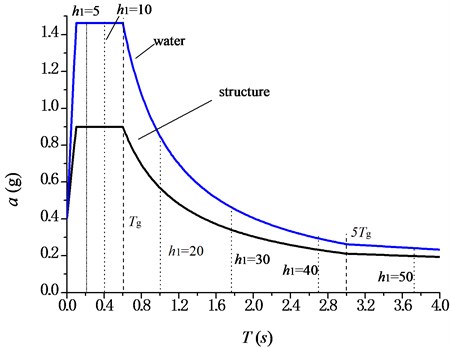
Table 4Seismic responses
h1 (m) | αf | αs | Wf (kN) | Ws (kN) | Fwt,k (kN) | Mwt,k (kN∙m) | Uwt,k (10-3 m) |
5 | 0.9000 | 0.2189 | 13605.9 | 2155.5 | 12254.4 | 87778 | 10.3 |
10 | 0.9000 | 13788.7 | 12418.8 | 151050 | 45.1 | ||
20 | 0.5571 | 14154.4 | 7899.9 | 175087 | 157.0 | ||
30 | 0.3367 | 14520.0 | 4911.9 | 157982 | 285.7 | ||
40 | 0.2324 | 14885.6 | 3491.2 | 147200 | 446.8 | ||
50 | 0.1980 | 15251.3 | 3056.7 | 159448 | 729.8 |
4. Comparison between results
4.1. Comparison with numerical results
To verify the reliability of the formula derived above, a nonlinear time-history analysis of the fluid-structure interaction seismic response has been conducted using the ADINA software to build a finite-element model of the structure shown in Fig. 6, with a 2-D solid element for the aqueduct shell, 2-D fluid element for water, and beam element for the pier. The water upper surface is set as a free surface. The fluid-structure interaction is analysed, where the surface between the pier top and shell are coupled and constrained, and the pier bottom is simplified as the fixed constraint.
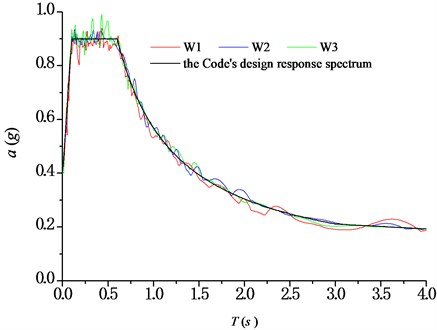
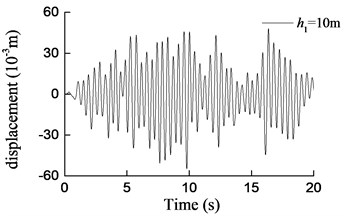
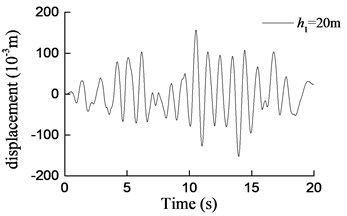
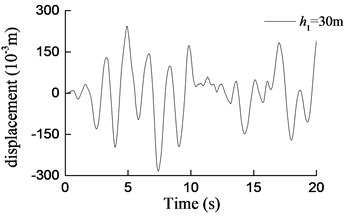
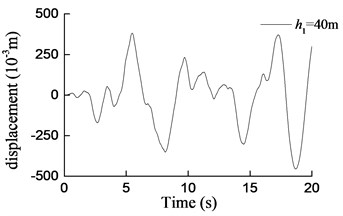
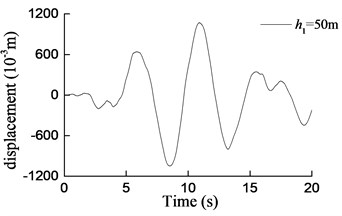
Three artificial seismic waves are generated with the lasting time of 20 s. The site type is the same as that chosen in section 3. The peak acceleration of the seismic design is assumed to be 0.4 g, according to the same seismic information as used in section 3. The acceleration time-history curves of seismic waves are shown in Table 5. The spectral characteristics of each wave are shown in Fig. 7. Then, the seismic response under the three seismic loading are defined. For example, curves of transversal displacement at aqueduct top with different pier heights under earthquake action (W1) are presented in Fig. 8.
Fig. 6Finite-element model
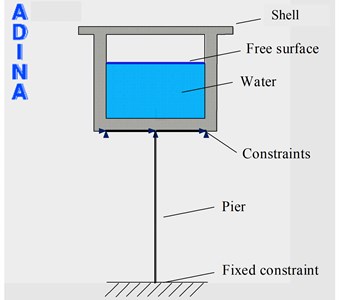
Table 5Time-history curve of seismic waves
Number | Waveform |
W1 |  |
W2 |  |
W3 |  |
Fig. 7Response spectra of seismic waves
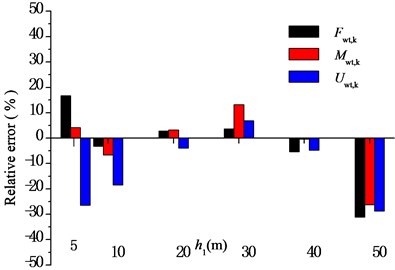
According to the results of the finite-element analysis, the maximum shear forces, maximum moments at the pier bottom, and the maximum displacements at the aqueduct top caused by three seismic waves are averaged respectively, and compared with the results obtained by using Eqs. (23), (25), and (26). The comparisons are shown in Fig. 9 to Fig. 11, respectively. And Fig. 12 shows the analysis of an error between the results of the simplified formula and those of the finite-element simulation analysis, in which the relative error was defined as:
where ˉFmax is the average value of maximum shear forces at the pier bottom caused by three seismic waves. The same method would be used to analyze the moment at the pier bottom and displacements at the aqueduct top caused by three seismic waves. Then the following results can be obtained.
Fig. 8Curves of transversal displacement at aqueduct top with different pier heights under earthquake action (W1)
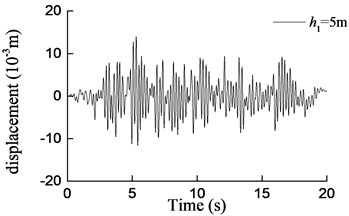
a)h1= 5 m
b)h1= 10 m
c)h1= 20 m
d)h1= 30 m
e)h1= 40 m
f)h1= 50 m
1) Under transverse seismic action, for aqueducts with different pier heights, the shear force, moment at the pier bottom, and the displacement at the aqueduct top obtained by using the simplified formula derived in this paper are in good agreement with those obtained using the finite-element analysis method, either with consistent trends or with similar values. When the pier height varies from 5 m to 40 m, the average difference between results is 6.4 % for the shear force at the pier bottom, 5.5 % for the moment at the pier bottom, and 12.1 % for the displacement at the aqueduct top.
2) As shown in Fig. 9, as the pier height increases, the shear force at the pier bottom increases first and then decreases. The natural vibration period of the structure is close to the predominant period of the site and the shear force at the aqueduct pier bottom is the highest when the pier is 10 m high. And then, as the pier height increases, the natural vibration period of the structure increases and is no longer consistent with the predominant period of the site. The shear force at the pier bottom presents an exponential decrease as the pier height increases furthermore.
3) The moment at the pier bottom changes in a different way from that of the shear force with the pier height increased. As shown in Fig. 10, as the pier height increases, the moment at the pier bottom increases first, then decreases, and then increases again. It is because the moment at the pier bottom is related to both the shear force of the structure and the pier height. When the pier height is smaller, although the shear force exerts on the structure, and is relatively large, the moment at the pier bottom is not necessarily large, because the corresponding moment arm is small. As the pier height increases from 10 m to 40 m, the moment arm of the moment at the pier bottom increases while the shear force at the pier bottom decreases, therefore, the moment at the pier bottom is not changed obviously. When the pier height exceeds 40 m, there is no or little decrease in the shear force as the pier height increases, and therefore the moment at the pier bottom begins to increase as the pier height increases.
4) As shown in Fig. 11, the aqueduct top displacement presents an exponential increase as the pier height increases.
5) When the pier height exceeds 40 m, the shear force and moment at the pier bottom, aqueduct top displacement obtained by using the simplified formula derived in this paper are lower than those obtained by using the finite-element method. This is because the formula is derived on the basis of a model only considering the contribution of the first-order vibration mode of the structure, while the contribution of higher-order vibration modes is neglected. That is to say, the formula can only be applied to a seismic design of aqueducts with piers less than 40 m in height, which is generally consistent with the scope of application of the simplified calculation formula specified in the references [27].
Fig. 9Comparison of shear forces at pier bottom
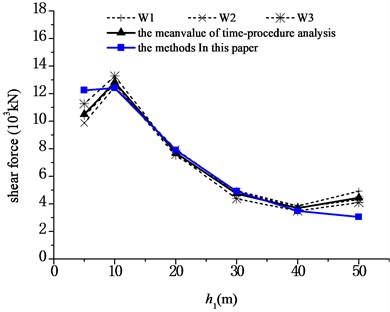
Fig. 10Comparison of moments at pier bottom
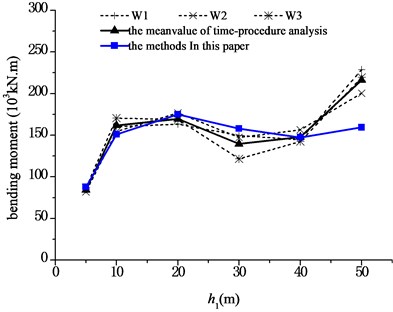
Fig. 11Comparison of displacements at aqueduct top
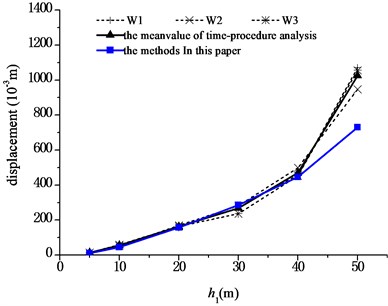
In conclusion, when the pier height is less than 40 m, the simplified analysis method proposed in this paper can be used to evaluate the transverse seismic response of aqueducts with fine precision.
Fig. 12Error analysis of seismic response calculation
4.2. Comparison with experimental results
On the other hand, a shaking table test of a scale model for the seismic performance evaluation of an aqueduct subjected to various seismic earthquake inputs was prepared as shown in Fig. 13. The aqueduct shell is made of plexiglass, while the pier is made of a square steel tube (Q235). The aqueduct shell dimensions are 400 mm×300 mm×250 mm (length×width×height), the pier cross-section is 20 mm×20 mm×2 mm, and the aqueduct pier height is 1200mm. The fundamental period of the test structure without water is 0.21 s. The measurement equipment for test structure consists of one horizontal accelerometer and three position sensors located at the aqueduct; one horizontal accelerometer located at the shaking table and four strain sensors located at the pier bottom are shown in Fig. 13(a).
Fig. 13Design of test model
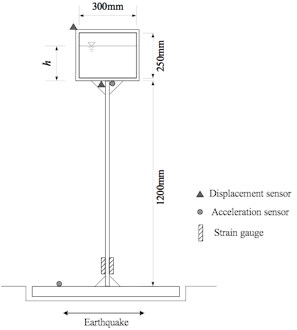
a) Dimensions and sensor locations of test structure
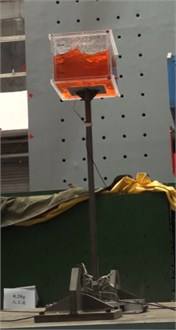
b) Overview of test structure
Shaking table tests were carried out using the unidirectional shaking table facility. The main dimensions of the table are 2 m×2 m×2 m. The aqueduct width is in the direction of vibration. And, the input motions as shown in terms of the response spectra in Fig. 14 were used.
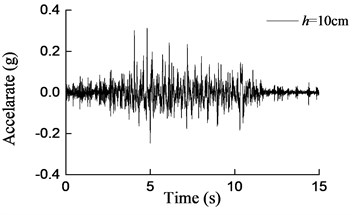
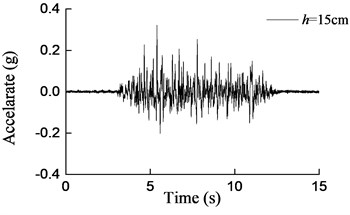
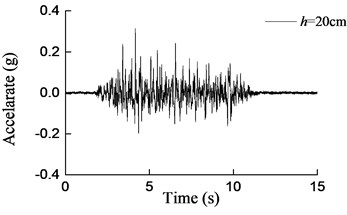
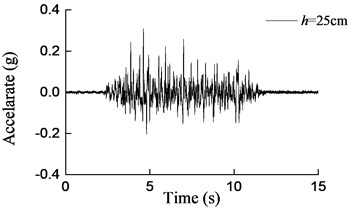
It can be seen that both the aqueduct top displacement responses and the pier bottom moment responses increase drastically as the earthquake intensity increases, as compared with the base motion of the shaking table. And as the water depth increases, the responses of the model increase gradually. On the other hand, the maximum responses obtained from the shaking table test and the theoretical analysis are compared in Table 6 and Table 7. It could easily be found that the results obtained by Eq. (25) and Eq. (26) are in a reasonable agreement with the test results for the water depth which increases from 10 cm to 20 cm. And with the increase of water depth, the differences between the results tend to decrease. More concretely, when the water depths are 10 cm, 15 cm and 20 cm, the maximum errors are 29 %, 20.1 % and 12.2 % respectively. Considering the randomicity and complexity of water movement, the differences can be considered as acceptable. However, for h= 25 cm, namely the aqueduct full of water, the maximum error is 44.8 %. In this case, the formula derived in this paper cannot predict the lateral seismic response effectively because the upper surface of water is not free which is inconsistent with assumptions of the formula.
Fig. 14Response spectra of input motions used for shaking table tests
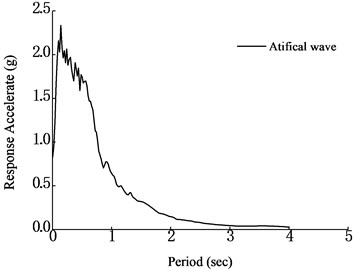
Fig. 15Curves of acceleration at aqueduct bottom with different water depths under earthquake action (0.2 g)
a)h= 10 cm
b)h= 15 cm
c)h= 20 cm
d)h= 25 cm
Table 6Comparison of bending moments at pier bottom (×10-3kN∙m)
0.1 g | 0.2 g | 0.3 g | 0.4 g | |||||||||
h (cm) | Test | Eq. (25) | e (%) | Test | Eq. (25) | e (%) | Test | Eq. (25) | e (%) | Test | Eq. (25) | e (%) |
10 | 32.9 | 30.2 | –8.2 | 70.9 | 65.1 | –8.2 | 138.2 | 98.1 | –29.0 | 180.7 | 132.8 | –26.5 |
15 | 36.4 | 39.6 | 8.8 | 88.3 | 79.2 | –10.3 | 154.9 | 123.8 | –20.1 | 187.8 | 166.9 | –11.1 |
20 | 46.1 | 43.7 | –5.2 | 106.5 | 93.5 | –12.2 | 155.3 | 145.0 | -6.6 | 187.1 | 196.9 | 5.2 |
25 | 56.8 | 49.3 | –13.2 | 159.3 | 107.8 | –32.3 | 275.2 | 164.1 | –40.4 | 401.8 | 221.7 | –44.8 |
e=Eq.(25)-testtest×100%. | ||||||||||||
Table 7Comparison of displacement at aqueduct top (mm)
0.1g | 0.2g | 0.3g | 0.4g | |||||||||
h (cm) | Test | Eq. (26) | e (%) | Test | Eq. (26) | e (%) | Test | Eq. (26) | e (%) | Test | Eq. (26) | e (%) |
10 | 3.1 | 3.0 | –3.2 | 6.5 | 6.4 | –1.5 | 12.4 | 9.7 | –21.8 | 16.5 | 13.1 | –20.6 |
15 | 3.2 | 3.9 | 21.2 | 7.9 | 7.7 | –2.5 | 13.6 | 12.1 | –11.0 | 17.0 | 16.3 | –4.1 |
20 | 4.3 | 4.2 | -2.3 | 9.8 | 9.0 | –8.2 | 13.8 | 14.0 | 1.5 | 16.5 | 19.0 | 15.2 |
25 | 5.2 | 4.7 | –10.1 | 14.8 | 10.2 | –30.7 | 25.9 | 15.6 | –39.8 | 36.2 | 21.1 | –41.8 |
e=Eq.(26)-testtest×100%. | ||||||||||||
Fig. 16Curves of transversal displacement at aqueduct top with different water depths under earthquake action (0.2 g)
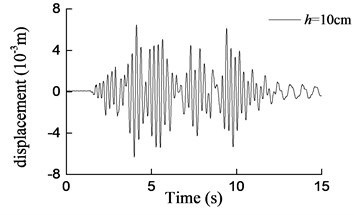
a)h= 10 cm
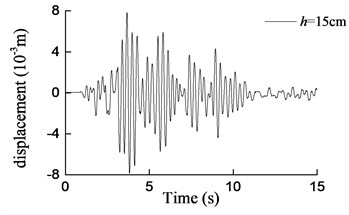
b)h= 15 cm
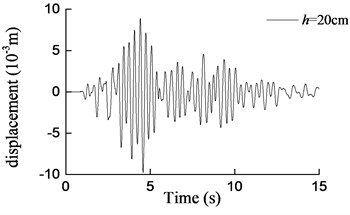
c)h= 20 cm
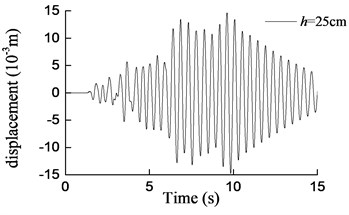
d)h= 25 cm
5. Conclusions
Based on the fluid-structure interaction dynamics and response spectra analysis, a simplified analysis method to evaluate the transverse seismic response of aqueducts was studied. And the comparisons of simplified calculation results and shaking table experiment results as well as FEM simulated results were done. The main works and conclusions were as follows:
1) Based on the fluid-structure interaction theory and seismic response spectrum calculation method, the simplified calculation formulas for the transverse seismic response of aqueducts were derived. The comparisons of simplified calculation results and shaking table experiment results as well as the FEM simulated results proved that the simplified calculation formulas were reliable.
2) The simplified formulas put forward in this paper can be used to calculate the transverse seismic response of aqueducts. Especially when the pier height is less than 40 m, the first-order vibration mode has a higher contribution rate; the simplified formulas may achieve fine calculation precision.
3) When the pier height of the aqueduct exceeds 40 m, and the contribution rate of the first-order vibration mode decreases as the pier height increases, the calculation precision of the simplified formulas begins to decrease.
4) The simplified formulas are applicable to the seismic response of aqueduct with the free upper boundary of water. The calculation precision is not very good for a closed aqueduct full of water.
References
-
Holger H. Global water resources and their management. Journal of Environmental Management, Vol. 90, Issue 2, 2009, p. 1219-1228.
-
Elizabeth C., Keith R., Richard F., et al. Integrated representation of the services provided by global water resources. Journal of Environmental Management, Vol. 129, Issue 18, 2013, p. 456-462.
-
Jay R. L., Morris I. Water transfers in water-resource systems. Journal of Water Resources Planning and Management, ASCE, Vol. 121, Issue 2, 1995, p. 193-204.
-
Ozturk I., Erturk A., Ekdal A., et al. Integrated watershed management efforts: case study from Melen watershed experiencing interbasin water transfer. Water Science and Technology Water Supply, Vol. 13, Issue 5, 2013, p. 1272-1280.
-
Marachi N. D., Seed R. B. Seismic risk assessment for a lifeline aqueduct system. Developments in Geotechnical Engineering, Vol. 45, 1987, p. 415-426.
-
Scira M. Chains of damages and failures in a metropolitan environment: some observations on the Kobe earthquake in 1995. Journal of Hazardous Materials, Vol. 86, Issues 1-3, 2001, p. 101-119.
-
Pagano A. Bayesian vulnerability assessment tool for drinking water mains under extreme events. Natural Hazards, Vol. 74, Issue 3, 2014, p. 2193-2227.
-
Chen G. X., Jin D. D., Mao J., et al. Seismic damage and behavior analysis of earth dams during the 2008 Wenchuan Earthquake, China. Engineering Geology, Vol. 180, 2014, p. 99-129.
-
Housner G. W. Dynamic pressures on accelerated fluid containers. Bulletin of the Seismological Society of America, Vol. 47, Issue 1, 1957, p. 15-35.
-
Medhat A. H. Vibration studies and tests of liquid storage tanks. Earthquake Engineering and Structural Dynamics, Vol. 11, Issue 2, 1983, p. 179-206.
-
Edwards N. W. A Procedure for Dynamic Analysis of Thin Walled Cylindrical Liquid Storage Tanks Subjected to Lateral Ground Motions. Ph.D. Thesis, University of Michigan, 1969.
-
Barton D. C., Parker J. V. Finite element analysis of seismic response of anchored and unanchored liquid storage tanks. Earthquake Engineering and Structural Dynamics, Vol. 15, Issue 3, 1987, p. 299-322.
-
Donea J., Fasoli Stella P., Giuliani S. Lagrangian and Eulerian finite element techniques for transient fluid–structure interaction problems. International Conference on Structural Mechanics in Reactor Technology, San Francisco, USA, 1977, p. 1-12.
-
Belytschko T., Kennedy J. M., Schoeberle D. F. Quasi-Eulerian finite element formulation for fluid-structure interaction. Journal of Pressure Vessel Technology, ASME, Vol. 102, Issue 1, 1980, p. 62-69.
-
Huerta A., Liu W. K. ALE formulation for large boundary motion. International Conference on Structural Mechanics in Reactor Technology, Los Angeles, USA, 1989, p. 335-346.
-
Zhang J. F., Liu Y. H., Wang Y., Yu Y. B. Seismic response analysis of water-aqueduct-pier system. Journal of Xian University of Technology, Vol. 15, 1999, p. 46-51.
-
Liu Y. H., Hu B. Z., Yan J. W., Wang K. C. Applicability of Housner model to seismic characteristics calculation of aqueduct. Journal of Hydraulic Engineering, Vol. 9, 2002, p. 94-99, (in Chinese).
-
Li Y. C., Di Q. S., Gong Y. Q. Equivalent mechanical models of sloshing fluid in arbitrary-section aqueducts. Earthquake Engineering and Structural Dynamics, Vol. 41, Issue 6, 2012, p. 1069-1087.
-
Hu S., You R., Niu Z., Lu J. Dynamic analysis of tall-Pier aqueduct using ODE solver. International Joint Conference on Computational Science and Optimization, 2010, p. 68-72.
-
Li Y., Lou M., Pan D. Evaluation of vertical seismic response for large-scale beam-supported aqueduct. Earthquake Engineering and Structural Dynamics, Vol. 32, Issue 1, 2003, p. 1-14.
-
Li Y. C., Di Q. S. Numerical simulation of dynamic characteristics of cable-stayed aqueduct bridge. Earthquake Engineering and Engineering Vibration, Vol. 10, Issue 4, 2011, p. 372-380.
-
Zhang H., Sun H., Liu L., Dong M. Resonance mechanism of wind-induced isolated aqueduct-water coupling system. Engineering Structures, Vol. 57, Issue 4, 2013, p. 73-86.
-
Wu Y., Mo H. H., Yang C. Study on dynamic performance of three-dimensional high frame supported U-shaped aqueduct. Engineering Structures, Vol. 28, Issue 3, 2006, p. 569-579.
-
Code for Seismic Design of Buildings (GB50011-2010). China Architecture and Building Press, Beijing, 2010, (in Chinese).
-
Code for Seismic Design of Outdoor Water Supply, Sewerage, Gas and Heating Engineering (GB50032-2003). China Architecture and Building Press, Beijing, 2003, (in Chinese).
-
Ju R. C., Zeng X. C. Elastic Structure-Liquid Coupling Dynamic Theory. Seismological Press, Beijing, 1983, p. 40-93, (in Chinese).
-
Guidelines for Seismic Design of Highway Bridges (JTG/T B02-01-2008). China Communications Press, Beijing, 2008, (in Chinese).

