Abstract
Rolling bearings are one of critical components in rotating machines. The importance of monitoring the bearings conditions to prevent the breakdown of system is becoming more and more obvious. Vibration and shock pulse method (SPM) are the two popular methods for detecting the bearings fault. Vibration method and theory have been comprehensively studied. SPM has gained a wide acceptance in industrial applications. But few studies have compared the superiority of the two methods, especially utilizing the industrial data. In order to solve this problem, a gearbox test rig of wind turbine is set up. Vibration device and SPM instrument are used to monitor and acquire the condition data of bearings respectively. Through analyzing the derived frequency spectrum, a conclusion that SPM is superior to vibration when detecting the bearings fault in industrial applications has been derived.
1. Introduction
As basic components of gearboxes in drive trains, rolling bearings are widely used in wind turbines. In industrial applications, bearings are considered as critical mechanical components and one defect may lead to catastrophic failure of the wind turbines. Condition monitoring is an effective way to detect the defects and prevent the failures of bearings. A lot of researchers have studied fault characteristic of bearings and proposed some effective methods to detect and diagnose the defect of rolling bearings [1]. A review of vibration and acoustic measurement methods for the detection in rolling bearings is presented for bearings condition monitoring by Tandon and Choudhury [2]. Among these methods, vibration and shock pulse method (SPM) perhaps are the most widely researched and utilized methods.
Vibration signal theory and analysis of rolling bearings have been widely researched. The vibration signals include time-domain and frequency-domain [3, 4]. Frequency-domain, or spectral analysis, is perhaps the most widely used approach for detecting the bearing defect. Fast Fourier transform (FFT) is generally used to generate vibration signal frequency spectrum and the application of reasonable window functions and smoothing techniques can improve the quality of the frequency analysis of vibration signals [5]. The occurrence of modern FFT has made the study of obtaining narrowband spectra easier and more efficient [6].
Shock pulse method (SPM) has been widely used as a quantitative method for detecting the bearings fault and reported to be successful in industrial applications [7]. SPM, which is derived from SPM instrument, is a patented technique for using signals from rotating element bearings as the basis for efficient condition monitoring of machines. SPM can provide a direct shock value indicating the bearing condition. By collecting the shock values under different operating conditions, the trend of shock values can be analyzed to predict the operating condition of bearings being tested. SPM dianositics reports not noly conditon of rotating bearings but also thickness of lubricating oil, which helps maintenance staff for performing effective preventive maintenance in proper timing. Through years of testing and researching, SPM has been developed and perfected so as to represent the “true” operating condition of the bearing being monitored [2].
Even though both vibration and SPM have the unique advantage in detecting the bearing fault and wide application to some extent, very few studies have been carried out on comparison of vibration and SPM for bearings monitoring. Moreover, the relevant studies in existence mostly rely on the experiment data to validate the SPM or vibration, but merely on the actual industrial data. Hence, a speed-up gearbox test rig of wind turbine is set up. Vibration device and SPM instrument are employed to inspect the bearings condition. The comparison of vibration frequency spectrum and SPM frequency spectrum is implemented to study the superiority of vibration and SPM on monitoring bearings fault.
2. The gearbox experiment of wind turbine
The theory of SPM and vibration are widely used in actual industrial applications. In order to comparing the difference and superiority between SPM and vibration, a wind turbine gearbox test rig is built. Both SPM instrument and vibration device are applied to inspect the bearings status and detect the bearings fault. Fig. 1 presents the wind turbine gearbox test rig.
Fig. 1The gearbox test rig of wind turbine
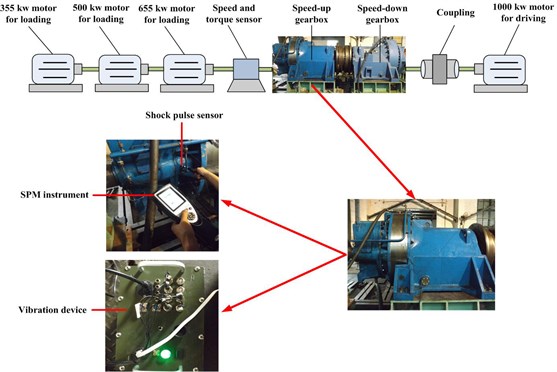
The test rig includes a speed-down gearbox and speed-up gearbox. One motor is used for providing the power for gearboxes and three motors are used for loading. Moreover, a speed and torque sensor used for measuring the rotating speed and torque is also contained. The speed-up gearbox is the test objective, including the stationary ring gear, sun gear rotating around a fixed center, planet gears rotating around both their own centers and the center of sun gear. The planet gears mesh with the sun gear and the ring gear simultaneously. The inner structure of test gearbox is shown in Fig. 2, which also presents the measuring locations of monitoring by SPM instrument and vibration device.
Fig. 2The inner structure and measuring points location of test gearbox
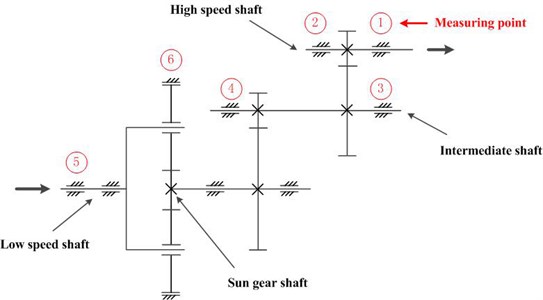
Four shafts are indicated in Fig. 2, namely low speed shaft as input shaft, high speed shaft as output shaft, sun gear shaft and intermediate shaft. In this gearbox, low speed shaft drives the planet gear. Sun gear meshes with planet gear and gear of intermediate shaft. The gear of intermediate shaft meshes with gear of high speed shaft. Both vibration device and SPM instrument have six measuring points and the location is same. But SPM only tests in the radial direction, while vibration device tests the gearbox in the three direction: horizontal, vertical and axial respectively. On the other hand, different working conditions are set with four kinds of load: 25 %, 50 %, 75 % and 100 % respectively. However, the rotating speed of high speed shaft (output shaft) is constant at 1517 rpm.
3. Results and discussion
Vibration device and SPM instrument are employed to monitoring the bearings state. Under four different kinds of load, the diagrams of frequency spectrum utilizing SPM instrument and vibration device are derived. Given the limited space, here we only list the frequency spectrum measured at the measuring point 2, as depicted in Fig. 3 and Fig. 4.
Fig. 3The diagram of frequency spectrum at measuring point 2 by SPM instrument
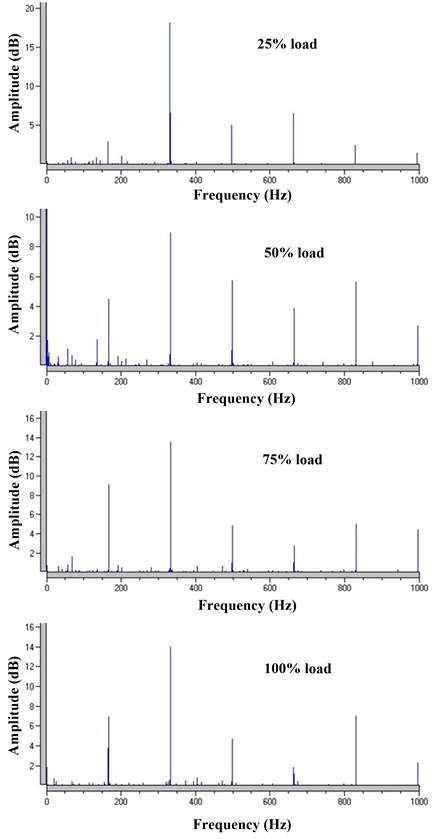
SPM instrument can utilize the embedded SPM spectrum module and hand-held shock pulse sensor to implement the data acquisition and processing. The real-time frequency spectrum diagrams can be derived and present automatically. We can analyze the bearings state according to the frequency spectrum conveniently, while the original data and signal cannot be derived. However, it always can satisfy the need of industrial application. On the other hand, we can derive real-time data by vibration device. Therefore, we can implement data processing to diagnose and locate the bearings fault using different signal processing methods. The frequency spectrum in Figure 4 is processed straightforwardly by Fast Fourier Transform (FFT).
Fig. 4The diagram of frequency spectrum at measuring point 2 by vibration device
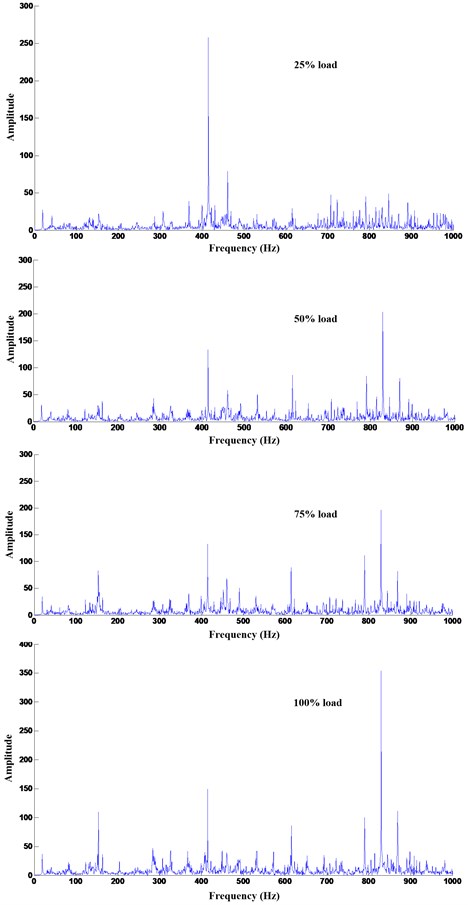
From the Fig. 3, the spectral lines are relatively uniform. The spectral peaks appear five times and the spacing between adjacent lines is equal. Characteristic of frequency doubling is quite obviously. As we all known, the purpose of frequency spectrum is to reveal the line patterns associated with bearing faults. Characteristic for many fault patterns is the presence of ‘multiples’ or ‘harmonics’, which means that the line (or group of lines) is repeated two, three or more times further up in the frequency spectrum. In other words, the spacing is 1Z, 2Z, 3Z,..., nZ, where Z is the frequency of the first line. Based on this theory, a preliminary conclusion can be drawing that bearing at measuring point 2 is faulty. But we cannot derive any explicit conclusion from the Fig. 4, in which the frequency spectrum is processed by FFT. Despite the spectrum peaks occur occasionally, there do not exist periodical characteristic obviously. Therefore, any conclusion cannot be derived.
Fig. 5The diagram of frequency spectrum analysis at measuring point 2
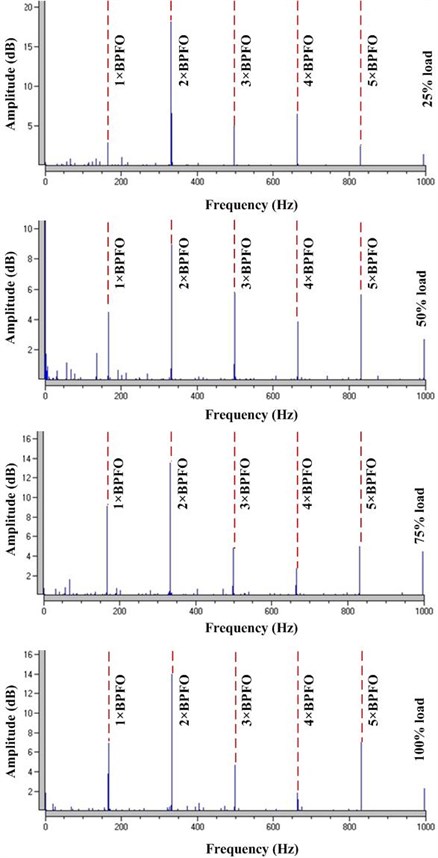
Comparing the frequency spectrum derived by SPM instrument and vibration device, we can explicitly detect the bearings fault by analyzing the SPM frequency spectrum. However, through the vibration frequency spectrum, we cannot get any valuable conclusion. Moreover, the SPM instrument is hand-held and simple to use so that semiskilled personnel can operate them, but vibration device is relatively hard to carry and operate. This is also a reason for the wide application of SPM instrument. So, a conclusion that SPM is superior to vibration when detecting the bearings fault in industrial application can be derived.
In above theoretical analysis, we diagnose the faulty bearing at a certain extent, but cannot locate explicitly. To address this issue, the characteristic frequency of each element in the faulty bearing will be calculated.
According to the recorded speed of output shaft (1517 rpm), the speed of faulty bearing is approximate 25.28 Hz. In the spectrum diagrams at measuring point 2, spectral peaks appear five times with equal spacing. The frequency of peak value occurring for the first time is 166.25 Hz. So, we can derive the characteristic frequency of faulty position is 6.58 Hz. In contrast with Table 1, the most approximate frequency is 6.59 Hz, the characteristic frequency of outer race. Therefore, the diagnosis result is faulty outer race. We label the spectral peaks in terms of the characteristic frequency in the spectrum at measuring point 2. Fig. 5 shows the analysis results.
From the maintenance record of industry, we know that bearings in the test gearbox have been replaced with new ones during the overhaul period. However, there still exists faulty outer race in high speed shaft. Since the bearings are used for the first time, the common faults like fatigue, wear, corrosion etc. are not existent, so there is more likely that assembly errors lead to the faulty outer race. When opening the test gearbox, we found assembly errors indeed exist, which is consistent with the analysis result. Accordingly, we suggest reassembling to avoid the further fault.
Table 1Characteristic frequency of bearing in high speed shaft input end (Hz)
Position | Characteristic frequency |
Outer race | 6.59 |
Inner race | 9.41 |
Rolling element | 2.68 |
Cage | 0.412 |
4. Conclusions
Vibration and SPM are the two popular methods for detecting the bearings fault. In order to study the superiority of vibration and SPM using actual industrial data, the gearbox test rig of wind turbine is built. Two different kinds of data are derived by vibration device and SPM instrument. Through analysis of derived experimental results, a basic conclusion that SPM is superior to vibration on detecting bearings fault in industrial applications can be drawn.
References
-
Randall R. B., Antoni J. Rolling element bearing diagnostics – a tutorial. Mechanical Systems and Signal Processing, Vol. 25, 2013, p. 485-520.
-
Tandon N., Yadava G. S., Ramakrishna K. M. A comparison of some condition monitoring techniques for the detection of defect in induction motor ball bearings. Mechanical Systems and Signal Processing, Vol. 21, 2007, p. 244-256.
-
Qiu H., Lee J., Lin J., Yu G. Wavelet filter-based weak signature detection method and its application on rolling element bearing prognostics. Journal of Sound and Vibration, Vol. 289, Issues 4-5, 2006, p. 1066-1090.
-
Peng Z. K., Tse P. W., Chu F. L. A comparison study of improved Hilbert-Huang transform and wavelet transform: application to fault diagnosis for rolling bearing. Mechanical Systems and Signal Processing, Vol. 19, 2005, p. 974-988.
-
Guo D., Peng Z. K. Vibration analysis of a cracked rotor using Hilbert-Huang transform. Mechanical Systems and Signal Processing, Vol. 21, Issue 8, 2007, p. 3030-3041.
-
Su Y. T., Sheen Y. T. On the detectability of roller bearing damage by frequency analysis. Proceedings of the Institution of Mechanical Engineers, Vol. 207, Issue 1, 1993, p. 23-32.
-
Yang W. X., Tavner P. J. Empirical mode decomposition, an adaptive approach for interpreting shaft vibratory signals of large rotating machinery. Journal of Sound and Vibration, Vol. 321, Issues 3-5, 2009, p. 1144-1170.
-
Li Z., He Z. J., Zi Y. Y., Chen X. F. Bearing condition monitoring based on shock pulse method and improved redundant lifting scheme. Mathematics and Computers in Simulation, Vol. 79, 2008, p. 318-338.
