Abstract
Rolling bearing is essential component of most rotating machinery, fault diagnosis of rolling bearing is significant for enhance the reliability of mechanical device. It is becoming a hot research topic recent years. There are some disadvantages for existing methods, like computing complex, long spending time and so on. In order to overcome these shortcomings of existing methods, this paper present a modified K-means cluster analysis which is used to bearing fault diagnostics. And the data of Case Western Reserve University are used to validate effectiveness of the proposed method.
1. Introduction
Deep groove ball bearing is composed of inner raceway, outer raceway, rolling body and retainer. It is widely used in rotating machinery due to its high speed, small friction and other advantages, for instance, automobile, aircraft and so on all use bearing to supporting and rotating. Even though bearing is a very inexpensive element, its failure can interrupt the production in a plant causing unscheduled downtime and production losses. Therefore, the fault diagnosis of the rolling bearing has important significance to improve the reliability of mechanical equipment.
Vibration signal analysis is a commonly used approach of bearing fault diagnosis. But there are some challenges for vibration signal analysis. Firstly, the acquired signal often contain non-stationary and nonlinear characteristics. In addition, the signal always contain some noise as the complex and harsh working environment of the bearing. To solve these problems, many scholars and experts have carried out a lot of research and obtained a large number of research results.
An et al. [1] evaluate the health status of rolling bearing by using adaptive iterative filtering and envelope spectrum. Zuo and Feng [2, 3] and their research teams carry out a lot of research about fault diagnosis of planetary gear box bearing by using the vibration signal analysis and have achieved remarkable results. Qiu et al. [4] using Morlet wavelet to filter the bearing vibration signal noise to detect weak fault of the bearing. Xie et al. [5] proposed the method of fault diagnosis for bearing with considering continuous wavelet decomposition and extraction of the strongest pulse signal component. Long et al. [6] constituted the wavelet packet energy spectrum combine with the fast principal component analysis to diagnose the fault signal of the bearing. In addition, some researchers proposed using artificial intelligence method to diagnose fault of the bearing.
Subrahmanyam [7] considering using neural network to diagnose fault of the ball bearing and achieved a higher recognition rate. Muhammet [8] extracted characteristic parameters by using fast Fourier transform, and combined genetic algorithm with neural network to detect the fault of the bearing. Li et al. [9] using modified ant colony algorithm to confirm parameters of the support vector machine, and the support vector machine is used to fault diagnosis of rolling bearing, the method can obtained higher accuracy rate after validation. Chen et al. [10] proposed using multi support vector machine to identify the multi fault pattern of rolling bearing, and particle swarm potimization algorithm is used to optimize the parameters of the support vector machine.
But the existing methods still have some shortcomings. For instance, computing complex, long spending time and so on. These problems lead to application of the method is not strong. In addition, the artificial intelligence method requires a lot of training data and relative long training time. So, the paper proposed a modified K-means clustering analysis to using in fault diagnosis of the bearing and the effectiveness of this approach has been validated.
2. Feature parameter extraction
In this paper, there are some time domain parameters which represent the characteristic of failure are extracted for fault diagnosis. These time domain parameters include energy, root mean square and peak value. These parameters calculation formulas are shown as following.
The energy xene refers to the square sum of the amplitude of discrete vibration signals:
The root mean square xrms refers to the square of mean square value for discrete vibration signals:
The peak value xp refers to the maximum value of the amplitude absolute value of the discrete vibration signal:
In the above formulas, xi represents discrete vibration signal.
3. Theory of modified K-means cluster analysis
In this section, the theory of K-means for clustering analysis is explained. The K-means algorithm is the most well known and fast method in non-hierarchical cluster algorithms. And it is used in various fields for the simplicity of K-means algorithm. The K-means method is a partitioning clustering way that separates data into k mutually excessive groups. The K-means method is one of dynamic clustering algorithm. First, the K points are chosen as initial starting cluster center, and the distance from each data to each center is calculated. [11] Then the minimum distance sample is classified as nearest cluster center as shown in the Fig. 1.
Fig. 1Sample clustering process
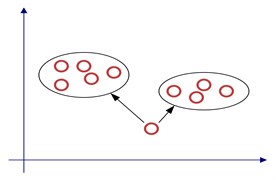
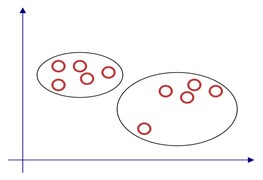
But there is a key problem of K-means algorithm which influence the clustering effect. The key problem is the selection of initial centers. The traditional K-means cluster analysis uses the randomized method to determine the initial centers. However, using this method can lead to the generation of empty clusters and the consequences of the dead cycle. Therefore, to solve this shortcoming Murat Erisoglu [12] proposed a modified method to chose the initial centers.
First compute the mean value of the all points, shown as follows:
Then compute the Euclidean distance from all point to mean value point, and chose the point which the Euclidean distance to the mean value point as the first initial center. The calculation formula is shown as follows:
Then using the same calculation method to obtain second initial center, the only difference is that reference point is the first initial center instead of the mean value point. The calculation formula is shown as follows:
Then chose the next point, the third initial center is the point which max Euclidean distance to the first two initial center points as the third initial center point:
The above work is repeated until the initial center reaches the expected number of clusters. The modified method can improve the efficiency of cluster analysis and reduce the iteration in the calculation process.
4. A case study
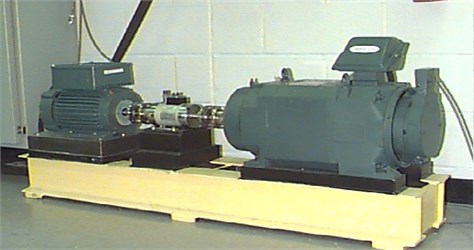
In this paper, the bearing data of Case Western Reserve University is used to validate the proposed method. As shown in Fig. 2, the test stand of Case Western Reserve University consists of a 2 HP motor, a torque transducer, a dynamometer and control electronics. The test bearings support the motor shaft. Single point faults were introduced to the test bearings using electro-discharge machining with diameters of 7 mils, 14 mils, 21 mils and 28 mils. The fault location covers the inner raceway, outer raceway and rolling elements, the load variation range is 0-3 HP and the speed variation range is 1730-1797 rpm. The signal sampling frequencies are 12 kHz and 48 kHz [13]. There are two types of bearing in this experiment, SKF 6205 and SKF 6203 bearings, and drive end bearing is SKF 6205, fan end bearing is SKF 6203.
Fig. 2Bearing test stand
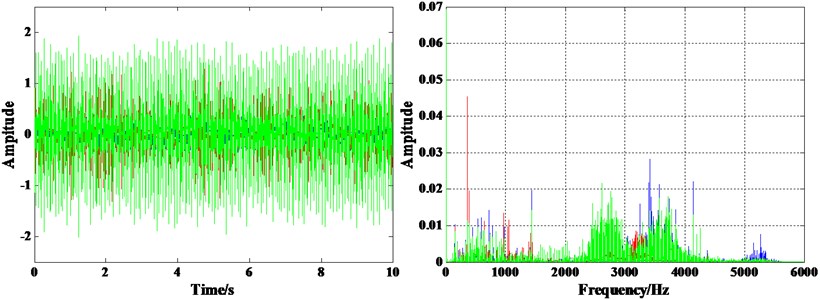
Firstly, the vibration signal is analyzed by Fourier transform before using the proposed method, and the analysis result of three kinds of fault state is shown as Fig. 3. There is no significantly difference between the three fault states. Therefore, the proposed method is used to fault diagnosis for rolling bearing.
Fig. 3Result of Fourier transform for bearing in three kinds of fault state
The 14mils and 21mils fault data are chose to validate the proposed method. Ten sets of data were extracted from each work condition and each health state, the sample time for each set of data is 2 seconds. There are four work conditions for each health state, so there are 160 sets of data for all health state. The energy, RMS and peak value are extracted to form a characteristic matrix of 3 by 160 from the 160 sets of data. The characteristic matrix is used as the input of the modified K-means clustering, and the fault diagnosis is carried out by the proposed method. The cluster result is shown as Fig. 4 and Fig. 5.
Fig. 421 miles fault data clustering results
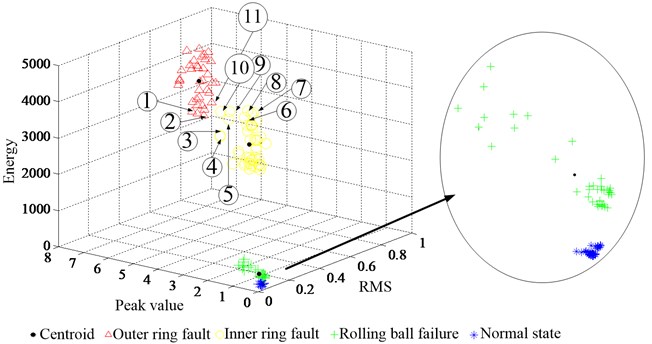
As shown above the Fig. 3, there are eleven sample points are wrong recognized by the proposed method. The first, second and eleventh sample points are wrong recognized for outer raceway fault instead of inner raceway fault. The eight sample points that from third to tenth are wrong recognized for inner raceway fault instead of outer raceway fault. The rolling ball fault sample and normal state sample are recognized with no mistake. So, the accuracy rate is percent of 93.125. There are fifteen sample points are wrong recognized as shown the Fig. 4. The sixth, seventh and tenth samples for outer raceway fault judged for the inner raceway fault by mistake. The forth, fifth, eighth, ninth and from eleventh to fifth samples for inner raceway fault judged for outer raceway fault by mistake. Thus, the accuracy rate is percent of 90.625. The reason for the accuracy rate of 14 miles fault data is lower than the accuracy rate of 21 miles fault is almost that the shock reduced. To validate effectiveness of the proposed method the 14 miles and 21 miles data are using to cluster analysis by traditional K-means algorithm. The result is shown as Fig. 6.
Fig. 514 miles fault data clustering results
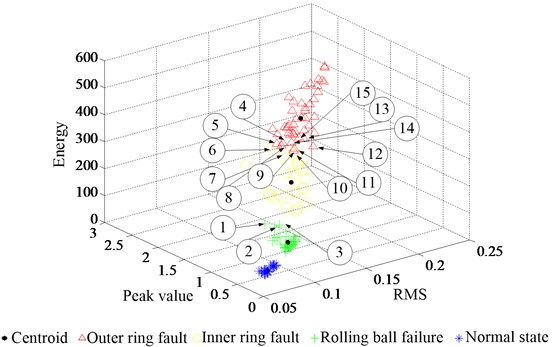
Fig. 6The health cluster result of 21 miles and 14 miles data by traditional K-means clustering
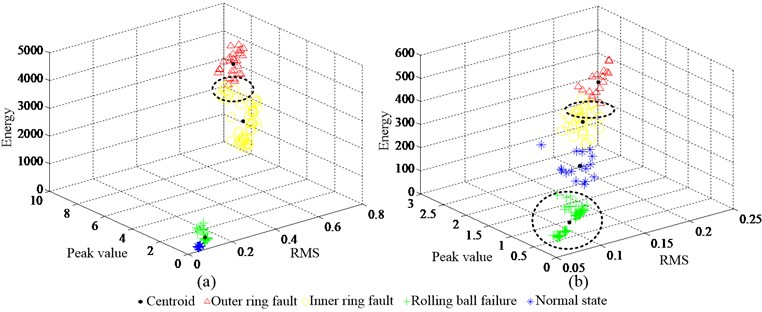
As shown the circular logo area of Fig. 5(a), there are 23 samples of outer raceway fault and inner raceway fault are wrong recognized for 21 miles fault data, and the accuracy rate is percent of 85.625. And in the Fig. 5(b), there are 97 samples are recognized correctly. The accuracy rate only is percent of 58.75. The accuracy rate comparison is shown as the Table 1.
Table 1Contrast of accuracy rate of different method
Accuracy rate | Traditional method | Modified method |
Data of 21 miles diameters fault | 85.625 % | 93.125 % |
Data of 14 miles diameters fault | 58.75 % | 90.625 % |
5. Conclusions
This paper deals with the issue of fault diagnosis for rolling bearing using modified K-means cluster analysis. The data of Case Western Reserve University is used to validate the proposed method. It is demonstrated that the modified K-means algorithm is better than the traditional K-means algorithm.
References
-
An Xueli, Zeng Hongtao, Li Chaoshun Demodulation analysis based on adaptive local iterative filtering for bearing fault diagnosis. Measurement, Vol. 94, 2016, p. 554-560.
-
Feng Zhipeng, Ma Haoqun, Zuo Ming J. Amplitude and frequency demodulation analysis for fault diagnosis of planet bearings. Journal of Sound and Vibration, Vol. 382, 2016, p. 395-412.
-
Feng Zhipeng, Ma Haoqun, Zuo Ming J. Vibration signal models for fault diagnosis of planet bearings. Journal of Sound and Vibration, Vol. 370, 2016, p. 372-393.
-
Qiu H., Lee J., Lin J., Yu G. Wavelet filter-based weak signature detection method and its application on rolling element bearing prognostics. Journal of Sound and Vibration, Vol. 289, 2006, p. 1066-1090.
-
Xie L., Miao Q., Chen Y., Liang W., et al. Fan bearing fault diagnosis based on continuous wavelet transform and autocorrelation. IEEE Conference on Prognostics and System Health Management, 2012, p. 1-6.
-
Long Han, Cheng Wei Li, Song Lin Guo, et al. Feature extraction method of bearing AE signal based on modified FAST-ICA and wavelet packet energy. Mechanical System and Signal Processing, Vol. 62, Issue 63, 2015, p. 91-99.
-
Subrahmanyam M., Sujatha C. Using neural networks for the diagnosis of localized defects in ball bearings. Tribology International, Vol. 30, 1997, p. 739-752.
-
Unal Muhammet, Onat Mustafa Fault diagnosis of rolling bearings using a genetic algorithm optimized neural network. Measurement, Vol. 58, 2014, p. 187-196.
-
Li Xu, Zheng Anan, Zhang Xunan, et al. Rolling element bearing fault detection using support vector machine with modified ant colony optimization. Measurement, Vol. 46, 2013, p. 2726-2734.
-
Chen Fafa, Tang Baoping, Song Tao, et al. Multi-fault diagnosis study on roller bearing based on multi-kernel support vector machine with chaotic particle swarm optimization. Measurement, Vol. 47, 2014, p. 576-590.
-
Tan Pang-Ning, Steinbach Michael, Kumar Vipin Introduction to Data Mining. The People’s Posts and Telecommunications Press, Beijing, 2011.
-
Erisoglu Murat, Calis Nazif, Sakallioglu Sadullah A new algorithm for initial cluster centers in k-means algorithm. Pattern Recognition Letters, Vol. 32, 2011, p. 1701-1705.
-
http://csegroups.case.edu/bearingdatacenter/home
